. 2018 Oct 9;9(79):34889-34910.
doi: 10.18632/oncotarget.26175.

The anti-psychotic drug pimozide is a novel chemotherapeutic for breast cancer

Affiliations

The anti-psychotic drug pimozide is a novel chemotherapeutic for breast cancer

El-Habib Dakir et al. Oncotarget. .

Abstract

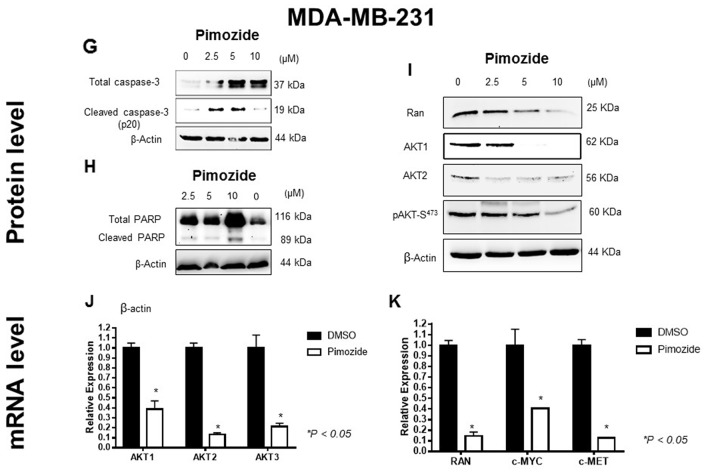
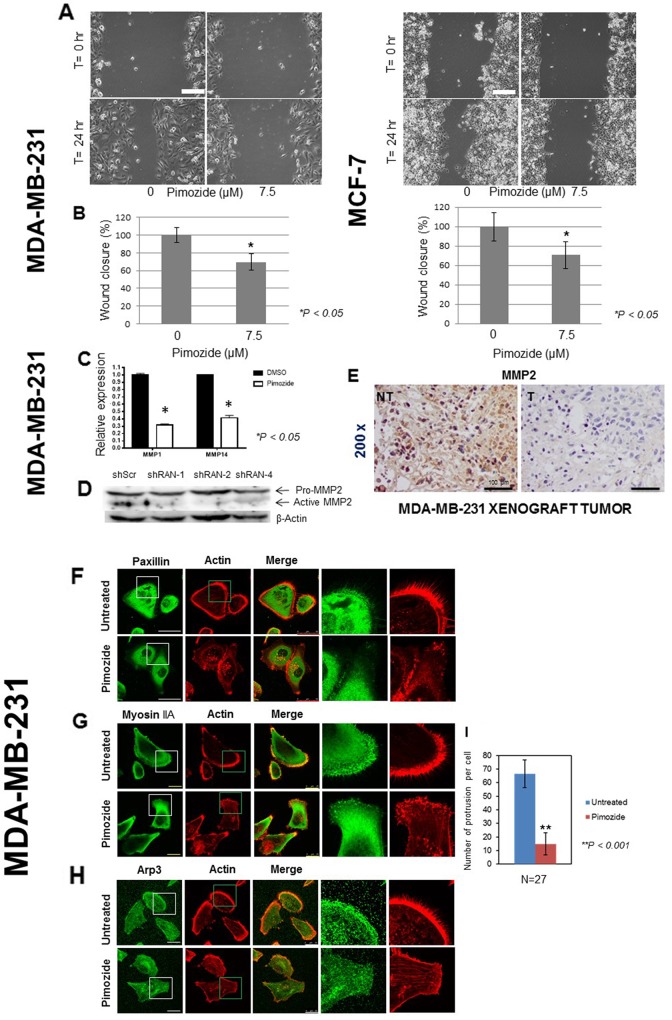
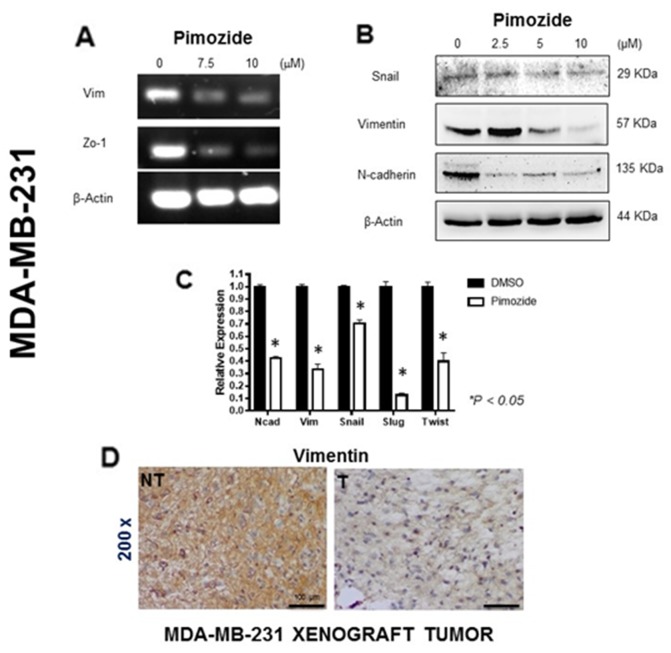
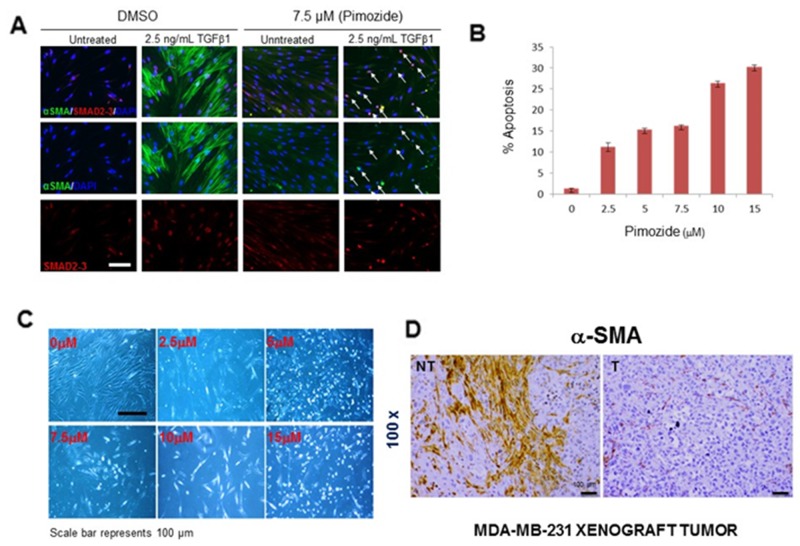
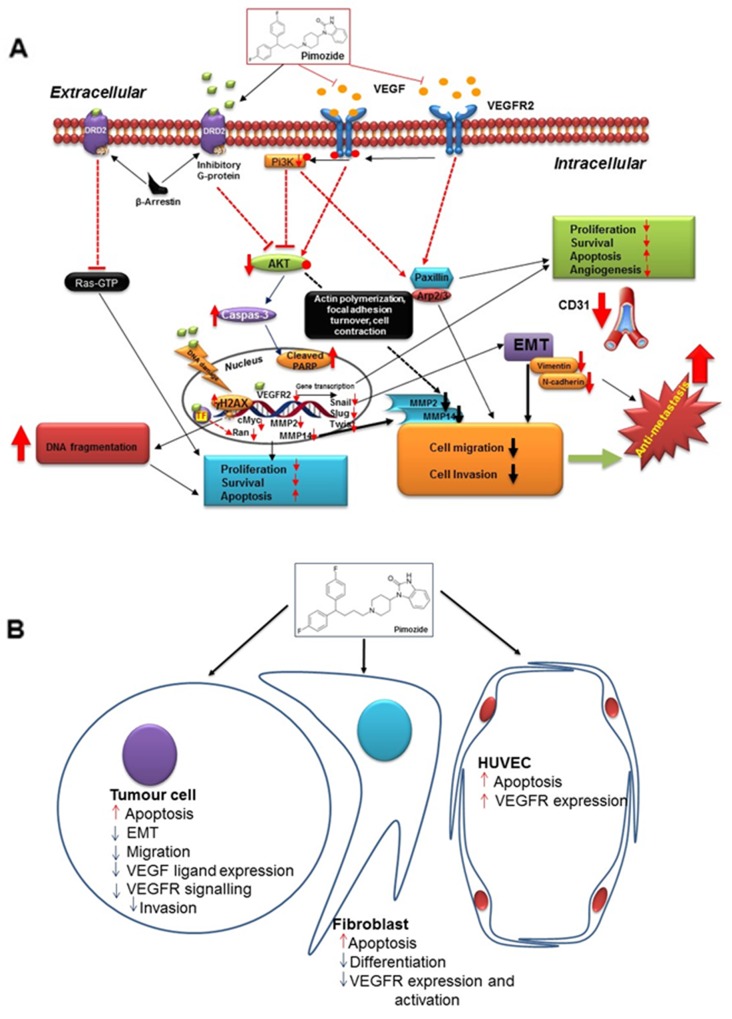
Pimozide, an antipsychotic drug of the diphenylbutylpiperidine class, has been shown to suppress cell growth of breast cancer cells in vitro. In this study we further explore the inhibitory effects of this molecule in cancer cells. We found that Pimozide inhibited cell proliferation in a dose- and time-dependent manner in MDA-MB-231 breast cancer cells and A549 lung cancer cells. Furthermore, we found that Pimozide also promoted apoptosis as demonstrated by cell cycle arrest and induction of double-strand DNA breaks but did not result in any effect in the non-transformed MCF10A breast cell line. In order to shed new lights into the molecular pathways affected by Pimozide, we show that Pimozide downregulated RAN GTPase and AKT at both protein and mRNA levels and inhibited the AKT signaling pathway in MDA-MB-231 breast cancer cells. Pimozide also inhibited the epithelial mesenchymal transition and cell migration and downregulated the expression of MMPs. Administration of Pimozide showed a potent in vivo antitumor activity in MDA-MB-231 xenograft animal model and reduced the number of lung metastases by blocking vascular endothelial growth factor receptor 2. Furthermore, Pimozide inhibited myofibroblast formation as evaluated by the reduction in α-smooth muscle actin containing cells. Thus, Pimozide might inhibit tumor development by suppressing angiogenesis and by paracrine stimulation provided by host reactive stromal cells. These results demonstrate a novel in vitro and in vivo antitumor activity of Pimozide against breast and lung cancer cells and provide the proof of concept for a putative Pimozide as a novel approach for cancer therapy.

Keywords: DSB; apoptosis; breast cancer; pimozide; xenograft.


Conflict of interest statement

CONFLICTS OF INTEREST The authors declare no conflicts of interest.

Figures

Figure 1
Figure 1. Pimozide inhibits cell proliferation in a dose- and time-dependent manner by inducing cell cycle arrest and DNA double strand breaks (DSBs)
(A) Phase contrast micrograph showing cell morphology of human breast cancer MDA-MB-231 and lung cancer A549 cells treated with Pimozide at different doses (μM) for 24 hours. Scale bar 100 μm. (B) Viability of MDA-MB-231 cancer cells, MCF10A normal breast cells, and A549 lung cancer cells after 48 hours treatment with Pimozide. (C) Cell cycle profiles. DNA content of fixed, propidium iodide-stained cells was analyzed by flow cytometry. MDA-MB-231 and A549 cells were incubated in the absence (control 0 μM of Pimozide with DMSO) or in the presence of Pimozide at different doses for 24 hours, and the percentage of cells in sub-G1 (M1) (hypodiploidy), G0/G1 (M2), S (M3), and G2/M (M4) phases calculated using flow cytometry. The data gatings are indicated for each DNA histogram for M1, M2, M3 and M4. The percentage of cells with a DNA content less than G1 (sub-G1) is indicated in each histogram. The cell cycle profiles shown, with the sub-G1 population indicated, are representative of three experiments performed. (D) Cell cycle profile (Sub-G1) summarized using a histogram. MDA-MB-231 and A549 cells were treated with different doses of Pimozide for 24 hours, and the percentage of cells in the sub-G1 phase of the cell cycle (dead and dying cells) was quantitated by flow cytometry. Data shown are means ± SD of three independent experiments, **, P < 0.01, Student’s t-test. (E & F) DNA damage response (DDR) measured after treatment with Pimozide, Doxorubicin (Doxo) and Paclitaxel (Pac). (E) Representative fields of DAPI-stained DNA showing nuclear damage after 7.5 μM Pimozide treatment. Some nuclei show signs of dynamic DNA membrane blebbing (white arrow) and fragmentation after treatment for 48 hours, whilst other nuclei remained unchanged. There is also fragmented DNA outside (red arrow), and inside the nucleus (yellow arrow) suggesting chromatin condensation after treatment. Magnification 200x. Scale bar 10 μm. (F) Staining for histone γH2AX in MDA-MB-231 cells treated with 7.5 μM Pimozide or with 2.5 μM Doxorubicin or 100 nM Paclitaxel for 24 hours, images are representative of three experiments performed. Magnification 200x for DMSO and Pimozide treatment. Scale bar 10 μm. Magnification 400x. Scale bar 10 μm for Doxorubicin and Paclitaxel treatment. Pimozide reduced the protein and RNA expression of AKT and Ran, as well as RNA expression of cMYC and cMET. (G) Western blotting analysis of Caspas-3 in MDA-MB-231 treated with Pimozide at different doses for 24 hours. β-Actin was used as a loading control. Data shown are representative of three experiments performed. (H) Western blotting analysis of PARP in MDA-MB-231 treated with Pimozide at different doses for 24 hours. β-Actin was used as a loading control. Data shown are representative of three experiments performed. (I) Western blotting analysis of Ran, AKT1, AKT2 and pAKT in MDA-MB-231 treated with Pimozide at different doses for 24 hours. β-Actin was used as a loading control. Data shown are representative of three experiments performed. (J) Relative mRNA expression of all AKT isoforms in MDA-MB-231 cells either untreated or treated with Pimozide 7.5 μM for 24 hours. Data shown are representative of three experiments performed. (K) Relative mRNA expression of Ran, c-MYC and c-MET in MDA-MB-231 cells treated with 7.5 μM Pimozide for 24 hours. Data shown are representative of three experiments performed.
Figure 2
Figure 2. Pimozide reduces tumor burden, cell proliferation, and the number of lung metastases in a nude mice xenograft model system
(A) In vivo bioluminescence imaging system (IVIS) of MDA-MB-231-Luc (D3H2LN) xenografts in SCID mice. Ventral (upper left panels) images taken over time from representative mice (10 imaged). Upper right panels show the Region of Interest (ROI) in localized tumors from representative mice (10 imaged). Pseudo color scale bars were consistent for all imaged ventral views in order to show relative changes at metastatic sites over time, lower left panel images show metastatic foci in control mice (G2NT), and the lower right panel shows the ROI in different mice (red arrow). (B) Characterization of tumors in untreated (PBS) and treated (Pimozide) groups by plotting tumor volume (mm3), tumor occurrence (%), ROI (photons/sec) and lung metastatic foci numbers with significance values at autopsy. Data shown are means ± SD (Student’s t test *P <0.05, **P < 0.01). (C) Hematoxylin & eosin (H&E) staining of xenograft tumors in untreated (NT) (a), earlier treated (TE) (b) and late treated (TL) (c) mice. Magnification 200x. Scale bar 100 μm. Immunohistochemical staining for Ki67 (d,e,f). Magnification 200x. Scale bar 100 μm, cleaved caspase-3 (g,h,i). Magnification 200x. Scale bar 100 μm (g). Magnification 400x. Scale bar 50 μm (h, i) and Ran (j,k,l) in NT, TE and TL mice. Magnification 200x.Scale bar 100 μm (D) H&E staining of representative lung metastases from WT, NT, and TE mice. Ran immunostaining was assessed in wild type lung and lung metastases (NT and TE), magnification 200x. Scale bar 100 μm. (E & F) Immunohistochemical staining for AKT in MDA-MB-231 xenograft tumors. (E) Immunohistochemical staining for AKT (Pan). Scale bar 100 μm. (F) AKT-isoforms (AKT1, AKT2) in untreated and treated mice breast xenografts tumors showing a representative result for 10 sections per group. Magnification 100x. Scale bar 100 μm.
Figure 3
Figure 3. Pimozide suppresses the migration of breast cancer cells and reduces the expression of metalloproteinases (MMPs) in vitro and in vivo
(A) MDA-MB-231 and MCF7 cells were grown for 48 hours. Following wounding of the cell monolayers, cells were treated with 7.5 μM Pimozide, or control (DMSO) and their migration to close the wound measured over time. Time lapse images of MDA-MB-231 cells and MCF7 cells, immediately after wounding and after 24 hours. Scale bar 100 μm. (B) Quantification of wound closure presented as percentage of untreated control (DMSO) set at 100%, and treated cells representing the proportion of closed wounded area at 24 hours post wounding of MDA-MB-231 and MCF7 cultures. Data shown are means ± SE of three independent experiments, *, P < 0.05, Student’s t-test. (C) Relative mRNA expression of metalloproteinases MMP1 and MMP14 in MDA-MB-231 cells either untreated or treated with 7.5 μM Pimozide for 24 hours. Data shown are representative of three experiments performed. (D) Western blot showing protein levels of activated metalloproteinase MMP2 in cells treated with shScr, RAN-1, RAN-2, and RAN-4 shRNA for 24 hours. β-Actin was used as a loading control. Data shown are representative of three experiments performed. (E) Immunohistochemical staining for MMP2 in mouse tumor xenografts (NT & T). Magnification 200x. Scale bar 100 μm. Pimozide inhibits the migration of cells. Breast cancer MDA-MB-231 cells treated with 7.5 μM Pimozide or control (DMSO) were grown for 48 hours on fibronectin-coated coverslips prior to washing, fixing and immunostaining for either: (F) paxillin. Scale bar 50 μm, (G) myosin IIA, or (H) Arp 3. Scale bar 25 μm, together with staining for actin using rhodamine-phalloidin. Scale bar 100 μm. Data shown are means ± SD of three independent experiments, **, P < 0.001, Student’s t-test. (I) Numbers of cellular protrusions summarized using a histogram, data shown are means ± SD of three independent experiments (n = 27), **, P < 0.001, Student’s t-test.
Figure 4
Figure 4. Pimozide induced epithelial mesenchymal transition (EMT) signaling pathways in MDA-MB-231 cells
(A) RT-PCR of the EMT mRNA markers Vimentin (Vim) and Zo-1 after 24 hours treatment with Pimozide at 7.5 μM and 10 μM, showing a reduction relative to mRNA for β-Actin. (B) Western blot of Snail, Vimentin and N-cadherin proteins after 24 hours of Pimozide treatment, β-Actin was used as a loading control. Data shown are representative of three experiments performed. (C) Relative level of mRNA for EMT markers in MDA-MB-231 cell lines treated with 7.5 μM Pimozide for 24 hours, showing a decrease in N-cadherin (Ncad), Vimentin (Vim), Snail, Slug and Twist compared to untreated control (DMSO). β-Actin was used as a loading control. Data shown are representative of three experiments performed. (D) Immunohistochemical staining for Vimentin in tumors from untreated mice (NT) and treated mice (T) with Pimozide (a representative of 10 sections per group). Magnification 200x. Scale bar 100 μm. Data shown are representative of three experiments performed.
Figure 5
Figure 5. Pimozide inhibits the expression of angiogenesis related markers in vivo and induced apoptosis in HUVEC endothelial cells
(A) Immunohistochemical and immunofluorescent detection of the endothelial cell marker CD31 in MDA-MB-231 tumors from untreated mice and mice treated with Pimozide (representative of 10 sections per group). Scale bar 100 μm. (B) Histogram showing numbers of blood vessels in untreated and Pimozide treated tumor sections, Pimozide-treated tumors exhibited a ∼three-fold reduction in CD31 staining, Student’s t-test *P < 0.05 vs control. (C) Western blotting of AKT1, AKT2, pAKT, VEGFR2 and pVEGFR2 proteins in HUVEC cells treated with Pimozide for 24 hours. β-Actin was used as a loading control. Data shown are representative of three experiments performed. (D) DNA ploidy analysis by flow cytometry of HUVEC cells treated for 24 hours with Pimozide. Untreated control cells were run in parallel. Apoptosis was determined in flow cytometry by the percentage of hypodiploid (sub-G1) cells following cell cycle analysis. The percentage of cells with a DNA content less than G1 (sub-G1) is indicated in each histogram. The cell cycle profiles shown, with the sub-G1 population indicated, are representative of three experiments performed.
Figure 6
Figure 6. Pimozide suppresses fibroblast differentiation, reduces cell proliferation and increases apoptosis
(A) Immunofluorescent detection of α-SMA/SMAD2-3 in untreated (DMSO) and treated fibroblasts with 7.5 μM Pimozide for 24 hours. The nuclei are stained blue (DAPI), smooth muscle in differentiated fibroblasts green, and SMAD2-3 red (nuclear staining). Primary human fibroblasts were pre-treated with 7.5 μM Pimozide, 1 hour prior to TGFβ1 treatment. Fibroblasts were stimulated to differentiate by addition of TGFβ1 for 72 hours. In vehicle control (DMSO)-treated cultures fibroblast differentiation was observed by the formation of polymerized smooth muscle actin filaments. However, in the presence of Pimozide, TGFβ1 was unable to promote the formation of these filaments. In Pimozide treated cells, SMAD2-3 is nuclear both in the control and TGFβ1-treated cultures. Exposure TGFβ1 treated fibroblasts to Pimozide resulted in increased apoptosis which is apparent from the increased number of condensed nuclei (white arrows). Scale bar 100 μm. (B) Cell cycle profile (Sub-G1) summarized using a histogram. Primary fibroblast cells were treated with different doses of Pimozide for 24 hours, and the percentage of cells in the sub-G1 phase of the cell cycle (dead and dying cells) was quantitated by flow cytometry. Data shown are means ± SD of three independent experiments, **,P < 0.01, Student’s t-test. (C) Phase contrast micrograph showing the morphology of fibroblast treated with Pimozide at different doses for 48 hours. Scale bar 100 μm. (D) Immunohistochemical staining for α-SMA in MDA-MB-231 tumors from untreated mice (PBS) and treated mice (representative of 10 sections per group). Magnification 100x. Scale bar 100 μm.
Figure 7
Figure 7. High level of Ran and VEGFR2 is correlated with shorter survival time of breast cancer patients
(A-D) Kaplan-Meier plot of survival of breast cancer patients from five microarray datasets available in GEO database for Ran and VEGFR2 mRNA. (A) Ran-high group stratified into high and low VEGFR2. The two curves were significantly different (Wald test χ2 = 67.03, 1 df, P < 0.001 (P = 2.2e-16)). (B) VEGFR2-high group stratified into Ran high and low. The curves differed with a high degree of significance (χ2 = 138.61, 1 df, P < 0.001 (P = 1e-16)). (C) Ran-low level group stratified into VEGFR2 high and low. The high group for VEGFR2 showed a significantly lower patient survival time (χ2 = 4.64, 1 df, P = 0.031). (D) VEGFR2-low group stratified into high and low Ran. The curves differed with a high degree of significance (χ2 = 9.5, 1 df, P = 0.0021). Only datasets that included at least 150 patients were included, and the correlations between relative mRNA levels of VEGFR2 and Ran in each dataset were compared using Pearson’s correlation analysis (E–J). In all the datasets tested in this study GSE2034 (n = 286) (E), GSE1456 (n = 159) (F), GSE12276 (n = 204) (G), GSE11121 (n = 200) (H), GSE7390 (n = 198) (I), and GSE4922 (n = 289) (J), the relative mRNA levels of VEGFR2 and Ran were significantly positively correlated (Pearson’s correlation; P < 0.05). (K)Association of mRNA levels of VEGFR2 and Ran in GSE-6sets-combined breast cancer patients. The relative mRNA levels of VEGFR2 and Ran were significantly positively correlated (Pearson’s correlation; P < 0.05).
Figure 8
Figure 8. Summary figure of proposed pimozide mechanisms
(A) Hypothetical representation of Pimozide signaling pathways involved in cell proliferation, survival, metastasis, and angiogenesis. (B) Schematic representation of Pimozide effects on tumor cells and the tumor microenvironment, including fibroblasts and HUVEC cells.

Similar articles

Cited by

References

    1. Tecott LH, Kwong LL, Uhr S, Peroutka SJ. Differential modulation of dopamine D2 receptors by chronic haloperidol, nitrendipine, and pimozide. Biol Psychiatry. 1986;21:1114–22. - PubMed
    1. Jandaghi P, Najafabadi HS, Bauer AS, Papadakis AI, Fassan M, Hall A, Monast A, von Knebel Doeberitz M, Neoptolemos JP, Costello E, Greenhalf W, Scarpa A, Sipos B, et al. Expression of DRD2 is increased in human pancreatic ductal adenocarcinoma and inhibitors slow tumor growth in mice. Gastroenterology. 2016;151:1218–31. doi: 10.1053/j.gastro.2016.08.040. - DOI - PubMed
    1. Miyamoto S, Duncan GE, Marx CE, Lieberman JA. Treatments for schizophrenia: a critical review of pharmacology and mechanisms of action of antipsychotic drugs. Mol Psychiatry. 2005;10:79–104. doi: 10.1038/sj.mp.4001556. - DOI - PubMed
    1. Seeman P. Atypical antipsychotics: mechanism of action. Can J Psychiatry. 2002;47:27–38. - PubMed
    1. Mortensen PB. The incidence of cancer in schizophrenic patients. J Epidemiol Community Health. 1989;43:43–7. - PMC - PubMed