. 2018 Nov 7;10(466):eaat4921.
doi: 10.1126/scitranslmed.aat4921.

Enhanced detection of circulating tumor DNA by fragment size analysis

Affiliations

Enhanced detection of circulating tumor DNA by fragment size analysis

Florent Mouliere et al. Sci Transl Med. .

Abstract

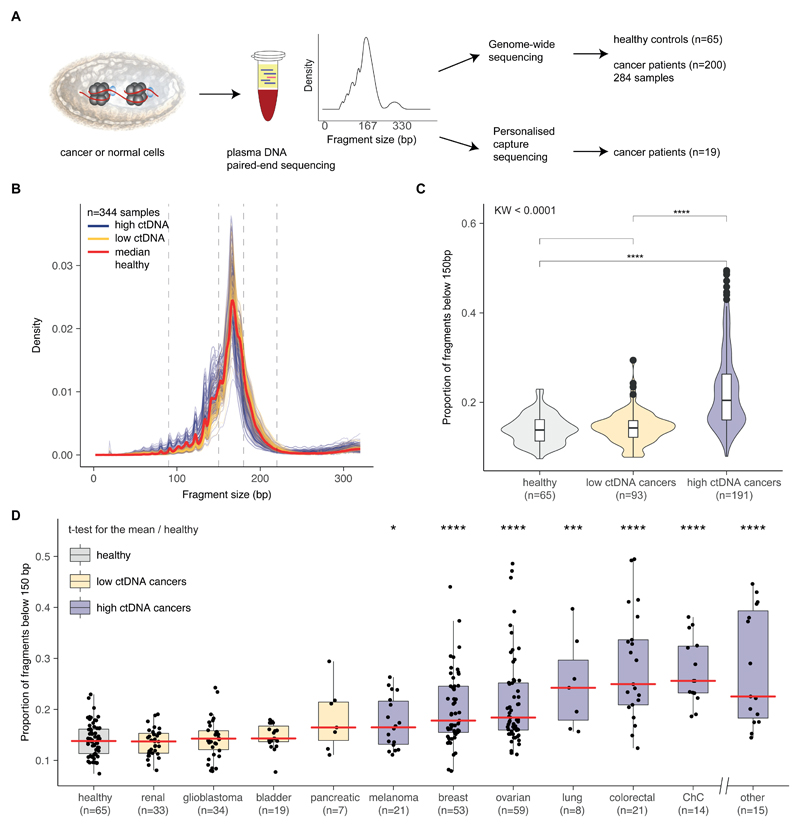
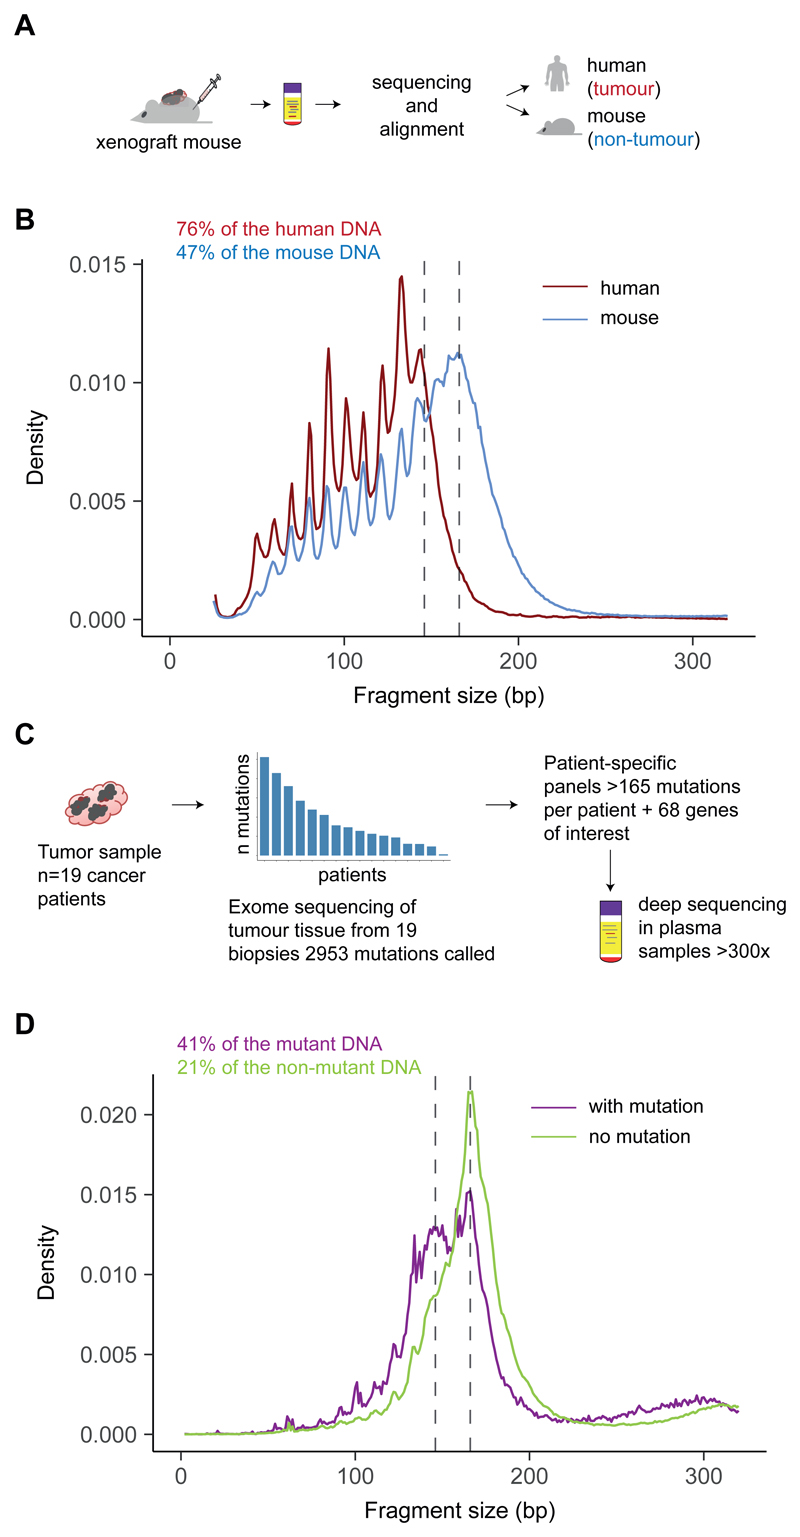
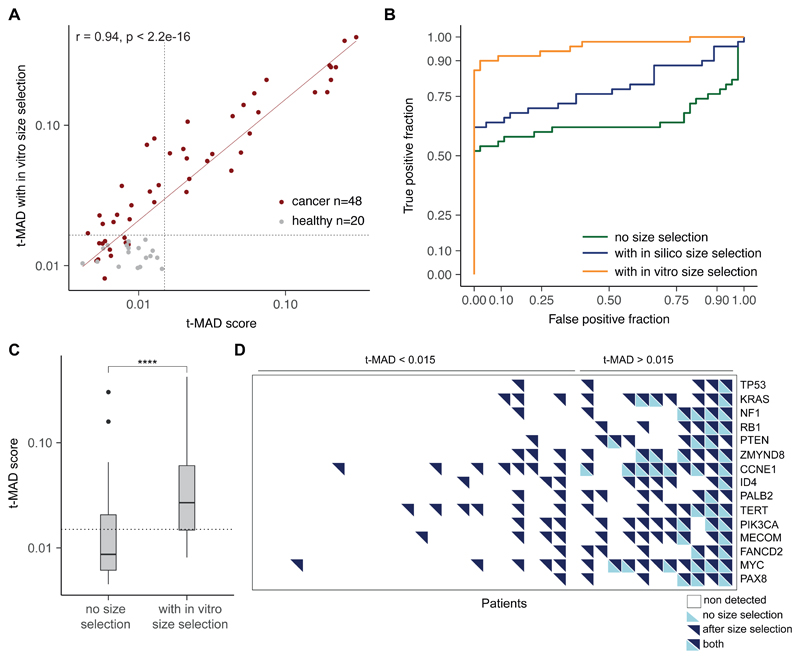
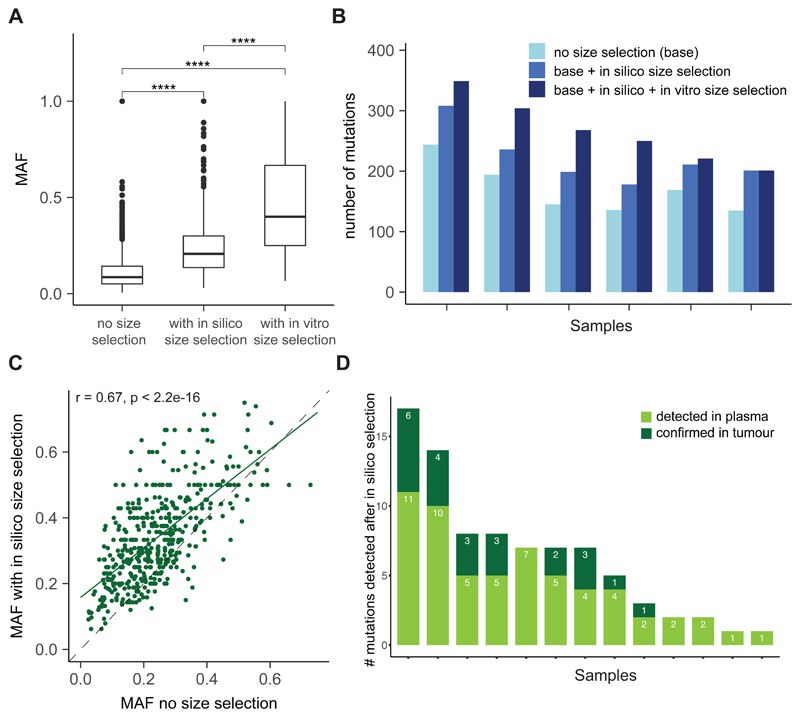
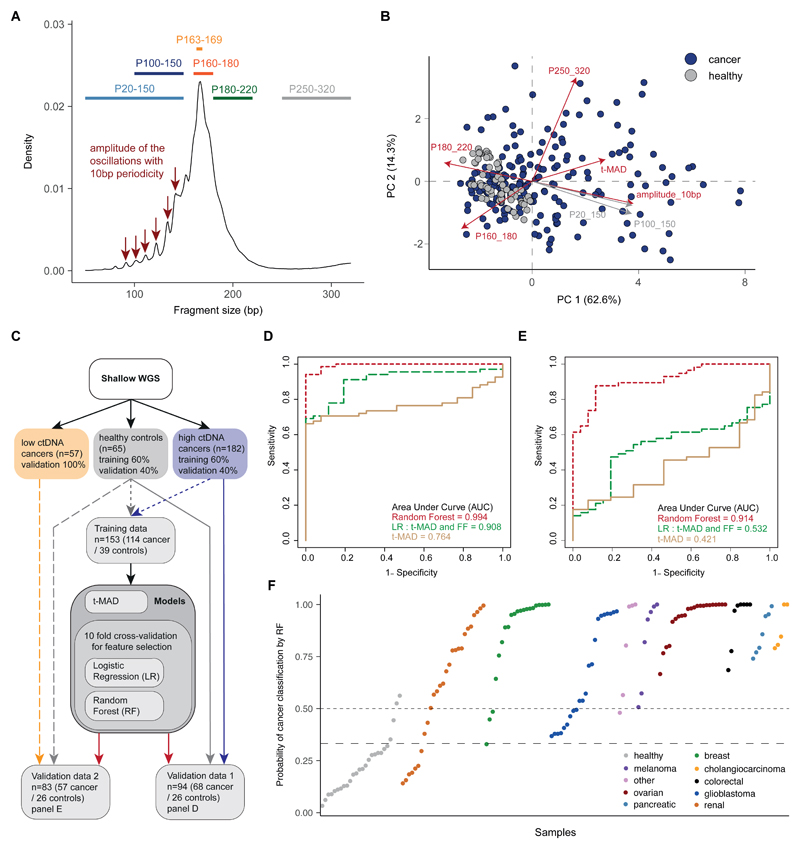
Existing methods to improve detection of circulating tumor DNA (ctDNA) have focused on genomic alterations but have rarely considered the biological properties of plasma cell-free DNA (cfDNA). We hypothesized that differences in fragment lengths of circulating DNA could be exploited to enhance sensitivity for detecting the presence of ctDNA and for noninvasive genomic analysis of cancer. We surveyed ctDNA fragment sizes in 344 plasma samples from 200 patients with cancer using low-pass whole-genome sequencing (0.4×). To establish the size distribution of mutant ctDNA, tumor-guided personalized deep sequencing was performed in 19 patients. We detected enrichment of ctDNA in fragment sizes between 90 and 150 bp and developed methods for in vitro and in silico size selection of these fragments. Selecting fragments between 90 and 150 bp improved detection of tumor DNA, with more than twofold median enrichment in >95% of cases and more than fourfold enrichment in >10% of cases. Analysis of size-selected cfDNA identified clinically actionable mutations and copy number alterations that were otherwise not detected. Identification of plasma samples from patients with advanced cancer was improved by predictive models integrating fragment length and copy number analysis of cfDNA, with area under the curve (AUC) >0.99 compared to AUC <0.80 without fragmentation features. Increased identification of cfDNA from patients with glioma, renal, and pancreatic cancer was achieved with AUC > 0.91 compared to AUC < 0.5 without fragmentation features. Fragment size analysis and selective sequencing of specific fragment sizes can boost ctDNA detection and could complement or provide an alternative to deeper sequencing of cfDNA.


Conflict of interest statement

Competing interests: NR, JDB and DG are cofounders, shareholders and officers/consultants of Inivata Ltd, a cancer genomics company that commercializes ctDNA analysis. Inivata Ltd had no role in the conceptualization, study design, data collection and analysis, decision to publish or preparation of the manuscript. JDB received research funding from Aprea and NCI, and has received advisory board fees from Astra-Zeneca. F. Marass and NR are co-inventors of patent WO/2016/009224 on “A method for detecting a genetic variant”. F. Mouliere, JW, KH, CM, CS, NR and other authors may be listed as co-inventors on patent application number 1803596.4 on “Improvements in variant detection” and other potential patents describing methods for the analysis of DNA fragments and applications of circulating tumor DNA. IG is currently an employee of Novartis AG, a relationship that started after all his work contributing to this manuscript had been completed. Novartis had no role in the work presented in this manuscript. Other co-authors declare that they have no competing interests.

Figures

Figure 1
Figure 1. Survey of plasma DNA fragmentation with genome-wide sequencing on a pan-cancer scale.
A, The size profile of cfDNA can be determined by paired-end sequencing of plasma samples and reflects its organization around the nucleosome. cfDNA is released into the blood circulation by various means, each of which leaves a signature on the DNA fragment sizes. We inferred the size profile of cfDNA by analyzing with sWGS (n=344 plasma samples from 65 healthy controls and 200 cancer patients) and the size profile of mutant ctDNA by personalized capture sequencing (n=18 plasma samples). B, Fragment size distributions of 344 plasma samples from 200 cancer patients. Samples are split into two groups based on previous literature (6), with orange representing samples from patients with cancer types previously observed to have low amounts of ctDNA (renal, bladder, pancreatic, and glioma) and blue representing samples from patients with cancer types previously observed to have higher levels of ctDNA (breast, melanoma, ovarian, lung, colorectal, cholangiocarcinoma, and others, see table S1). C, Proportion of cfDNA fragments below 150 bp in those samples, grouped into cancer types as defined in B. The Kruskal-Wallis test for difference in size distributions indicated a significant difference between the group of samples from cancer types releasing high amounts of ctDNA and the group of samples from cancer types releasing low amounts, as well as the group of samples from healthy individuals (p<0.001). D, Proportion of cfDNA fragments below 150 bp by cancer type (all samples). Cancer types represented by fewer than 4 individuals are grouped in the “other” category. The red line indicates the median proportion for each cancer type. ChC=cholangiocarcinoma.
Figure 2
Figure 2. Determining the size profile of mutant ctDNA with animal models and personalized capture sequencing.
A, A mouse model with xenografted human tumor cells enabled the discrimination of DNA fragments released by cancer cells (reads aligning to the human genome) from the DNA released by healthy cells (reads aligning to the mouse genome), with the use of sWGS. B, Fragment size distribution from the plasma extracted from a mouse xenografted with a human ovarian tumor, showing ctDNA originating from tumor cells (red) and cfDNA from non-cancerous cells (blue). Two vertical lines indicate 145 bp and 167 bp. The fraction of reads shorter than 150 bp is indicated. C, Design of personalized hybrid-capture sequencing panels developed to specifically determine the size profiles of mutant DNA and non-mutant DNA in plasma from 19 patients with late-stage cancers. Capture panels included somatic mutations identified in tumor tissue by WES. A mean of 165 mutations per patient was then analyzed from matched plasma samples. Reads were aligned and separated into fragments carrying either the reference or the mutant sequence. Fragment sizes for paired-end reads were calculated. D, Size profiles of mutant DNA and non-mutant DNA in plasma from 19 patients with late stage cancers were determined by tumor-guided capture sequencing. The fraction of reads shorter than 150 bp is indicated.
Figure 3
Figure 3. Enhancing the tumor fraction from plasma sequencing with size selection.
A, Plasma samples collected from ovarian cancer patients were analyzed in parallel without size selection or using either in silico or in vitro size selection. B, accuracy of the in vitro and in silico size selection determined on a cohort of 20 healthy controls. The size distribution before size selection is shown in green, after in silico size selection (with sharp cutoff at 90 and 150 bp) in blue, and after in vitro size selection in orange. Vertical lines indicate 90 bp and 150 bp. C, SCNA analysis with sWGS from plasma DNA of an ovarian cancer patient collected before initiation of treatment, when ctDNA MAF was 0.271 for a TP53 mutation as determined by TAm-Seq. Inferred amplifications are shown in blue and deletions in orange. Copy number neutral regions are in gray. D, SCNA analysis of a plasma sample from the same patient as in panel C, collected three weeks after treatment start. The MAF for the TP53 mutation at this time point was 0.068, and sWGS revealed only limited evidence of copy number alterations (before size selection). E, Analysis of the same plasma sample as in D after in vitro size selection of fragments between 90 bp and 150 bp in length. The MAF for the TP53 mutation increased to 0.402 after in vitro size selection, and SCNAs were clearly apparent by sWGS. More SCNAs were detected in comparison to C and D (for example in chr2, chr9, chr10). SCNAs were also detected in this sample after in silico size selection (fig. S7).
Figure 4
Figure 4. Quantifying the ctDNA enrichment by sWGS with in silico size selection and t-MAD.
A, Workflow to quantify tumor fraction from SCNA as a genome-wide score named t-MAD. B, Correlation between the MAF of SNVs determined by digital PCR or hybrid-capture sequencing and t-MAD score determined by sWGS. Data included 97 samples from patients of multiple cancer types with matched MAF measurements and t-MAD scores. Pearson correlation (coefficient r) between MAF and t-MAD scores was calculated for all cases with MAF>0.025 and t-MAD>0.015. Linear regression indicated a fit with a slope of 0.44 (purple solid line). C, Comparison of t-MAD scores determined from sWGS between healthy samples, samples collected from patients with cancer types that exhibit low amounts of ctDNA, and from patients with cancer types that exhibit high amounts of ctDNA (as in Fig. 1). All samples for which t-MAD could be calculated have been included. D, ROC analysis comparing the classification of these plasma samples from high ctDNA cancer samples (n=189) and plasma samples from healthy controls (n=65) using t-MAD had an area under curve (AUC) of 0.69 without size selection (black solid curve). After applying in silico size selection to the samples from the cancer patients, we observed an AUC of 0.90 (black dashed curve). E, Determination of t-MAD from longitudinal plasma samples of a colorectal cancer patient. t-MAD was analyzed before and after in silico size selection of the DNA fragments 90-150 bp, and then compared to the RECIST status for this patient. F, Application of in silico size selection to 6 patients with long-term follow-up. t-MAD score was determined before and after in silico size selection of the short DNA fragments. Dark blue circles indicate samples in which ctDNA was detected both with and without in silico size selection. Light blue circles indicate samples where ctDNA was detected only after in silico size selection. Empty circles indicate samples where ctDNA was not detected by either analysis. Times when RECIST status was assessed are indicated by a red bar for progression, or an orange bar for regression or stable disease.
Figure 5
Figure 5. Quantifying the ctDNA enrichment by sWGS with in vitro size selection.
A, The effect of in vitro size selection on the t-MAD score. For each of 48 plasma samples collected from 35 patients, the t-MAD score was determined from the sWGS after in vitro size selection (y axis) and without size selection (x axis). In vitro size selection increased the t-MAD score for nearly all samples, with a median increase of 2.1-fold (range from 1.1 to 6.4 fold). t-MAD scores determined from sWGS for 46 samples from healthy individuals were all <0.015 both before and after in vitro size selection. B, ROC analysis comparing the classification of plasma samples from cancer patients (n=48) and plasma samples from healthy controls (n=46) using t-MAD had an area under curve (AUC) of 0.64 without size selection (green curve). After applying in silico size selection to the samples from the patients and controls, we observed an AUC of 0.78 (blue curve), and after in vitro size selection, an AUC of 0.97 (orange curve). C, Comparison of t-MAD scores determined from sWGS between matched ovarian cancer samples with and without in vitro size selection. The t-test for the difference in means indicates a significant increase in tumor fraction (measured by t-MAD) with in vitro size selection (p<0.0001). D, Detection of SCNAs across 15 genes frequently mutated in recurrent ovarian cancer, measured in plasma samples collected during treatment for 35 patients. Patients were ranked from left to right by increasing tumor fraction as quantified by t-MAD (before in vitro size selection). SCNAs are labeled as detected for a gene if the mean log2 ratio in that region was greater than 0.05. Empty squares represent copy number neutral regions, bottom left triangles in light blue indicate that SCNAs were detected without size selection, and top right triangles in dark blue represent SCNAs detected after in vitro size selection.
Figure 6
Figure 6. Improving the detection of somatic alterations by WES in multiple cancer types with size selection.
A, Analysis of the MAF of mutations detected by WES in 6 patients with HGSOC without size selection and with either in vitro or in silico size selection. B, Comparison of size-selected WES data with non-selected WES data to assess the number of mutations detected in plasma samples from 6 patients with HGSOC. For each patient, the first bar in light blue shows the number of mutations called without size selection, the second bar quantifies the number of mutations called after the addition of those identified with in silico size selection, and the third, dark blue bar shows the number of mutations called after addition of mutations called after in vitro size selection. C, Patients (n=16) were retrospectively selected from a cohort with different cancer types (colorectal, cholangiocarcinoma, pancreatic, prostate) enrolled in early phase clinical trials. Matched tumor tissue DNA was available for each plasma sample, and 2 patients also had a biopsy collected at relapse. WES was performed on tumor tissue DNA and plasma DNA samples, and in silico size selection was applied to the data. 2061/2133, 97% of the shared mutations detected by WES showed higher MAF after in silico size selection. D, Mutations detected only after in silico selection of WES data from 16 patients (as in C) compared to mutations called by WES of the matched tumor tissue. Three of 16 patients had no additional mutations identified after in silico size selection. Of the 82 mutations detected in plasma after in silico size selection, 23 (28%) had low signal in tumor WES data and were not identified in those samples without size selection.
Figure 7
Figure 7. Enhancing the potential for ctDNA detection by combining SCNAs and fragment-size features.
A, Schematic illustrating the selection of different size ranges and features in the distribution of fragment sizes. For each sample, fragmentation features included the proportion (P) of fragments in specific size ranges, the ratio between certain ranges, and a quantification of the amplitude of the 10 bp oscillations in the 90-145 bp size range calculated from the periodic “peaks” and “valleys”. B, Principal Component Analysis (PCA) comparing cancer and healthy samples using data from t-MAD scores and the fragmentation features. Red colored arrows indicate features that were selected as informative by the predictive analysis. C, Workflow for the predictive analysis combining SCNAs and fragment size features. sWGS data from 182 plasma samples from patients with cancer types with high amounts of ctDNA (colorectal, cholangiocarcinoma, lung, ovarian, breast) were split into a training set (60% of samples) and a validation set (Validation data 1, together with the healthy individual validation set). A further dataset of sWGS from 57 samples of cancer types exhibiting low amounts of ctDNA (glioma, renal, pancreatic) was used as Validation data 2, together with the healthy individual validation set. Plasma DNA sWGS data from healthy controls were split into a training set (60% of samples) and a validation set (used in both Validation data 1 and Validation data 2). D, ROC curves for Validation data 1 (samples from cancer patients with high ctDNA amounts=68, healthy=26) for 3 predictive models built on the pan-cancer training cohort (cancer=114, healthy=39). The beige curve represents the ROC curve for classification with t-MAD only, the long dashed green line represents the logistic regression model combining the top 5 features based on recursive feature elimination (t-MAD score, 10 bp amplitude, P(160-180), P(180-220), and P(250-320)), and the dashed red line shows the result for a random forest classifier trained on the combination of the same 5 features, independently chosen for the best RF predictive model. E, ROC curves for Validation data 2 (samples from cancer patients with low ctDNA amounts=57, healthy=26) for the same 3 classifiers as in D. The beige curve represents the model using t-MAD only, the long-dashed green curve represents the logistic regression model combining the top 5 features (t-MAD score, 10 bp amplitude, P(160-180), P(180-220), and P(250-320)), and the dashed red curve shows the result for a random forest classifier trained on the combination of same 5 predictive features. F, Plot representing the probability of classification as cancer with the RF model for all samples in both validation datasets. Samples are separated by cancer type and sorted within each by the RF probability of classification as cancer. The dashed horizontal line indicates 50% probability (achieving specificity of 24/26=92.3%), and the long-dashed line indicates 33% probability (achieving specificity of 22/26=84.6%).

Comment in

Similar articles

Cited by

References

    1. Siravegna G, Marsoni S, Siena S, Bardelli A. Integrating liquid biopsies into the management of cancer. Nat Rev Clin Oncol. 2017 doi: 10.1038/nrclinonc.2017.14. - DOI - PubMed
    1. Wan JCM, Massie C, Garcia-Corbacho J, Mouliere F, Brenton JD, Caldas C, Pacey S, Baird R, Rosenfeld N. Liquid biopsies come of age: towards implementation of circulating tumour DNA. Nat Rev Cancer. 2017;17:223–238. - PubMed
    1. Murtaza M, Dawson S-J, Tsui DWY, Gale D, Forshew T, Piskorz AM, Parkinson C, Chin S-F, Kingsbury Z, Wong ASC, Marass F, et al. Non-invasive analysis of acquired resistance to cancer therapy by sequencing of plasma DNA. Nature. 2013;497:108–112. - PubMed
    1. Adalsteinsson VA, Ha G, Freeman SS, Choudhury AD, Stover DG, Parsons HA, Gydush G, Reed SC, Rotem D, Rhoades J, Loginov D, et al. Scalable whole-exome sequencing of cell-free DNA reveals high concordance with metastatic tumors. Nat Commun. 2017;8:1324. - PMC - PubMed
    1. Heitzer E, Ulz P, Belic J, Gutschi S, Quehenberger F, Fischereder K, Benezeder T, Auer M, Pischler C, Mannweiler S, Pichler M, et al. Tumor-associated copy number changes in the circulation of patients with prostate cancer identified through whole-genome sequencing. Genome Med. 2013;5:30. - PMC - PubMed

Publication types

Substances

LinkOut - more resources