. 2018 Nov 7;19(1):189.
doi: 10.1186/s13059-018-1557-3.

LaminA/C regulates epigenetic and chromatin architecture changes upon aging of hematopoietic stem cells

Affiliations

LaminA/C regulates epigenetic and chromatin architecture changes upon aging of hematopoietic stem cells

Ani Grigoryan et al. Genome Biol. .

Abstract

Background: The decline of hematopoietic stem cell (HSC) function upon aging contributes to aging-associated immune remodeling and leukemia pathogenesis. Aged HSCs show changes to their epigenome, such as alterations in DNA methylation and histone methylation and acetylation landscapes. We previously showed a correlation between high Cdc42 activity in aged HSCs and the loss of intranuclear epigenetic polarity, or epipolarity, as indicated by the specific distribution of H4K16ac.

Results: Here, we show that not all histone modifications display a polar localization and that a reduction in H4K16ac amount and loss of epipolarity are specific to aged HSCs. Increasing the levels of H4K16ac is not sufficient to restore polarity in aged HSCs and the restoration of HSC function. The changes in H4K16ac upon aging and rejuvenation of HSCs are correlated with a change in chromosome 11 architecture and alterations in nuclear volume and shape. Surprisingly, by taking advantage of knockout mouse models, we demonstrate that increased Cdc42 activity levels correlate with the repression of the nuclear envelope protein LaminA/C, which controls chromosome 11 distribution, H4K16ac polarity, and nuclear volume and shape in aged HSCs.

Conclusions: Collectively, our data show that chromatin architecture changes in aged stem cells are reversible by decreasing the levels of Cdc42 activity, revealing an unanticipated way to pharmacologically target LaminA/C expression and revert alterations of the epigenetic architecture in aged HSCs.

Keywords: Aging; Chromatin architecture; Chromosome 11; Hematopoietic stem cell (HSC); LaminA/C.


Conflict of interest statement

Ethics approval

All mice were housed in the animal barrier facility under pathogen-free conditions either at the Ulm University or at CCHMC. All mouse experiments were performed in compliance with the German Law for Welfare of Laboratory Animals and were approved by the Institutional Review Board of the Ulm University as well as by the Regierungspraesidium Tuebingen (state government of Baden-Württemberg) or by the IACUC of CCHMC respectively.

Consent for publication

Not applicable.

Competing interests

The authors declare that they have no competing interests.

Publisher’s Note

Springer Nature remains neutral with regard to jurisdictional claims in published maps and institutional affiliations.

Figures
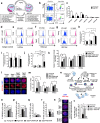
Fig. 1
Fig. 1
The change in the spatial distribution of H4K16ac upon aging is linked to a change in HSC function. a Aging of HSCs. Cartoon scheme of the main previous findings [16]. b Representative FACS dot plots of HSCs (Lin-c-kit+Sca-1+Flk2-CD34-), ST-HSCs (Lin-c-kit+Sca-1+Flk2-CD34+), LMPPs (Lin-c-kit+Sca-1+Flk2+CD34+), and LSKs (Lin-c-kit+Sca-1+) gating strategy of young and aged lineage-depleted BM cells. c Percentage of young and aged HSCs with a polar distribution of H4K16ac, H4K8ac, H4K5ac, H3K27ac, H3K4me1, and H3K4me3; n = 3–4 biological repeats; ~ 150–200 single HSCs scored per sample in total; *p < 0.001. d Representative FACS histograms of an isotype control stained sample. Gates for LT-HSCs and ST-HSCs. Representative FACS histograms of H3K5ac (e), H3K4me3 (f), and H4K16ac (g) of young and aged samples. LT-HSCs and ST-HSCs gates are shown. Median fluorescence intensity of H3K5ac (h), H3K4me3 (i), and H4K16ac (j) plotted as a percentage of young control in young and aged HSCs, ST-HSCs, and LMPPs. Shown are mean values + 1 SE; n = 4–7 biological repeats; *p < 0.05. k Median fluorescence intensity of H4K16ac, H4K8ac, and H4K5ac plotted as a percentage of young control in young, aged, aged CASIN-treated (5 μM, 16 h), and aged NaB-treated (5 mM, 16 h) HSCs. Shown are mean values + 1 SE; n = 4 biological repeats; *p < 0.05. l Representative distribution of H4K16ac in young, aged, aged CASIN-treated (5 μM, 16 h), and aged NaB-treated (5 mM, 16 h) HSCs. Bar = 2 μm. Panels show DAPI (nucleus, blue), H4K16ac (red). m Percentage of young, aged, aged CASIN-treated (5 μM, 16 h), and aged NaB-treated (5 mM, 16 h) HSCs with a polar distribution of H4K16ac; n = 3–4 biological repeats; ~ 150–200 single HSCs scored per sample in total; *p < 0.05. n Schematic representation of the experimental setup for HSC transplantation. Percentage of B220+ (o), myeloid (Gr1+, Mac1+, and Gr1+Mac1+) (p), and CD3+ (q) cells among Ly5.2+ donor-derived cells in peripheral blood (PB) of recipient Ly5.1+ mice; *p < 0.05, **p < 0.01; n = 12–19. r Percentage of HSCs among donor-derived Ly5.2+ LSKs in BM of recipient Ly5.1+ mice; *p < 0.05, **p < 0.01; n = 12–19. s Representative distribution of H4K16ac in donor-derived Ly5.2+ HSCs sorted from mice after 24 weeks from transplant with young, aged, aged CASIN-treated (5 μM, 16 h), and aged NaB-treated (5 mM, 16 h) HSCs. Bar = 2 μm. Panels show DAPI (nucleus, blue), H4K16ac (red). t Percentage of H4K16ac-polarized donor-derived Ly5.2+ HSCs sorted from mice after 24 weeks from transplant with young, aged, aged+CASIN 5 μM, and aged+NaB 5 mM HSCs; n = 3 biological repeats; ~ 100–150 single HSCs scored per sample in total; *p < 0.05, **p < 0.01
Fig. 2
Fig. 2
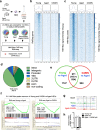
Changes in H4K16ac epipolarity are linked to changes in chromosome 11 homolog distribution. a Schematic representation of the experimental setup. Heatmaps and profiles show input-corrected H4K16ac signals ± 1.5 kb from TSS (b) and at H4K16ac peaks ± 1.0 kb (c). TSS and peak regions were ranked by the signal intensity in young HSCs. Summary profile of n = 3 biological repeats. Each sample was generated by pooling 50,000 sorted HSCs that were incubated 16 h in HBSS+ 10% FBS+P/S±CASIN 5 μM at 3% O2. d Pie chart showing genomic annotations of the total 34,019 H4K16ac peaks in young, aged HSCs, and aged+CASIN 5 μM HSCs. ChIP-seq data are available at GEO Series accession number GSE120232. e Venn diagram showing results of the cross-analysis of differentially bound H4K16ac peaks between young and aged HSCs (1358 peaks), aged+CASIN 5 μM, and aged HSCs (1135 peaks). Two hundred eleven differentially bound peaks were overlapping, and of these, 118 showed the same direction of change. f Gene Set Enrichment Analysis (GSEA) for the 211 differentially bound H4K16ac peaks overlapping between young and CASIN HSCs as compared to aged HSCs in both young vs aged and CASIN vs aged RNA-seq dataset. RNA-seq data are available at GEO Series accession number GSE119466. gh UCSC browser track showing H4K16ac signal at the Cbx4 locus and real-time PCR transcript level for Cbx4 in young, aged, and aged+CASIN 5 μM HSCs: n = 3 biological repeats, *p < 0.0001
Fig. 3
Fig. 3
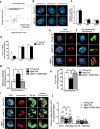
Changes in H4K16ac epipolarity are linked to the changes in chromosome 11 homologs distribution. a Comparison of the observed peak count and expected peak count relative to the chromosome size for the 118 peaks identified as described in panel M. Goodness of fit test was used, and it revealed that these 118 differentially bound H4K16ac peaks are not randomly distributed and chromosome 11 presented with the highest enrichment score. b Representative confocal 3D reconstruction of the nucleus (stained with DAPI, blue) and of chromosomes 3 (red), 7 (green), and 16 (green) by FISH stained with full-paint probe in young and aged HSCs. Bar = 2 μm. c Measurements of the distances between chromosomes 3 (n = 3 biological repeats, 28 cells for young, 21 cells for aged in total), 7 (n = 3 biological repeats, 25 cells for young, 26 cells for aged in total), and 16 (n = 3 biological repeats, 30 cells for young, 18 cells for aged in total) homologs in young and aged HSCs by Volocity 3D Image Analysis Software. d Percentage of young and aged HSCs with chromosome homolog proximity for chromosomes 3, 7, and 16, n = 3 biological repeats. e Representative confocal 3D reconstruction of the nucleus (stained with DAPI, blue) and of chromosome11 (red, FISH stained with a full-paint probe) in young, aged, and aged+CASIN 5 μM HSCs. Bar = 2 μm. f 3D reconstruction of the chromosome 11 homologs (red and green) and the distance measurement between them by Volocity 3D Image Analysis. In young HSCs, green color for two homologs shows that they are distributed very close to each other and are not recognized as two objects by the software. While in aged and aged+CASIN 5 μM HSCs, they are marked as two objects in green and red. Bar = 2 μm. g Measurements of the distances between chromosome 11 homologs by Volocity 3D Image Analysis. Shown are mean values + 1 SE; *p < 0.01; n = 6 biological repeats, 64 cells for young, 58 cells for aged, and 55 cells for aged+CASIN in total. h Percentage of young, aged, and aged+CASIN 5 μM HSCs with homolog proximity for chromosome11; **p < 0.01. i Representative confocal 3D reconstruction of young, aged, and aged+CASIN 5 μM HSCs after DNA-FISH+IF. H4K16ac (green), chromosome 11 (red), the nucleus is stained with DAPI (blue). Bar = 2 μm. j Volume measurement of the co-localized area between H4K16ac and chromosomes 11 and 16 by Volocity 3D Image Analysis; *p < 0.05, n = 3 biological repeats, 33 cells for young, 33 cells for aged, and 28 cells for aged+CASIN in total for chromosome 11 and 32 cells for young, 26 cells for aged, and 19 cells for aged+CASIN in total for chromosome 16
Fig. 4
Fig. 4
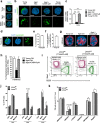
Nuclear volume and nuclear shape are altered upon aging of HSCs. a Representative confocal 3D reconstruction of the nucleus (stained with DAPI, blue) of young, aged, and aged+CASIN 5 μM HSCs. The arrowheads indicate the nuclear invagination normally observed in young and aged+CASIN HSCs. Bar = 2 μm. b Nuclear volume measurements by 3D-structured illumination (SIM) analysis (based on DAPI staining). ***p < 0.001; n = 3 biological repeats, 47 cells for young, 44 cells for aged, and 70 cells for aged+CASIN 5 μM in total. c Nuclear shape factor (NSF) measurements by Volocity 3D Image Analysis. The NSF scores the 3D shape of an object: 1 corresponds to a perfect sphere. *p < 0.05, ***p < 0.001; n = 6 biological repeats, 62 cells for young, 64 cells for aged, and 61 cells for aged+CASIN 5 μM in total. d Cartoon scheme summarizing premature aging-like phenotypes of Cdc42 GAP knockout (Cdc42GAP−/−) mice. e Representative confocal 3D reconstruction of the nucleus (stained with DAPI, blue) of Cdc42GAP+/+ and Cdc42GAP−/− HSCs. The arrowheads indicate the nuclear invagination observed in Cdc42GAP+/+ HSCs. Bar = 2 μm. f Nuclear volume measurements by Volocity 3D Image Analysis (based on DAPI staining). ****p < 0.0001; n = 4 biological repeats, 119 cells for Cdc42GAP+/+, and 102 cells for Cdc42GAP−/− mice in total. g Nuclear shape factor (NSF) measurements by Volocity 3D Image Analysis. The NSF scores the 3D shape of an object: 1 corresponds to a perfect sphere. **p < 0.01, n = 4 biological repeats, 118 cells for Cdc42GAP+/+, and 101 cells for Cdc42GAP−/− mice in total. h Representative confocal 3D reconstruction of the nucleus (stained with DAPI, blue) and of LaminA/C (green) of Cdc42GAP+/+ and Cdc42GAP−/− HSCs. Bar = 2 μm. i LaminA/C volume measurements by Volocity 3D Image Analysis (based on LaminA/C staining). **p < 0.01; n = 3 biological repeats, 50 cells for Cdc42GAP+/+, and 50 cells for Cdc42GAP−/− mice in total
Fig. 5
Fig. 5
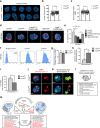
LaminA/C expression in the hematopoietic system is specific to HSCs and is decreased upon aging. a Representative confocal 3D reconstruction of the nucleus (stained with DAPI, blue) and LaminB (green) of young, aged, and aged+CASIN 5 μM HSCs. Bar = 2 μm. b Representative confocal 3D reconstruction of the nucleus (stained with DAPI, blue) and of LaminA/C (green) of young, aged, aged+CASIN 5 μM HSCs, and young ST-HSCs. Bar = 2 μm. c Lmna transcript levels in young, aged, aged+CASIN 5 μM HSCs, and in young ST-HSCs. Shown are mean values + 1 SE; n = 3 biological repeats; ****p < 0.0001. d Representative distribution of LaminA/C (green) in young HSCs. Bar = 2 μm. The arrow indicates LaminA/C distribution in the deep invagination of young HSCs nuclei. e Percentage of young HSCs with invaginated nuclei, n = 4 biological repeats, 45 single HSCs in total. f Percentage of young HSCs which have LaminA/C distribution in the invagination site of HSCs nuclei out of invaginated HSCs, n = 4 biological repeats, 45 single HSCs in total. g Representative confocal 3D reconstruction of the distribution of H3K9me2 in young, aged, and aged CASIN-treated LT-HSCs. Bar = 2 μm. h Percentage of young, aged, and aged+CASIN 5 μM HSCs presenting with peripheral heterochromatin localization of H3K9me2, n = 3 biological repeats, ~ 150 single HSCs for young and aged, 20 single HSCs for aged+CASIN 5 μM in total; *p < 0.05. i Representative FACS dot plots of B220+, CD3+, and myeloid (Gr1+, Mac1+, and Gr1+Mac1+) cells in control Lmnafl/fl and LmnaΔ/Δ/Vav-Cre PB. j Percentage of B220+, CD3+, and myeloid (Gr1+, Mac1+, and Gr1+Mac1+) cells in PB of control Lmnafl/fl and LmnaΔ/Δ/Vav-Cre mice; *p < 0.05, n = 4–6 mice. k Hematologic analyses of control Lmnafl/fl and LmnaΔ/Δ/Vav-Cre mice. *p < 0.05, **p < 0.01; n = 5–6 mice
Fig. 6
Fig. 6
The decrease of LaminA/C expression in HSCs determines changes in nuclear volume and shape, H4K16ac polarity, and chromosome 11 homolog proximity. a Representative confocal 3D reconstruction of the nucleus (stained with DAPI, blue) of Lmnafl/fl and LmnaΔ/Δ/Vav-Cre HSCs. Bar = 2 μm. b Nuclear volume measurements by Volocity 3D Image Analysis (based on DAPI staining). **p < 0.01; n = 8 biological repeats; 100 single HSCs for Lmnafl/fl, 115 single HSCs for LmnaΔ/Δ/Vav-Cre in total. c Nuclear shape factor (NSF) measurements. *p < 0.05; n = 4 biological repeats; 99 HSCs for Lmnafl/fl, 100 HSCs for LmnaΔ/Δ/Vav-Cre in total. d Representative distribution of H4K16ac in Lmnafl/fl, LmnaΔ/Δ/Vav-Cre, LmnaΔ/Δ/Vav-Cre + CASIN 5 μM, aged, and aged+CASIN 5 μM HSCs. Bar = 2 μm. Panels show DAPI (nucleus, blue), H4K16ac (red). e Percentage of Lmnafl/fl, LmnaΔ/Δ/Vav-Cre, LmnaΔ/Δ/Vav-Cre + CASIN 5 μM, aged, and aged+CASIN 5 μM HSCs with a polar distribution of H4K16ac. Shown are mean values + 1 SE; n = 3–5 biological repeats, ~ 30–100 single HSCs scored per sample in total; *p < 0.05, ***p < 0.001. f Representative FACS histograms of an isotype control stained sample and of H4K16ac in Lmnafl/fl and LmnaΔ/Δ7Vav-Cre samples. HSCs gates are shown. g Median fluorescence intensity of H4K16ac in HSCs of control Lmnafl/fl and LmnaΔ/Δ/Vav-Cre mice; n = 3 biological repeats. h Measurements of the distances between chromosome 11 homologs in Lmnafl/fl and LmnaΔ/ΔVav-Cre HSCs by Volocity 3D Image Analysis; **p < 0.01; n = 3 biological repeats, 27 cells for Lmnafl/fl, 30 cells for LmnaΔ/Δ/Vav-Cre in total. i Percentage of Lmnafl/fl and LmnaΔ/Δ/Vav-Cre HSCs with chromosome homologs proximity for chromosome 11; n = 3 biological repeats; *p < 0.05. j Representative confocal 3D reconstruction of the nucleus (stained with DAPI, blue) and of chromosome 11 (red, FISH stained with a full-paint probe) in Lmnafl/fl and LmnaΔ/Δ/Vav-Cre HSCs. Bar = 2 μm. k 3D reconstruction of the chromosome 11 homologs (red and green) and the distance measurement between them by Volocity 3D Image Analysis. In Lmnafl/fl HSCs green, color for two homologs shows that they are distributed very close to each other and are not recognized as two objects by the software. While in LmnaΔ/Δ/Vav-Cre HSCs, they are marked as two objects in green and red. Bar = 2 μm. l Summary of premature aging-like phenotypes in the hematopoietic system of LaminA/C conditional knockout mice. m Aging of HSCs compartment. Cartoon scheme integrating the novel main findings. The newly identified HSC aging phenotypes are highlighted in red

Similar articles

  • Cdc42 activity regulates hematopoietic stem cell aging and rejuvenation.
    Florian MC, Dörr K, Niebel A, Daria D, Schrezenmeier H, Rojewski M, Filippi MD, Hasenberg A, Gunzer M, Scharffetter-Kochanek K, Zheng Y, Geiger H. Florian MC, et al. Cell Stem Cell. 2012 May 4;10(5):520-30. doi: 10.1016/j.stem.2012.04.007. Cell Stem Cell. 2012. PMID: 22560076 Free PMC article.
  • Cdc42 and aging of hematopoietic stem cells.
    Geiger H, Zheng Y. Geiger H, et al. Curr Opin Hematol. 2013 Jul;20(4):295-300. doi: 10.1097/MOH.0b013e3283615aba. Curr Opin Hematol. 2013. PMID: 23615056 Free PMC article. Review.
  • Aging alters the epigenetic asymmetry of HSC division.
    Florian MC, Klose M, Sacma M, Jablanovic J, Knudson L, Nattamai KJ, Marka G, Vollmer A, Soller K, Sakk V, Cabezas-Wallscheid N, Zheng Y, Mulaw MA, Glauche I, Geiger H. Florian MC, et al. PLoS Biol. 2018 Sep 20;16(9):e2003389. doi: 10.1371/journal.pbio.2003389. eCollection 2018 Sep. PLoS Biol. 2018. PMID: 30235201 Free PMC article.
  • Attrition of X Chromosome Inactivation in Aged Hematopoietic Stem Cells.
    Grigoryan A, Pospiech J, Krämer S, Lipka D, Liehr T, Geiger H, Kimura H, Mulaw MA, Florian MC. Grigoryan A, et al. Stem Cell Reports. 2021 Apr 13;16(4):708-716. doi: 10.1016/j.stemcr.2021.03.007. Epub 2021 Apr 1. Stem Cell Reports. 2021. PMID: 33798450 Free PMC article.
  • Epigenetic regulation of hematopoietic stem cell aging.
    Beerman I, Rossi DJ. Beerman I, et al. Exp Cell Res. 2014 Dec 10;329(2):192-9. doi: 10.1016/j.yexcr.2014.09.013. Epub 2014 Sep 28. Exp Cell Res. 2014. PMID: 25261778 Free PMC article. Review.

Cited by

References

    1. Schultz MB, Sinclair DA. When stem cells grow old: phenotypes and mechanisms of stem cell aging. Development. 2016;143:3–14. doi: 10.1242/dev.130633. - DOI - PMC - PubMed
    1. Akunuru S, Geiger H. Aging, clonality, and rejuvenation of hematopoietic stem cells. Trends Mol Med. 2016;22:701–712. doi: 10.1016/j.molmed.2016.06.003. - DOI - PMC - PubMed
    1. Geiger H, de Haan G, Florian MC. The ageing haematopoietic stem cell compartment. Nat Rev Immunol. 2013;13:376–389. doi: 10.1038/nri3433. - DOI - PubMed
    1. Snoeck HW. Aging of the hematopoietic system. Curr Opin Hematol. 2013;20:355–361. doi: 10.1097/MOH.0b013e3283623c77. - DOI - PubMed
    1. Beerman I, Maloney WJ, Weissmann IL, Rossi DJ. Stem cells and the aging hematopoietic system. Curr Opin Immunol. 2010;22:500–506. doi: 10.1016/j.coi.2010.06.007. - DOI - PMC - PubMed

Publication types