. 2019 Jan 17;133(3):224-236.
doi: 10.1182/blood-2018-08-867648. Epub 2018 Oct 25.

Dual cholinergic signals regulate daily migration of hematopoietic stem cells and leukocytes

Affiliations

Dual cholinergic signals regulate daily migration of hematopoietic stem cells and leukocytes

Andrés García-García et al. Blood. .

Erratum in

Abstract

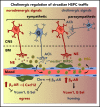
Hematopoietic stem and progenitor cells (HSPCs) and leukocytes circulate between the bone marrow (BM) and peripheral blood following circadian oscillations. Autonomic sympathetic noradrenergic signals have been shown to regulate HSPC and leukocyte trafficking, but the role of the cholinergic branch has remained unexplored. We have investigated the role of the cholinergic nervous system in the regulation of day/night traffic of HSPCs and leukocytes in mice. We show here that the autonomic cholinergic nervous system (including parasympathetic and sympathetic) dually regulates daily migration of HSPCs and leukocytes. At night, central parasympathetic cholinergic signals dampen sympathetic noradrenergic tone and decrease BM egress of HSPCs and leukocytes. However, during the daytime, derepressed sympathetic noradrenergic activity causes predominant BM egress of HSPCs and leukocytes via β3-adrenergic receptor. This egress is locally supported by light-triggered sympathetic cholinergic activity, which inhibits BM vascular cell adhesion and homing. In summary, central (parasympathetic) and local (sympathetic) cholinergic signals regulate day/night oscillations of circulating HSPCs and leukocytes. This study shows how both branches of the autonomic nervous system cooperate to orchestrate daily traffic of HSPCs and leukocytes.


Conflict of interest statement

Conflict-of-interest disclosure: The authors declare no competing financial interests.

Figures
None
Graphical abstract
Figure 1.
Figure 1.
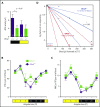
Cholinergic neural signals regulate circadian traffic of HSCs and leukocytes in mice. (A) AChE activity in urine samples from Gfra2−/− and WT mice collected in the nocturnal (black) and diurnal (yellow) periods. HSPCs measured as CFU-Cs (B) and WBCs (C) in peripheral blood of Gfra2−/− mice and control Gfra2+/− mice harvested at the specified ZT (hours after light onset). ZT1 has been duplicated to facilitate viewing. (D) HSCs, measured by long-term competitive repopulation assay, in peripheral blood harvested at ZT13 from Gfra2−/− mice and control Gfra2+/− mice. The log fraction of mice that failed reconstitution is plotted against the transplanted blood volume using ELDA software. Likelihood ratio test of single-hit model, P = .006, χ2 test. Blood HSC concentrations are indicated (n = 5). Data are mean ± standard error of the mean; n (inside bars/symbols) and P values (multivariate analysis for >2 groups) are indicated. *P < .05, ***P < .001, 1-way ANOVA and Bonferroni comparisons (A), multiple 2-tailed test (B-C), χ2 test (D).
Figure 2.
Figure 2.
Cholinergic neural signals regulate HSPC and leukocyte traffic by modulating sympathetic noradrenergic tone centrally. (A-B) Representative immunofluorescence of CD31+ endothelial cells (blue), tyrosine hydroxylase–positive sympathetic nerve fibers (TH; red), and nestin-GFP+ cells (green) in the skull BM of Nes-gfp;Gfra2+/− and Nes-gfp;Gfra2−/− compound mice. Scale bars, 100 μm. (C) Quantification of the skull BM area covered by TH+ sympathetic noradrenergic nerve fibers from Gfra2+/− mice and Gfra2−/− mice. (D) Nocturnal (black) and diurnal (yellow) norepinephrine concentration in the urine of Gfra2+/− and Gfra2−/− compound mice. (E) Scheme illustrating the different types of cholinergic antagonists used and their capacity to cross the BBB. Mecamylamine and scopolamine are BBB-permeable antagonists, whereas hexamethonium and methylatropine are BBB-nonpermeable antagonists. Blood-circulating HSPCs, measured as CFU-Cs (F) and WBCs (G) at ZT13 in WT mice treated with acetylcholine antagonists (i.p.) at ZT5. (C-D,F-G) Data are mean ± standard error of the mean; n (inside bars) and P values (multivariate analysis for >2 groups) are indicated. *P < .05, **P < .01, unpaired 2-tailed t test (C), 1-way analysis of variance with Bonferroni comparisons (D,F-G). a.u, arbitrary units; ns, not significant.
Figure 3.
Figure 3.
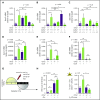
The PNS regulates nocturnal HSC BM adhesion and homing. (A) Scheme showing the protocol used for the HSPC BM homing assay with irradiation (12 Gy). (B) Frequencies of HSPCs (homing efficiency) at ZT2 that homed during the night to the BM after IV transplantation into lethally irradiated mice (12 Gy) (to promote homing) at ZT10. Gfra2−/− mice and control Gfra2+/− mice were used as donor (lower genotypes) or recipients (upper genotypes) in all combinations. Homing efficiency is determined as the percentage of CFU-Cs obtained from BM harvested from irradiated mice in comparison with CFU-Cs obtained from a nonirradiated mouse. (C) Scheme showing the protocol used for the HSPC BM homing assay without irradiation. (D) Frequencies of donor-derived Gfra2+/+ or Gfra2−/− linsca-1+c-kit+ HSPCs (identified by flow cytometry) at ZT2 that homed during the night to the BM after IV transplantation in nonirradiated congenic mice at ZT10. Vcam1 (E), Sele (F), and Selp (G) mRNA expression in the unfractionated BM of Gfra2−/− and Gfra2+/− control mice at the specified ZT. ZT21 has been duplicated to facilitate viewing. (B,D-G) Data are mean ± standard error of the mean; n (inside bars) and P values (multivariate analysis for >2 groups) are indicated. *P < .05, 1-way analysis of variance and Bonferroni comparisons (B,D), multiple 2-tailed test (E-G). ns, not significant.
Figure 4.
Figure 4.
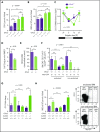
Parasympathetic deficiency increases nocturnal HSPC BM adhesion and homing through β2-adrenergic signaling in the microenvironment. Vcam1 (A), Sele (B), and Selp (C) mRNA expression at ZT13 in the unfractionated BM of control Gfra2+/− mice, Gfra2−/− mice, single β2-AR (Adrb2)-deficient or β3-AR (Adrb3)-deficient mice, or compound Gfra2−/−Adrb2−/− and Gfra2−/−Adrb3−/− mice. Vcam1 (D), Sele (E), and Selp (F) mRNA expression at ZT13 in CD45Ter119 endothelial (CD31+) or nonendothelial (CD31) cells from Gfra2−/− and control Gfra2+/− mice. (G) Scheme showing the protocol used for blockade of in vivo HSPC adhesion to blood vessels using antibodies against α4-integrin, P-selectin, and E-selectin (IV injection at ZT11 and analysis at ZT13). (H) HSPCs circulating at ZT13, 2 hours after injection of blocking antibodies (Abs) or control IgG. Please note that CFU-C fold change goes from a 3.2-fold increase in control immunoglobulin G–treated mice to a 1.3-fold increase in blocking antibody–treated mice. (I) Frequencies of donor-derived WT CD45.1+ linsca1+ckit+ HSPCs at ZT2 that homed during the night to the BM after IV transplantation (at ZT10) into nonirradiated Gfra2−/− mice or control Gfra2+/− mice preconditioned with saline or β2 adrenergic antagonist (ICI118,551) 4 hours before transplantation. (A-F,H-I) Data are mean ± standard error of the mean; n (inside bars) and P values (multivariate analysis for >2 groups) are indicated. *P < .05, **P < .01, ***P < .001, 1-way analysis of variance with Bonferroni comparisons. ns, not significant.
Figure 5.
Figure 5.
The PNS inhibits β3-adrenergic–dependent BM egress of HSPCs at night. HSPCs, measured as CFU-Cs (A), and WBCs (B) circulating at ZT13, 16 weeks after BM transplantation into lethally irradiated mice. Gfra2−/− mice and control Gfra2+/− mice were used as donor (lower genotypes) or recipients (upper genotypes) in all combinations. (C) Cxcl12 mRNA expression in the BM of Gfra2−/− and Gfra2+/− control mice at the specified ZT. ZT21 has been duplicated to facilitate viewing. (D) Cxcl12 concentration in BM extracellular fluid (BMECF) at ZT13. (E) Kitl mRNA expression in the BM of Gfra2−/− and Gfra2+/− control mice at ZT13. (F) Number of stromal Nes-GFPhi/lo cells in endosteal and nonendosteal BM (upper panel). Representative flow cytometry plot showing CD31 and Nes-GFP expression in CD45Ter119 cells isolated from endosteal BM of Gfra2−/− and control Gfra2+/+ mice (lower panel). (G) CFU-C fold change at ZT13 in control Gfra2+/− mice, Gfra2−/− mice, single β2- or β3-AR (Adrb2, Adrb3)–deficient mice, or compound Gfra2−/−Adrb2−/− and Gfra2−/−Adrb3−/− mice. (H) WBCs circulating at ZT13 in control Gfra2+/− mice, Gfra2−/− mice, single β2- or β3-AR (Adrb2, Adrb3)–deficient mice, or compound Gfra2−/−Adrb2−/− and Gfra2−/−Adrb3−/− mice. All data are mean ± standard error of the mean; n (inside bars) and P values (multivariate analysis for >2 groups) are indicated. *P < .05, **P < .01, ***P < .001, 1-way analysis of variance with Bonferroni comparisons (A-B,F-H), multiple 2-tailed test (C), unpaired 2-tailed t test (D-E). ns, not significant.
Figure 6.
Figure 6.
Local cholinergic signals regulate oscillatory expression of β3-AR in BM. Adrb2 (A) and Adrb3 (B) mRNA expression in the BM of Gfra2−/− and Gfra2+/− control mice at the specified ZT. ZT21 has been duplicated to facilitate viewing. (C) Adrb3 mRNA expression in MS-5 cell line cultures treated with vehicle (veh) or acetylcholine (ach; 10 µM) for 6 hours. (D) Adrb3 mRNA expression in the BM of WT mice treated with acetylcholine antagonists (i.p.) at ZT5 and analyzed at ZT13. All data are mean ± standard error of the mean; n (inside bars) and P values (multivariate analysis for >2 groups) are indicated. *P < .05, ***P < .001, multiple 2-tailed test (A-B), unpaired 2-tailed t test (C), 1-way analysis of variance with Bonferroni comparisons (D).
Figure 7.
Figure 7.
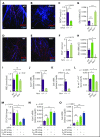
Sympathetic cholinergic signals locally repress adhesion to BM vessels during the daytime. Z-stack projection showing immunofluorescence of CD31+ endothelial cells (blue) and VAChT+ nerve fibers (red) in the skull of WT (A) and Gfra2−/− (B) mice. Scale bar, 100 μm. (C) Quantification of VAChT+ fibers in the skull periosteum of Gfra2−/− and WT mice. Immunofluorescence of CD31+ endothelial cells (blue) and Gfrα2+ nerve fibers (red) in the skull of WT (D) and Nrtn−/− (E) mice. Scale bar, 100 μm. (F) Quantification of Gfrα2+ fibers in the skull periosteum of Nrtn−/− and WT mice. Gfra2 (G) and Nrtn (H) mRNA expression at ZT13 in the BM of Gfra2−/−, Nrtn−/−, and WT mice. (I) Normalized WBC counts in peripheral blood of Gfra2−/−, Nrtn−/−, and WT mice at ZT13. Vcam1 (J) and Sele (K) mRNA expression at ZT13 in the unfractionated BM of control Nrtn+/+ and compound Nrtn−/− mice. (L) Frequencies of donor-derived WT linsca1+ckit+ HSPCs that homed to the BM at ZT5, 6 hours after IV transplantation into nonirradiated Gfra2−/−, Nrtn−/−, and WT mice (at ZT23). (M) Blood CFU-C fold change at ZT5 in WT mice treated with saline, β-AR antagonists, or cholinergic nicotinic (Chrn) antagonist at ZT23. Vcam1 (N) and Sele (O) mRNA expression at ZT5 in the BM of WT mice treated with saline, β-AR antagonists, or cholinergic nicotinic antagonist at ZT23. (C,F-O) Data are mean ± standard error of the mean; n (inside bars) and P values (multivariate analysis for >2 groups) are indicated. *P < .05, **P < .01, ***P < .001, unpaired 2-tailed t test (C,F,J-K), 1-way analysis of variance with Bonferroni comparisons (G-I,L-O). ns, not significant.

Comment in

Similar articles

Cited by

References

    1. Morrison SJ, Scadden DT. The bone marrow niche for haematopoietic stem cells. Nature. 2014;505(7483):327-334. - PMC - PubMed
    1. Francis NJ, Landis SC. Cellular and molecular determinants of sympathetic neuron development. Annu Rev Neurosci. 1999;22(1):541-566. - PubMed
    1. Apostolova G, Dechant G. Development of neurotransmitter phenotypes in sympathetic neurons. Auton Neurosci. 2009;151(1):30-38. - PubMed
    1. Cane KN, Anderson CR. Generating diversity: Mechanisms regulating the differentiation of autonomic neuron phenotypes. Auton Neurosci. 2009;151(1):17-29. - PubMed
    1. Yamazaki K, Allen TD. Ultrastructural morphometric study of efferent nerve terminals on murine bone marrow stromal cells, and the recognition of a novel anatomical unit: the “neuro-reticular complex.” Am J Anat. 1990;187(3):261-276. - PubMed

Publication types

MeSH terms

Substances