

Engaging cervical spinal circuitry with non-invasive spinal stimulation and buspirone to restore hand function in chronic motor complete patients
- PMID: 30341390
- PMCID: PMC6195617
- DOI: 10.1038/s41598-018-33123-5
Engaging cervical spinal circuitry with non-invasive spinal stimulation and buspirone to restore hand function in chronic motor complete patients
Abstract
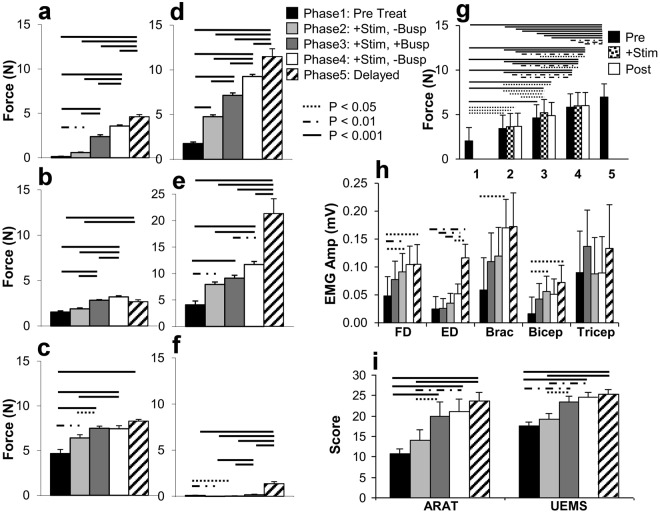
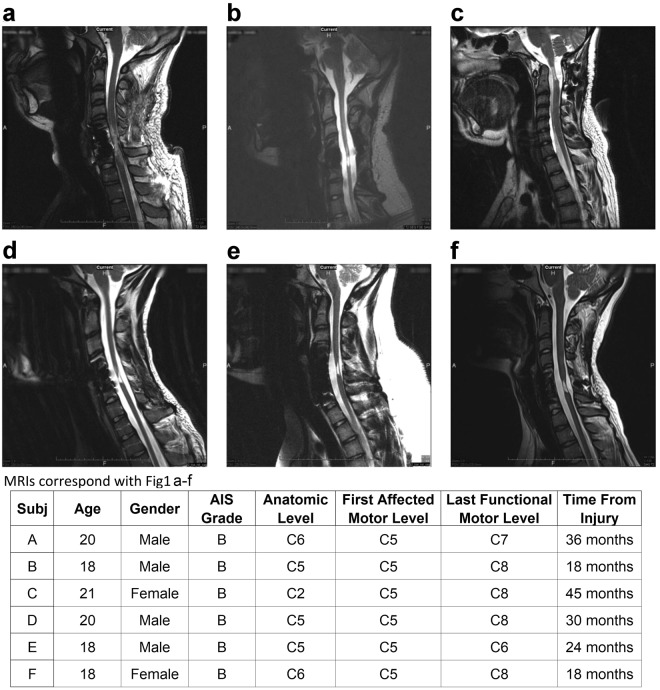
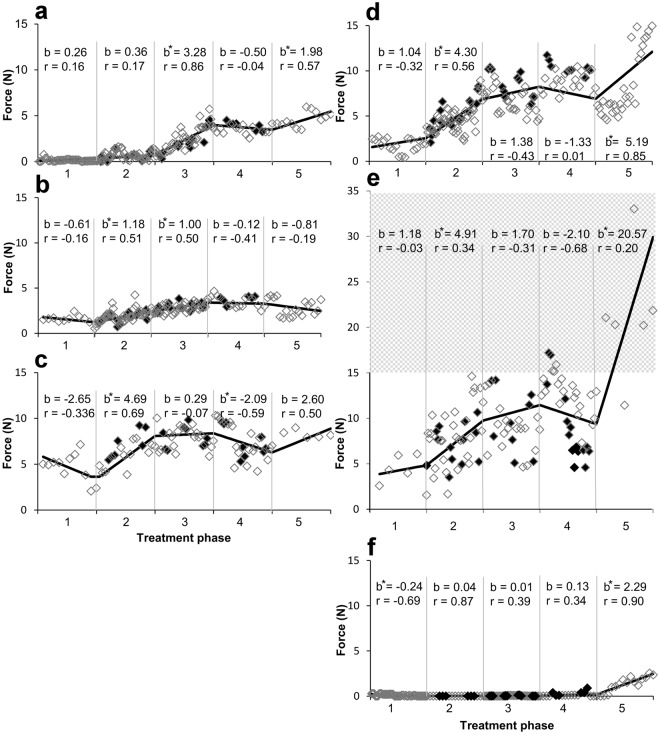
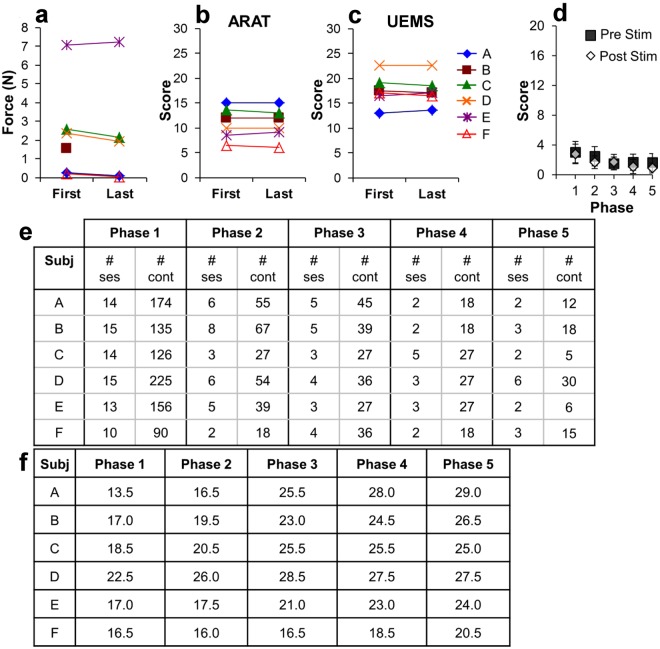
The combined effects of cervical electrical stimulation alone or in combination with the monoaminergic agonist buspirone on upper limb motor function were determined in six subjects with motor complete (AIS B) injury at C5 or above and more than one year from time of injury. Voluntary upper limb function was evaluated through measures of controlled hand contraction, handgrip force production, dexterity measures, and validated clinical assessment batteries. Repeated measure analysis of variance was used to evaluate functional metrics, EMG amplitude, and changes in mean grip strength. In aggregate, mean hand strength increased by greater than 300% with transcutaneous electrical stimulation and buspirone while a corresponding clinically significant improvement was observed in upper extremity motor scores and the action research arm test. Some functional improvements persisted for an extended period after the study interventions were discontinued. We demonstrate that, with these novel interventions, cervical spinal circuitry can be neuromodulated to improve volitional control of hand function in tetraplegic subjects. The potential impact of these findings on individuals with upper limb paralysis could be dramatic functionally, psychologically, and economically.
Conflict of interest statement
D.C.L., V.R.E., and Y.G. have ownership interest in NeuroEnabling Technologies, which develops the transcutaneous stimulator to improve motor function to address paralysis.
Figures
Similar articles
-
Minimal handgrip force is needed for transcutaneous electrical stimulation to improve hand functions of patients with severe spinal cord injury.Sci Rep. 2022 May 11;12(1):7733. doi: 10.1038/s41598-022-11306-5. Sci Rep. 2022. PMID: 35545644 Free PMC article. Clinical Trial.
-
Engaging Cervical Spinal Cord Networks to Reenable Volitional Control of Hand Function in Tetraplegic Patients.Neurorehabil Neural Repair. 2016 Nov;30(10):951-962. doi: 10.1177/1545968316644344. Epub 2016 May 18. Neurorehabil Neural Repair. 2016. PMID: 27198185 Free PMC article.
-
Serotonergic Facilitation of Forelimb Functional Recovery in Rats with Cervical Spinal Cord Injury.Neurotherapeutics. 2021 Apr;18(2):1226-1243. doi: 10.1007/s13311-020-00974-8. Epub 2021 Jan 8. Neurotherapeutics. 2021. PMID: 33420588 Free PMC article.
-
Noninvasive Electromagnetic Neuromodulation of the Central and Peripheral Nervous System for Upper-Limb Motor Strength and Functionality in Individuals with Cervical Spinal Cord Injury: A Systematic Review and Meta-Analysis.Sensors (Basel). 2024 Jul 19;24(14):4695. doi: 10.3390/s24144695. Sensors (Basel). 2024. PMID: 39066092 Free PMC article. Review.
-
A review of methods for achieving upper limb movement following spinal cord injury through hybrid muscle stimulation and robotic assistance.Exp Neurol. 2020 Jun;328:113274. doi: 10.1016/j.expneurol.2020.113274. Epub 2020 Mar 5. Exp Neurol. 2020. PMID: 32145251 Review.
Cited by
-
Buspirone Dose-Response on Facilitating Forelimb Functional Recovery in Cervical Spinal Cord Injured Rats.Dose Response. 2021 Feb 27;19(1):1559325821998136. doi: 10.1177/1559325821998136. eCollection 2021 Jan-Mar. Dose Response. 2021. PMID: 33716591 Free PMC article.
-
Synergistic implications of combinatorial rehabilitation approaches using spinal stimulation on therapeutic outcomes in spinal cord injury.Clin Neurophysiol. 2024 Sep;165:166-179. doi: 10.1016/j.clinph.2024.06.015. Epub 2024 Jul 9. Clin Neurophysiol. 2024. PMID: 39033698 Review.
-
Combined cervical transcutaneous with lumbosacral epidural stimulation improves voluntary control of stepping movements in spinal cord injured individuals.Front Bioeng Biotechnol. 2023 Feb 2;11:1073716. doi: 10.3389/fbioe.2023.1073716. eCollection 2023. Front Bioeng Biotechnol. 2023. PMID: 36815892 Free PMC article.
-
Contralateral Selectivity of Upper-Limb Motor Pools via Targeted Stimulation of the Cervical Spinal Cord.Biomedicines. 2023 Jan 24;11(2):332. doi: 10.3390/biomedicines11020332. Biomedicines. 2023. PMID: 36830867 Free PMC article.
-
Targeted transcutaneous spinal cord stimulation promotes persistent recovery of upper limb strength and tactile sensation in spinal cord injury: a pilot study.Front Neurosci. 2023 Jul 7;17:1210328. doi: 10.3389/fnins.2023.1210328. eCollection 2023. Front Neurosci. 2023. PMID: 37483349 Free PMC article.
References
-
- International Campaign for Cures of Spinal Cord Injury Paralysis. (2015). - PubMed
Publication types
MeSH terms
Substances
Grants and funding
LinkOut - more resources
Full Text Sources
Medical
Miscellaneous
