. 2018 Oct 18;9(1):4325.
doi: 10.1038/s41467-018-06632-0.

The architecture of EGFR's basal complexes reveals autoinhibition mechanisms in dimers and oligomers

Affiliations

The architecture of EGFR's basal complexes reveals autoinhibition mechanisms in dimers and oligomers

Laura C Zanetti-Domingues et al. Nat Commun. .

Abstract

Our current understanding of epidermal growth factor receptor (EGFR) autoinhibition is based on X-ray structural data of monomer and dimer receptor fragments and does not explain how mutations achieve ligand-independent phosphorylation. Using a repertoire of imaging technologies and simulations we reveal an extracellular head-to-head interaction through which ligand-free receptor polymer chains of various lengths assemble. The architecture of the head-to-head interaction prevents kinase-mediated dimerisation. The latter, afforded by mutation or intracellular treatments, splits the autoinhibited head-to-head polymers to form stalk-to-stalk flexible non-extended dimers structurally coupled across the plasma membrane to active asymmetric tyrosine kinase dimers, and extended dimers coupled to inactive symmetric kinase dimers. Contrary to the previously proposed main autoinhibitory function of the inactive symmetric kinase dimer, our data suggest that only dysregulated species bear populations of symmetric and asymmetric kinase dimers that coexist in equilibrium at the plasma membrane under the modulation of the C-terminal domain.


Conflict of interest statement

The authors declare no competing interests.

Figures
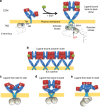
Fig. 1
Fig. 1
Models of ligand-free and ligand-bound EGFR complexes. a Top left: Cartoon of an EGFR monomer. Top right: A ligand-bound back-to-back extracellular dimer,. This is linked to the catalytically active asymmetric TKD (aTKD) dimer by an N-terminal crossing transmembrane (TM) dimer and an antiparallel juxtamembrane-A (JM-A) helical dimer. b Cartoon of the extracellular portion and TM domains of ligand-bound EGFR polymers formed by alternating back-to-back and face-to-face interfaces. Two EGF molecules are bound at the end-receptors capping the polymer chain with a 2N:2 receptor/ligand stoichiometry. An 8:2 octamer is shown (intracellular regions not depicted). c Cartoon of a speculative ligand-free side-to-side dimer that would putatively combine the double autoinhibition of a tethered extracellular domain and a symmetric tyrosine kinase domain (sTKD) dimer,,. d Cartoon of a ligand-free extended back-to-back dimer coupled via a TM domain C-crossing dimer to an sTKD dimer (modified from Arkhipov et al.). e Cartoon of a stalk-to-stalk tethered dimer coupled via an N-crossing TM domain dimer to the aTKD dimer induced by TKI binding in the C-terminal domain truncated Δ998-EGFR (modified from Lu et al.). For all panels ECM domains I and III are in red, II and IV in blue, EGF ligand is in green, plasma membrane in yellow, TM in teal, JM in dark grey, TKD in light grey
Fig. 2
Fig. 2
FLImP measurement of pairwise DIII-binding Affibody separations. a Cartoon of FLImP histograms. Left: A dimer (receptors, blue; label, red) gives rise to one separation, the empirical posterior of which has a confidence interval (CI) that depends on the combined localisation errors of the two molecules. CI size determines resolution. CIs less than the required resolution are retained according to signal-to-noise without bias,–,, generating a FLImP distribution (grey) that is fitted by the sum of a number of Rician peaks. If oligomers are present and internally probed (middle) and/or the distribution of species is inhomogeneous (right), the histogram contains multiple components. b FLImP distribution (grey) of DIII–DIII separations between CF640R-Affibody molecules bound to wtEGFR on CHO cells, compiled from 68 FLImP measurements (CI ≤ 7 nm), decomposed into a sum of five components (coloured traces). The inset shows positions and error estimates. Additional statistics in Supplementary Fig. 1. The 4 nM concentration of CF640R-Affibody used labels ~20% of receptors (Supplementary Fig. 2) ensuring single particle detection. FLImP is stochastic, thus independent of the CF640R-Affibody/receptor ratio if sufficient data are collected, and uses fixed cells to avoid relative receptor movements during measurements. However, systematic studies failed to find significant artifacts,. c Molecular-normalised fraction of receptors in oligomer species on wtEGFR-expressing CHO cells treated with 100 nM Alexa 488-Affibody, determined by pbICS. Results are the mean of seven replicates. Error bars show the SD. For more details see Supplementary Fig. 3. d Cartoon showing expected FLImP distributions for a cyclic tetramer labelled with a 1:1 probe binder (like the Affibody) (left), a polymer chain labelled with a 1:1 probe binder (middle), and a polymer showing a 2N:2 labelling stoichiometry (like EGF) (N = receptor number) (right). e FLImP distribution (grey) and peak decomposition of DIII–DIII separations reported by CF640R-Affibody molecules bound to I942E-EGFR on the surface of CHO cells, compiled from 36 FLImP measurements (CI ≤ 7 nm), decomposed into a sum of four peak components (coloured traces). Positions and error estimates are shown in the inset. f As e using 4 nM CF640R-EGF as a probe, compiled from 31 FLImP measurements (CI ≤ 7 nm)
Fig. 3
Fig. 3
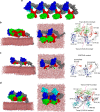
The structural model of ligand-free head-to-head EGFR dimers. a An open-ended oligomer model of 9G8-bound EGFR extracellular domains in the inactive conformation built using the crystal contacts in the monomer structure in PDB ID 4KRP, where 9G8-NB is coloured in cyan, EGFR DI in green, DII (red), DIII (blue), and DIV (grey). b A simulation-generated dimer structure of free EGFR extracellular domains and their TM domains in the lipid bilayer. The simulation was started from the crystal dimer of 9G8-bound EGFR extracellular domains in the tethered conformation in which the two copies of the 9G8-NB were removed from the simulation system. The images are based on the snapshot of the simulation at 20 µs. One of the two transmembrane helices is visible (left and middle panels). The right panel shows the dimer viewed from the membrane, where the trans interaction between DI and DII and the interaction between DIV and DIII are highlighted; the domains of monomer a and b are labelled. c By deleting residues 6–273 from the dimer structure in b, the dimer structure directly mapped to the EGFRvIII glioblastoma mutant. As shown, this dimer structure is likely not viable in EGFRvIII as the trans interaction between DI and DII is precluded by the deletion. d A simulation-generated dimer structure of 9G8-bound EGFR extracellular domains starting from a crystal dimer of 9G8-bound EGFR extracellular domains in the tethered conformation. These images are based on the snapshot of the simulation at 20 µs. Invisible from this image are the TM helices embedded in the membrane. The right panel shows the 9G8-bound dimer viewed from the membrane, where the trans-dimer interaction between DI and DII, and between DIV and DIII are highlighted
Fig. 4
Fig. 4
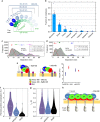
The architecture of ligand-free head-to-head polymers. a Polymer chain formed by repeating the head-to-head interface based on separations in Supplementary Fig. 5a, b and Supplementary Tables 1 and 2 (DII and DIV excluded for simplicity). The intensity is graded according to pbICS results in b, which show the data in Fig. 2c re-normalised to reveal the fractions of oligomer species on wtEGFR-expressing CHO cells treated with 100 nM Alexa 488-Affibody. Results are the mean of seven replicates. Error bars show SD. c FLImP distribution (grey) of DIII–DIII separations in ΔC-EGFR-expressing CHO cells treated with 4 nM CF640R-Affibody, from 41 FLImP measurements (CI ≤ 6 nm). The inset shows positions and error estimates (additional statistics in Supplementary Fig. 7). d As c but from ΔC-EGFR-expressing cells treated with 8 nM CF640R-EgB4-NB (DI–DI separations), from 32 FLImP measurements (CI ≤ 8 nm). Differences with the DIII–DIII distribution are significant (Supplementary Fig. 8). e Left and centre: Cartoons showing a side view of DI and DIII separations from the membrane in head-to-head complexes in the presence and absence of bound 9G8-NB based on Supplementary Fig. 5c–f and Supplementary Table 3. Right: FRET-derived separations from the membrane-DiI to DI (Alexa 488-EgB4-NB, blue) or DIII (Alexa 488-Affibody, red). The bar chart was derived from the measurements in Supplementary Fig. 10. (As predicted by the model, EGFR also forms oligomers on cells treated with 200 nM 9G8-NB (Supplementary Fig. 11a, b). f Two-colour SPT on live cells at 37 °C showing the fraction of tracks where two particles labelled with Alexa 488-Affibody and CF640R-Affibody spent ≥5 frames (250 ms) together within <1 pixel (pairwise particle colocalisation fraction) for cells expressing ΔC-EGFR, wtEGFR and I942E-EGFR. Horizontal spreads separate data points (~5000) within each condition. g Distribution of the duration of pairwise interactions (τON) in f. Horizontal lines mark mean and SD. Coincidental colocalisation statistics were accounted for. p-Values (two-tailed Kolmogorov–Smirnov test) are in Supplementary Fig. 12. h Front view of a ligand-free oligomer illustrating the separation between non-interacting ICM units predicted by extracellular head-to-head interactions. All panels: DI, green; DII, red; DIII, blue; DIV, dark grey; plasma membrane, yellow; TM, grey; TKD silver
Fig. 5
Fig. 5
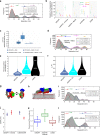
Kinase-mediated ligand-free dimers adopt two ECM dimer architectures. a FLImP distribution (grey) of DIII–DIII separations between CF640R-Affibody molecules bound to wtEGFR on CHO cells treated with 1 μM erlotinib, compiled from 29 FLImP measurements (CI ≤ 6 nm), decomposed into a sum of four components. The concentration of CF640R-Affibody was 4 nM. b Number of measurements consistent with the mean distances resolved in the FLImP distribution of wtEGFR (Fig. 2b) (associated FLImP distributions in Supplementary Fig. 13). Errors were assesed with bootstrap-resampling. c wtEGFR and IIIV/KKRE-EGFR phosphorylation in Y1173 on CHO cells treated or untreated with 10 mM MβCD. Box plots show inclusive median as a line, 25th and 75th quartile as edges, calculated on n = 3 repeats (representative western blots in Supplementary Fig. 14). d As a treated with 10 mM MβCD, from 20 FLImP measurements (CI ≤ 7 nm). e Pairwise particle colocalisation fraction from two-colour SPT on live cells at 37 °C. f Duration of pairwise interactions (τON) in e. Horizontal spreads separate data points (~5000) within each condition. g Crystal structure of tethered wtEGFR (PDB ID 1NQL) highlighting the location of I545K, I556K, I562R, and V592E (yellow). Colours: DI (green), DII (red), DIII (blue), DIV (grey), EGF (orange). h Head-to-head dimer highlighting the residues mutated in the IIIV/KKRE mutant (yellow). i As a but for the IIIV/KKRE-EGFR mutant from 22 FLImP measurements with CI ≤ 7.5 nm. j FRET-DOCA from DI (blue) and DIII (red) to the membrane for wtEGFR + erlotinib, and L680N-EGFR, derived from measurements in Supplementary Fig. 10. FRET probes as in Fig. 4e. k Ratio between CF640R-9G8-NB and Alexa 488-EgB4-NB binding after chemical fixation. wtEGFR, blue; wtEGFR + erlotinib, green; L680N-EGFR, red. Line, median; box edges, 25th and 75th quartile, crosses 5th and 95th quartile, calculated over 30 repeats. Example images and analysis are in Supplementary Fig. 15. l As a but for L680N-EGFR-expressing cells, from 20 FLImP measurements (CI ≤ 6 nm). Lower resolution (8 nm) versions of a, d, and l with ~2-fold more FLImP measurements show the profile of the distributions is conserved (Supplementary Fig. 16)
Fig. 6
Fig. 6
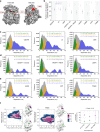
Kinase-mediated regulation of ECM dimer geometry in cancer-associated intracellular mutants. a Kinase domain structure showing the positions of relevant amino acids. b Fractions of FLImP measurements whose ranges of 69% confidence overlap with the ranges of DIII–DIII separations expected for dimers (0–15 nm) (pink) or oligomers (20–60 nm) (blue) collected from cells expressing the receptor mutants and/or under the conditions noted in the X-axis. The associated FLImP distributions are in Supplementary Fig. 18. ce The FLImP distributions (grey) and the distributions compiled from the FLImP measurements whose 69% CIs overlap with DIII–DIII separations = 5 nm (green), 13 nm (yellow), or >20 nm (blue) collected from cells expressing wtEGFR, ΔC-EGFR, Δ698-EGFR, wtEGFR on cells treated with 1 μM erlotinib, wtEGFR on cells treated with 10 mM MβCD, L834R-EGFR, L680N-EGFR, Δ973-EGFR and T766M-EGFR. The insets show the fraction of separations consistent with each distance. Errors were assesed with bootstrap-resampling. f Free-energy surfaces as a function of the helical content of the αC helix and the distance from the reference active conformation (a contact map corresponding to the active extended A-loop conformation) as obtained from PTmetaD simulations of the wtEGFR and T766M-EGFR mutant. The central structures of the most populated clusters are shown (left and middle). The A-loop is coloured green, while the αC helix is shown in purple if it forms an α-helix and in pink if it forms a 310 helix. Salt-bridge interactions formed at the dimer interface in the last µs of the unbiased MD simulations of the symmetric dimers (right panel). The mean values and the standard deviations are calculated across monomers. The salt bridge was considered to be formed if the minimal distance between the side chains of residues in question was <4 Å. (More information on the calculations can be found in Supplementary Methods)
Fig. 7
Fig. 7
Equilibrium between the aTKD and sTKD dimers. a Cartoon of the two dimer configurations of the kinase domain. Starting from the aTKD dimer, a counter clockwise rotation of the activator (blue) along its vertical axis followed by a clockwise rotation along an axis perpendicular to the plane will allow the sTKD to form. b The FLImP distribution (grey) and the distributions compiled from the FLImP measurements whose 69% CIs overlap with DIII–DIII separations = 5 nm (green), 13 nm (yellow), or >20 nm (blue) collected from cells expressing K721A-EGFR compiled from 29 FLImP measurements with CI ≤ 7 nm. The inset shows the fraction of separations consistent with each distance. Errors were assesed with bootstrap-resampling. c Fraction of tracks where two different-colour particles labelled with Alexa 488-Affibody and CF640-Affibody spent ≥5 frames (250 ms) together within <1 pixel (denoted fraction of pairwise particle colocalisation fraction) and d distribution of the duration of these pairwise interactions (τON). Horizontal spreads separate data points (~5000) within each condition. Horizontal white lines mark the mean and SD. Coincidental colocalisation statistics were accounted for. e, f As c, d but in the presence of 10 mM MβCD. p-Values of the significance of differences between conditions are in Supplementary Fig. 20
Fig. 8
Fig. 8
Cartoon models of ligand-free EGFR species on the cell surface. a, b Autoinhibited ligand-free receptors form a dimers and b larger oligomers via extracellular head-to-head interactions. Within head-to-head dimers and oligomers the ICMs remain as non-interacting units. c, d Kinase-mediated receptor dimerisation outcompetes head-to-head interactions to form two types of receptor dimers that typically coexist in equilibrium (bearing aTKD and sTKD dimer configurations). Head-to-head dimers and oligomers are disrupted by kinase-mediated dimerisation independently of whether the driver mutation and/or treatment is activating or not. The ECM architecture of one dimer type is consistent with a back-to-back dimer and structurally coupled to an sTKD dimer, (c). The ECM architecture of the other is consistent with a stalk-to-stalk dimer and structurally coupled via an N-terminal TM crossing to the aTKD dimer (d). The L680N kinase domain mutation shifts the equilibrium toward the dimer population bearing sTKD dimers while L834R shifts the equilibrium towards the dimer population bearing the aTKD dimer. For all panels, DI is in green, DII in red, DIII in blue, DIV, TMD and JMD in grey, TKD in silver

Similar articles

Cited by

References

    1. Lemmon MA, Schlessinger J. Cell signaling by receptor tyrosine kinases. Cell. 2010;141:1117–1134. doi: 10.1016/j.cell.2010.06.011. - DOI - PMC - PubMed
    1. Normanno N, et al. The ErbB receptors and their ligands in cancer: an overview. Curr. Drug Targets. 2005;6:243–257. doi: 10.2174/1389450053765879. - DOI - PubMed
    1. Seshacharyulu P, et al. Targeting the EGFR signaling pathway in cancer therapy. Expert Opin. Ther. Targets. 2012;16:15–31. doi: 10.1517/14728222.2011.648617. - DOI - PMC - PubMed
    1. Wee, P. & Wang, Z. Epidermal growth factor receptor cell proliferation signaling pathways. Cancers9, 52 (2017). - PMC - PubMed
    1. Ferguson KM, et al. EGF activates its receptor by removing interactions that autoinhibit ectodomain dimerization. Mol. Cell. 2003;11:507–517. doi: 10.1016/S1097-2765(03)00047-9. - DOI - PubMed

Publication types