. 2018 Sep 27:9:2091.
doi: 10.3389/fimmu.2018.02091. eCollection 2018.

Polyphyllin I Ameliorates Collagen-Induced Arthritis by Suppressing the Inflammation Response in Macrophages Through the NF-κB Pathway

Affiliations

Polyphyllin I Ameliorates Collagen-Induced Arthritis by Suppressing the Inflammation Response in Macrophages Through the NF-κB Pathway

Qiong Wang et al. Front Immunol. .

Abstract

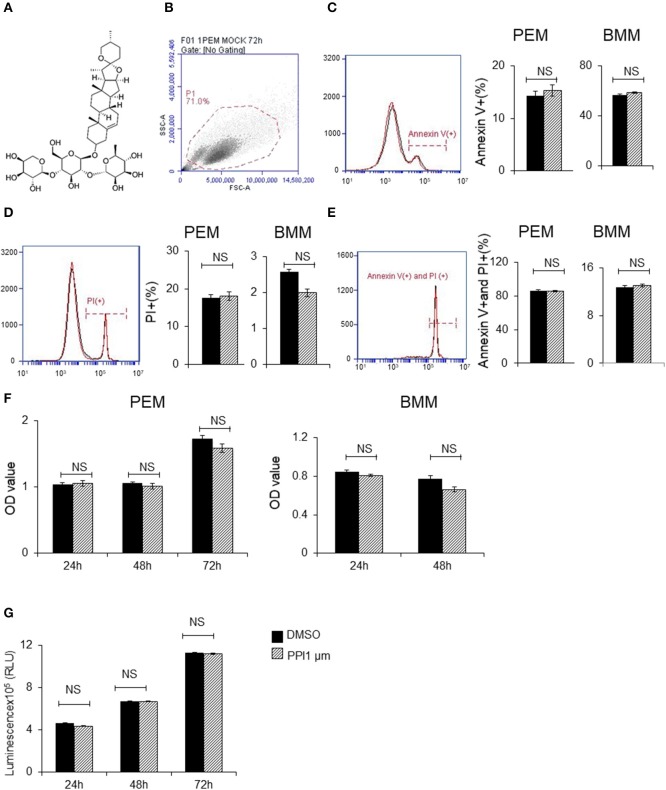
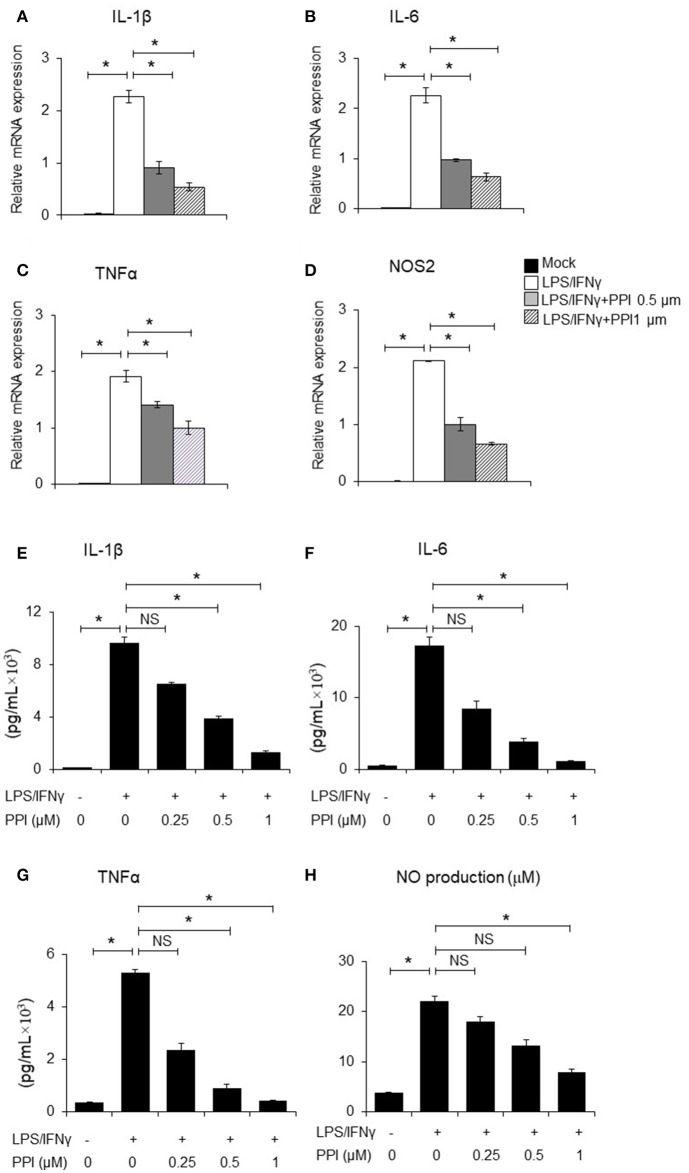
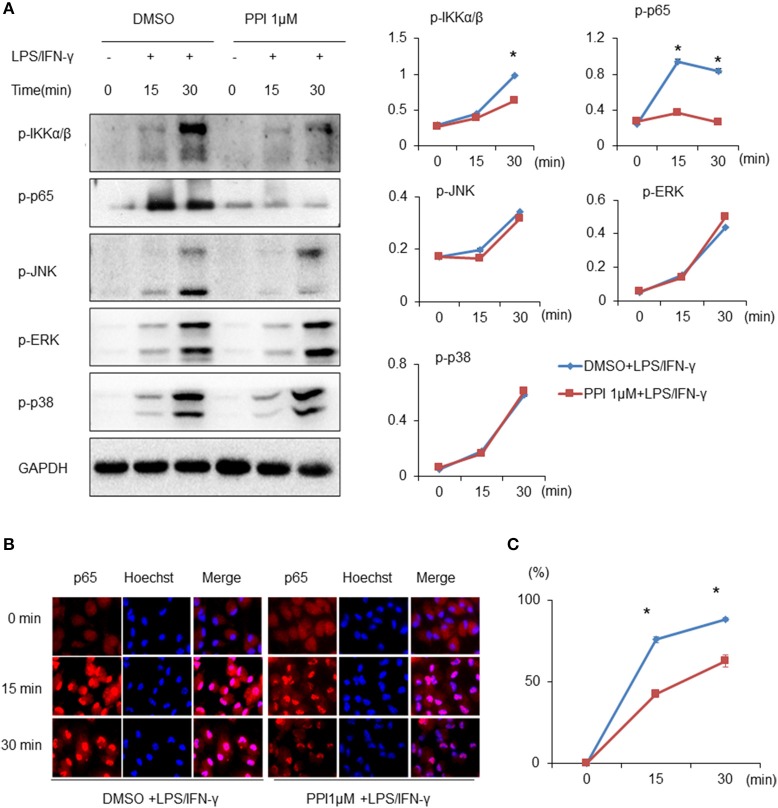
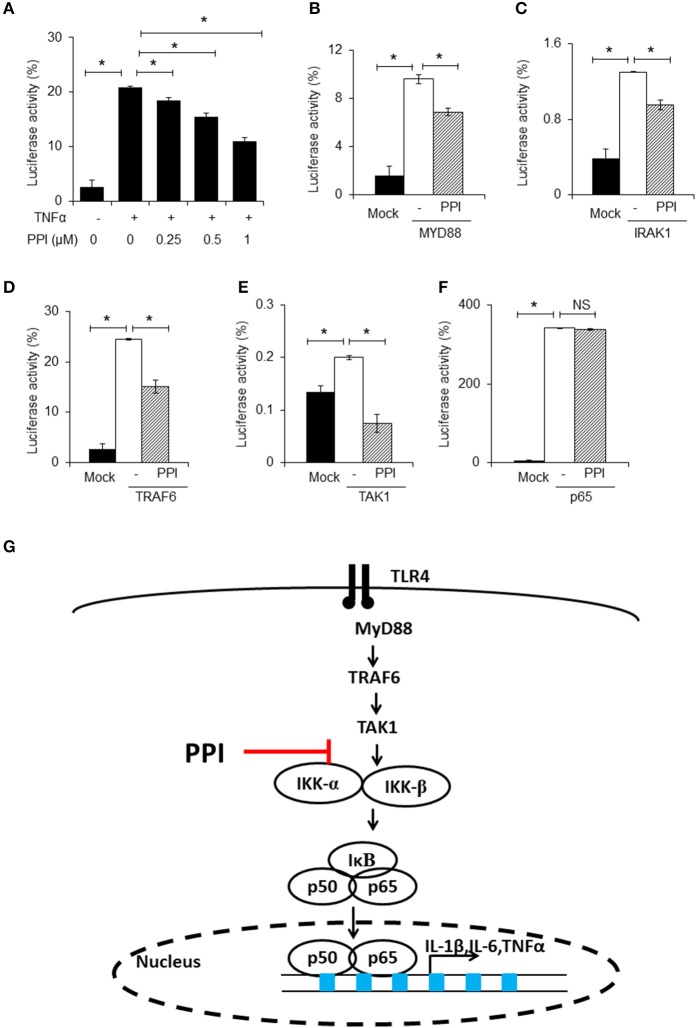
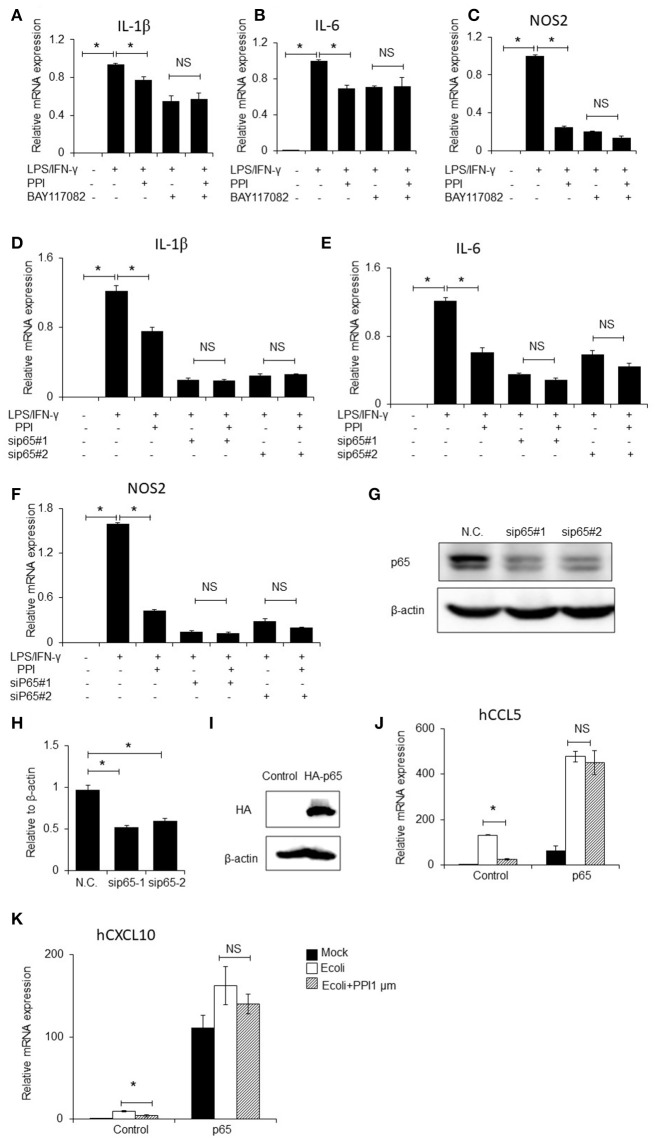
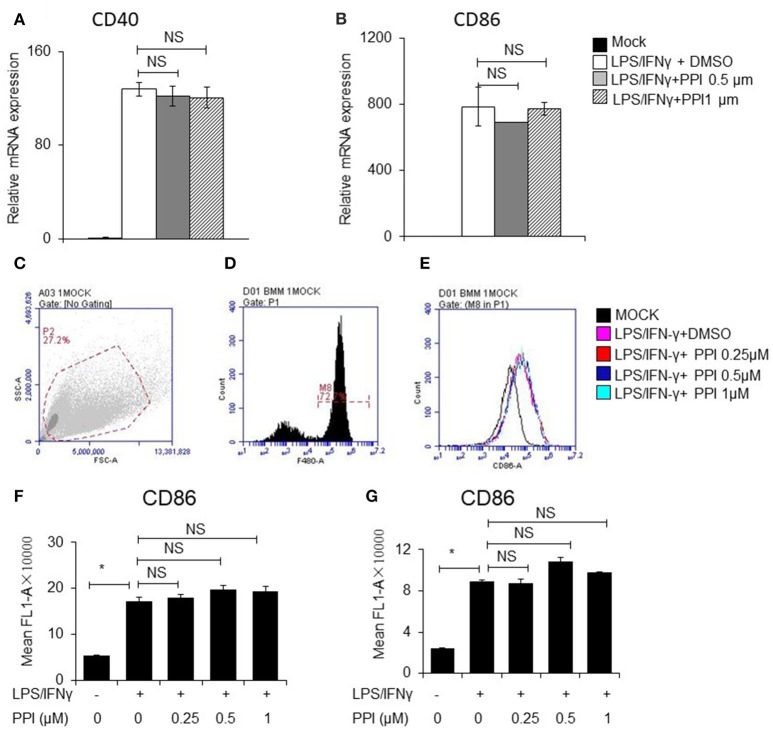
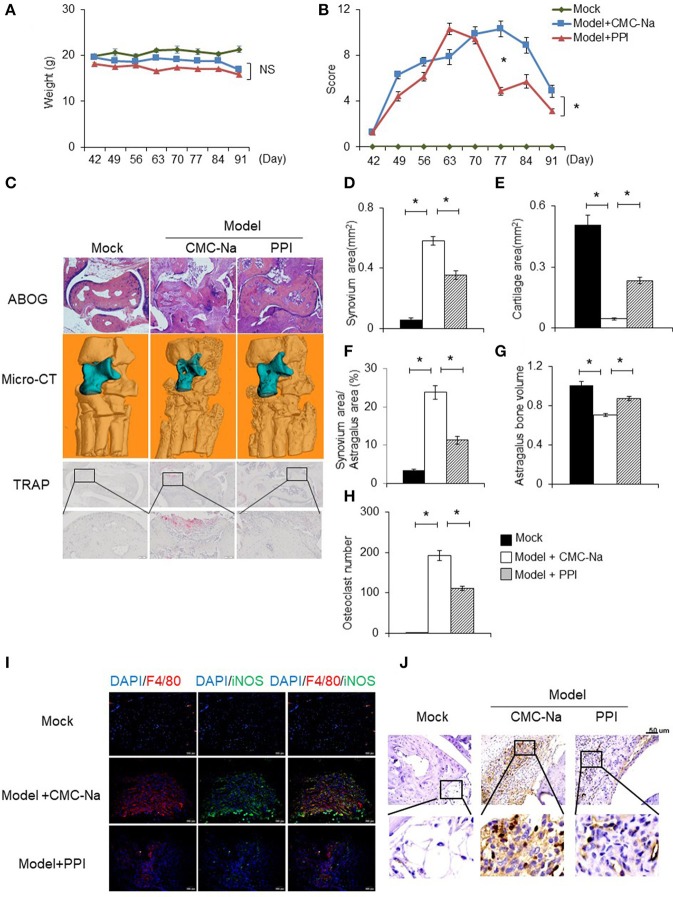
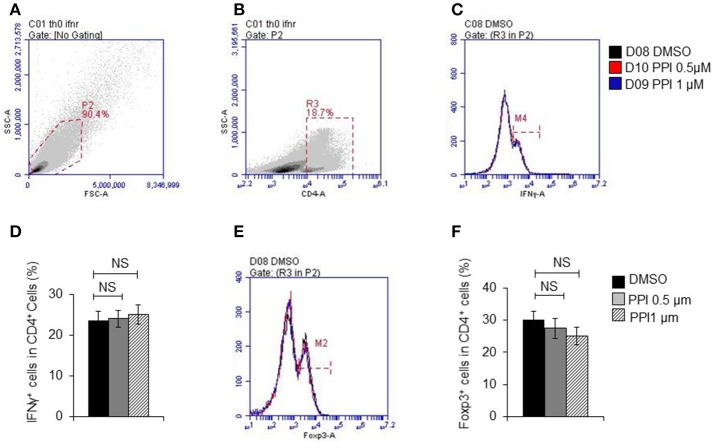
Background: Rheumatoid arthritis (RA) is a chronic autoimmune disorder, characterized by an increased number of M1-like macrophages in the joints. Polyphyllin I (PPI), one of the main components in the Rhizoma of Paris polyphyllin, displays a selective inhibitory effect on various tumor cells. Here we sought to investigate the anti-rheumatoid arthritis effects and mechanisms of PPI on macrophages in vivo and in vitro. Materials and Methods:In vitro, primary bone marrow-derived macrophages (BMMs) and peritoneal elucidated macrophages (PEMs) were stimulated by lipopolysaccharide (LPS) and Interferon (IFN)-γ and then treated with PPI. We determined the degree of activation of IKKα/β and p65, two key mediators of the NF-κB-mediated inflammatory pathway, by measuring their phosphorylated forms by Western blot. The p65 nuclear localization was detected by immunofluorescent staining. Further, a NF-κB-linked luciferase reporter plasmid, as well as those expressing key mediators of the Toll-like receptor 4 pathway, such as myeloid differentiation primary response 88 (MYD88), interleukin-1 receptor (IL-1R) associated kinase (IRAK)-1, TNF receptor associated factors (TRAF)-6, Transforming growth factor-b-activated kinase 1 (TAK1) and p65, were used to identify the mechanism by which PPI achieves its inhibitory effects on macrophage-mediated inflammation. Moreover, a NF-κB inhibitor, p65-targeted siRNAs, and a p65 plasmid were further used to validate the anti-inflammatory mechanism of PPI. In vivo, PPI (1 mg/kg) was administered intragastrically one time a day for 7 weeks starting on the 42nd day after the first immunization with collagen in a collagen-induced arthritis (CIA) mouse model. Micro-computed Tomography scanning, histological examination, F4/80 and iNOS double immunofluorescent staining and CD4 immunohistochemical staining were performed to determine the effect of PPI treatment on joint structure and inflammation in this model. Results: PPI reduced the inflammatory cytokines production of PEMs stimulated by LPS/IFN-γ, inhibited the phosphorylation of IKKα/β and p65, and prevented p65 nuclear localization. The NF-κB luciferase assay showed that the target of PPI was closely related to the NF-κB pathway. Moreover, NF-κB inhibition, siRNA-mediated knockdown of p65, and p65 overexpression eliminated PPI's inhibitory effect. In addition, PPI attenuated the bone erosion and synovitis, as well as M1-like macrophage and T cell infiltration, in the ankle joint of the CIA model. Conclusion: PPI demonstrated effective amelioration of synovial inflammation in the ankle joint of CIA mice while suppressing NF-κB-mediated production of pro-inflammatory effectors in activated macrophages.

Keywords: NF-κB; collagen-induced arthritis; inflammation; polyphyllin I; primary macrophages.


Figures

Figure 1
Figure 1
Polyphyllin I does not affect apoptosis or proliferation of macrophages. (A) Chemical structure of Polyphyllin I (PPI) (CAS: 50773-41-6). (B–E) Cell apoptosis of PEMs and BMMs treated with PPI (1 μM) or the same volume DMSO determined by FITC-conjugated anti-Annexin V antibody and PE-propidium (PI) followed by flow cytometry. Data represent mean ± SEM of three pooled experiments. NS, P > 0.05, Student's t-test. (F) Cell growth of PEMs and BMMs treated with PPI (1 μM) or the same volume DMSO determined by CKK8 assay. Data represent mean ± SEM of four pooled experiments. NS, P > 0.05, Student's t-test. (G) Cell viability of Raw 264.7 cells treated with PPI (1 μM) or the same volume DMSO determined by CellTiter-Glo. Data represent mean ± SEM of four pooled experiments. NS, P > 0.05, Student's t-test.
Figure 2
Figure 2
PPI ameliorated the inflammatory cytokines production of BMMs stimulated by LPS/IFN-γ. (A–D) IL-1β, IL-6, TNF-α, and NOS2 mRNA expression of BMMs stimulated with LPS (1 μg/ml) /IFN-γ (100 ng/ml) for 6 h in the presence of PPI (0, 0.5, or 1 μM) pretreated for 3 h. Representative data of at least 3 mice. Data represent mean ± SEM. NS, P > 0.05, *P < 0.05, One-way analysis of variance (ANOVA). (E–H) ELISA in the supernatants of BMMs stimulated with LPS/ IFN-γ for 6 h (IL-1β, IL-6, and TNF-α) and 24 h (NO) in the presence of PPI (0.25, 0.5, or 1 μM) pretreated for 3 h. Data represents mean ± SEM of four pooled experiments. NS, P > 0.05, *P < 0.05, One-way ANOVA.
Figure 3
Figure 3
PPI ameliorated the phosphorylation of IKKα/β and p65, and p65 nuclear accumulation, without any effect on MAPK signaling under the stimulation of LPS/IFN-γ. (A) Immunoblots for phosphorylation of IKKα/β, p65, JNK, ERK, p38, and the protein level of GAPDH in cell lysates of BMMs stimulated with LPS (1 μg/ml)/IFN-γ (100 ng/ml) for 15, 30, and 60 min in the presence of PPI (1μM) or the same volume DMSO pretreated for 3 h. Blot is representative of three independent experiments. The normalized density of was shown on the right. Data represent mean ± SEM of three pooled experiments. *P < 0.05, two-way ANOVA. (B, C) PEMs were unstimulated or stimulated with LPS (1 μg/ml) /IFN-γ (100 ng/ml) for 15, 30, and 60 min in the presence or absence of PPI pretreatment for 3 h. The cells were stained with anti-p65 (in red) and Hoechst (in blue). Representative 100 × images. More than 300 cells from each sample were measured. The values are the mean ± SEM. The experiment was repeated at least three times. *P < 0.05, two-way ANOVA.
Figure 4
Figure 4
PPI inhibited NF-κB luciferase activity. (A) NF-κB and Renilla luciferase plasmid were co-transfected into 293T cells. 8 h later, the cells were incubated with different doses of PPI (0, 0.25, 0.5, 1 μM) for 3 h, then treated with human TNF-α (20 ng/ml) for another 15 h, and the NF-κB and Renilla luciferase was detected by using Dual Luciferase® Reporter Gene Aassy Kit. Data represent mean ± SEM of three pooled experiments. *P < 0.05, one-way ANOVA. (B–F) The 293T cells, after transfection with MYD88, IRAK1, TRAF6, TAK1 or vector plasmids together with the NF-κB luciferase and Renilla plasmid for 8 h, was cultured with PPI (1 μM) for another 24 h, and the double luciferase was detected. Data represent mean ± SEM of three pooled experiments. NS, P > 0.05, *P < 0.05, one-way ANOVA. (G) Diagram illustrating the inhibitory effect of PPI on the TLR4 pathway.
Figure 5
Figure 5
NF-κB inhibitor, p65 siRNAs and overexpression of p65 abolishes the inhibitory effect of PPI. (A–C) IL-1β, IL-6, and NOS2 mRNA expression of BMMs were treated with the NF-κB inhibitor BAY117082 (5μM) and PPI (1 μM) for 3 h and LPS/IFN-γ for another 6 h. Data represent mean ± SEM of three pooled experiments. NS, P > 0.05, *P < 0.05, one-way ANOVA. (D–F) IL-1β, IL-6, and NOS2 mRNA expression of PEMs transfected with siP65#1 and siP65#2 for 60 h, then with PPI (1 μM) or the same volume DMSO for 3h, LPS/IFN-γ for another 6 h. Data represent mean ± SEM of three pooled experiments. NS, P > 0.05, *P < 0.05, one-way ANOVA. (G) Immunoblots for p65 of PEMs transfected with siP65 for 60 h. Blot is representative of three independent experiments. (H) The density of p65 was normalized against β-actin. Data represent mean ± SEM of three pooled experiments, *P < 0.05, one-way ANOVA. (I–K) 293T cells were transfected with p65 plasmid for 36h, following PPI (1μM) for 3h and E.coli (5 × 10⁷ CFU/ml) for another 6 h, immunoblots for p65, and CCL5, and CXCL10 mRNA expression were determined by qPCR. Blot is representative of three independent experiments. Data represent mean ± SEM of three pooled experiments. *P < 0.05, NS, P > 0.05, one-way ANOVA.
Figure 6
Figure 6
PPI did not affect CD40 and CD86 expression triggered by LPS/IFN-γ, which does not require NFκB activation. (A, B) CD40 and CD86 mRNA expression of BMMs was pretreated with PPI (0.25, 0.5, or 1 μM) or the same volume DMSO for 3 h, then stimulated with LPS (1 μg/ml) /IFN-γ (100 ng/ml) for another 6 h. Data represent mean ± SEM. NS, P > 0.05, one-way ANOVA. (C–G) BMMs or PEMs were pretreated with PPI (0.25, 0.5, or 1 μM) or the same volume DMSO for 3 h, then treated with LPS (1μg/ml)/IFN-γ (100ng/ml) for another 24 h, CD86 level were examined by flow cytometry. Data represent mean ± SEM. NS, P > 0.05, *P < 0.05, one-way ANOVA.
Figure 7
Figure 7
PPI attenuated collagen induced rheumatoid arthritis and protected bone erosion. CIA mice were treated intragastrically with CMC-Na with or without PPI (10 μg/kg) daily from day 42 after immunization to day 91. All mice were sacrificed on day 91. (A, B) The weight and arthritis swelling severity scores in CIA mice were recorded weekly from day 42 to day 91 after immunization. Data represent mean ± SEM of two pooled experiments, n = 4 for Mock, n = 7 for Model+CMC-Na and n = 7 for Model+PPI group. NS, P > 0.05, *P < 0.05, two-way ANOVA. (C) Representive images of ABOG-staining (4×), micro computed tomography three–dimensional and TRAP staining images (4×) of ankle joints. In micro computed tomography three–dimensional ankle joints, the blue part indicates astragalus, n = 4 for Mock, n = 7 for Model+CMC-Na and n = 6 for Model+PPI group. (D–H) Synovial area in the ankle joint, the cartilage area of the astragalus, the synovial area/astragalus area and astragalus bone volume, and osteoclasts number of the joint were calculated. Data represent mean ± SEM of two pooled experiments, n = 4 for Mock, n = 7 for Model+CMC-Na and 6 for Model+PPI group. *P < 0.05, one-way ANOVA. (I) Double immunofluorescence staining with anti-F4/80 (red) and anti-iNOS (green) antibodies at ankle sections show that decreased activated macrophages (double positive of F4/80 and iNOS) in the synovium of PPI-treated ankle joints, representative images (20×) from the Mock group (n = 4), the Model+CMC-Na (n = 7) and the Model+PPI group (n = 6). (J) Representative images of immunohistochemical staining with anti-CD3 antibody in the synovium around astragalus, bar indicates 50 μm, n = 4 for Mock, n = 7 for Model+CMC-Na and n = 6 for Model+PPI group.
Figure 8
Figure 8
PPI did not show effect on T cell differentiation in vitro. (A) Representative images of initial gate of whole spleen cells population. (B) Representative images of CD4 positive cells. (C) IFNγ positive cells in CD4 positive cells. (D) Percentage of IFNγ positive cells in CD4 positive cells from 4 mice, (E) Foxp3 positive cells in CD4 positive cells. (F) Percentage of Foxp3 positive cells in CD4 positive cells from 4 mice. Data represent mean ± SEM. NS, P > 0.05, one-way ANOVA.
Figure 9
Figure 9
PPI did not show any damage effect on liver and kidney of CIA and normal mice. (A) The hematoxylin-eosin (H&E) staining of kidney and liver of CIA mice treated by CMC-Na with or without PPI (4×). (B, C) Serum aspartate aminotransferase (AST) and alanine aminotransferase (ALT). (D) The ratio of ALT/AST. (E, F) Serum creatinine (CRE) and blood urea nitrogen (UREA) were detected by CRE reagent kit or UREA reagent kit. (B–F) Data represent mean ± SEM of two pooled experiments, n = 4 for Mock, n = 7 for Model+CMC-Na and n = 6 for Model+PPI group. NS, P > 0.05, one-way ANOVA. (G) H&E staining of the kidney and liver of normal mice treated with CMC-Na with or without PPI for 7 weeks (4×). (H–L) Serum level of AST, ALT, ALT/AST, UREA, and CRE of normal mice treated by CMC-Na with or without PPI. Data represent mean ± SEM of one pooled experiments. n = 5 for the CMC-Na and n = 5 for the PPI group, NS, P > 0.05, *P < 0.05, Student's t-test.

Similar articles

Cited by

References

    1. Hinks A, Eyre S, Ke X, Barton A, Martin P, Flynn E, et al. . Overlap of disease susceptibility loci for rheumatoid arthritis and juvenile idiopathic arthritis. Ann Rheum Dis. (2010) 69:1049–53. 10.1136/ard.2009.110650 - DOI - PMC - PubMed
    1. Reynolds G, Gibbon JR, Pratt AG, Wood MJ, Coady D, Raftery G, et al. . Synovial CD4+ T-cell-derived GM-CSF supports the differentiation of an inflammatory dendritic cell population in rheumatoid arthritis. Ann Rheum Dis. (2016) 75:899–907. 10.1136/annrheumdis-2014-206578 - DOI - PMC - PubMed
    1. Choi S, You S, Kim D, Choi SY, Kwon HM, Kim HS, et al. . Transcription factor NFAT5 promotes macrophage survival in rheumatoid arthritis. J Clin Invest. (2017) 127:954–69. 10.1172/JCI87880 - DOI - PMC - PubMed
    1. Yeo L, Adlard N, Biehl M, Juarez M, Smallie T, Snow M, et al. . Expression of chemokines CXCL4 and CXCL7 by synovial macrophages defines an early stage of rheumatoid arthritis. Ann Rheum Dis. (2016) 75:763–71. 10.1136/annrheumdis-2014-206921 - DOI - PMC - PubMed
    1. Tak PP, Smeets TJ, Daha MR, Kluin PM, Meijers KA, Brand R, et al. . Analysis of the synovial cell infiltrate in early rheumatoid synovial tissue in relation to local disease activity. Arthritis Rheum. (1997) 40:217–25. 10.1002/art.1780400206 - DOI - PubMed

Publication types

MeSH terms