

Compositional and Temporal Changes in the Gut Microbiome of Pediatric Ulcerative Colitis Patients Are Linked to Disease Course
- PMID: 30308161
- PMCID: PMC6277984
- DOI: 10.1016/j.chom.2018.09.009
Compositional and Temporal Changes in the Gut Microbiome of Pediatric Ulcerative Colitis Patients Are Linked to Disease Course
Abstract
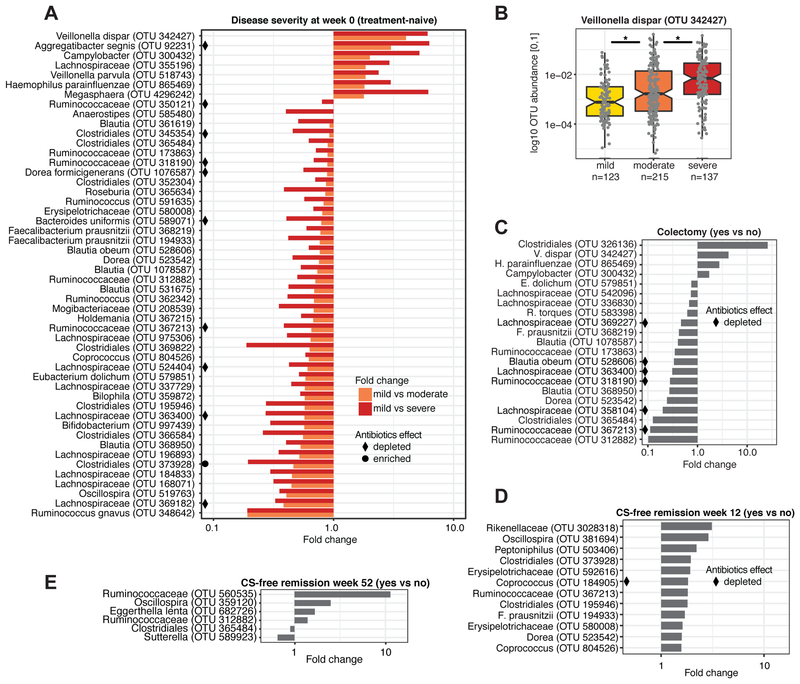
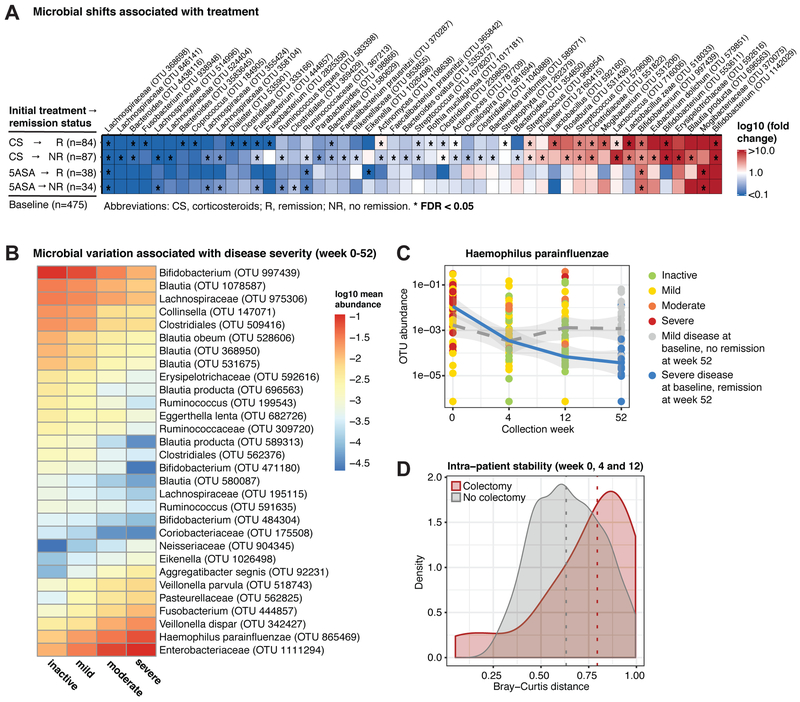
Evaluating progression risk and determining optimal therapy for ulcerative colitis (UC) is challenging as many patients exhibit incomplete responses to treatment. As part of the PROTECT (Predicting Response to Standardized Colitis Therapy) Study, we evaluated the role of the gut microbiome in disease course for 405 pediatric, new-onset, treatment-naive UC patients. Patients were monitored for 1 year upon treatment initiation, and microbial taxonomic composition was analyzed from fecal samples and rectal biopsies. Depletion of core gut microbes and expansion of bacteria typical of the oral cavity were associated with baseline disease severity. Remission and refractory disease were linked to species-specific temporal changes that may be implicative of therapy efficacy, and a pronounced increase in microbiome variability was observed prior to colectomy. Finally, microbial associations with disease-associated serological markers suggest host-microbial interactions in UC. These insights will help improve existing treatments and develop therapeutic approaches guiding optimal medical care.
Keywords: 5ASA; colectomy; corticosteroids; disease course; gut microbiome; host-microbial interactions; pediatric ulcerative colitis; response to therapy; serological markers; treatment-naive.
Copyright © 2018 Elsevier Inc. All rights reserved.
Figures


Similar articles
-
Factors associated with early outcomes following standardised therapy in children with ulcerative colitis (PROTECT): a multicentre inception cohort study.Lancet Gastroenterol Hepatol. 2017 Dec;2(12):855-868. doi: 10.1016/S2468-1253(17)30252-2. Epub 2017 Sep 20. Lancet Gastroenterol Hepatol. 2017. PMID: 28939374 Free PMC article.
-
Dysbiosis, inflammation, and response to treatment: a longitudinal study of pediatric subjects with newly diagnosed inflammatory bowel disease.Genome Med. 2016 Jul 13;8(1):75. doi: 10.1186/s13073-016-0331-y. Genome Med. 2016. PMID: 27412252 Free PMC article.
-
Clinical and biological predictors of response to standardised paediatric colitis therapy (PROTECT): a multicentre inception cohort study.Lancet. 2019 Apr 27;393(10182):1708-1720. doi: 10.1016/S0140-6736(18)32592-3. Epub 2019 Mar 29. Lancet. 2019. PMID: 30935734 Free PMC article. Clinical Trial.
-
E-health: Web-guided therapy and disease self-management in ulcerative colitis. Impact on disease outcome, quality of life and compliance.Dan Med J. 2012 Jul;59(7):B4478. Dan Med J. 2012. PMID: 22759851 Review.
-
Pediatric ulcerative colitis: a practical guide to management.Paediatr Drugs. 2014 Jun;16(3):189-98. doi: 10.1007/s40272-014-0070-8. Paediatr Drugs. 2014. PMID: 24723200 Review.
Cited by
-
MiRKAT-MC: A Distance-Based Microbiome Kernel Association Test With Multi-Categorical Outcomes.Front Genet. 2022 Apr 1;13:841764. doi: 10.3389/fgene.2022.841764. eCollection 2022. Front Genet. 2022. PMID: 35432465 Free PMC article.
-
Fecal microbiota transplantation for ulcerative colitis: a prospective clinical study.BMC Gastroenterol. 2019 Jul 4;19(1):116. doi: 10.1186/s12876-019-1010-4. BMC Gastroenterol. 2019. PMID: 31272391 Free PMC article.
-
Weighted Gene Co-Expression Network Analysis Identifies a Functional Guild and Metabolite Cluster Mediating the Relationship between Mucosal Inflammation and Adherence to the Mediterranean Diet in Ulcerative Colitis.Int J Mol Sci. 2023 Apr 15;24(8):7323. doi: 10.3390/ijms24087323. Int J Mol Sci. 2023. PMID: 37108484 Free PMC article.
-
Our Microbiome: On the Challenges, Promises, and Hype.Results Probl Cell Differ. 2020;69:539-557. doi: 10.1007/978-3-030-51849-3_20. Results Probl Cell Differ. 2020. PMID: 33263886
-
Impact of gut Microbiome alteration in Ulcerative Colitis patients on disease severity and outcome.Clin Exp Med. 2023 Sep;23(5):1763-1772. doi: 10.1007/s10238-022-00917-x. Epub 2022 Nov 7. Clin Exp Med. 2023. PMID: 36344781 Free PMC article.
References
-
- Atarashi K, Tanoue T, Oshima K, Suda W, Nagano Y, Nishikawa H, Fukuda S, Saito T, Narushima S, Hase K, et al. (2013). Treg induction by a rationally selected mixture of Clostridia strains from the human microbiota. Nature, 500, 232–6. - PubMed
-
- Bousvaros A, Antonioli DA, Colletti RB, Dubinsky MC, Glickman JN, Gold BD, Griffiths AM, Jevon GP, Higuchi LM, Hyams JS, et al. (2007). Differentiating ulcerative colitis from Crohn disease in children and young adults: report of a working group of the North American Society for Pediatric Gastroenterology, Hepatology, and Nutrition and the Crohn's and Colitis Foundation of America. J Pediatr Gastroenterol Nutr, 44, 653–74. - PubMed
Publication types
MeSH terms
Substances
Supplementary concepts
Grants and funding
LinkOut - more resources
Full Text Sources
Other Literature Sources
Medical
Molecular Biology Databases
Research Materials
