. 2018 Oct;562(7727):367-372.
doi: 10.1038/s41586-018-0590-4. Epub 2018 Oct 3.

Single-cell transcriptomics of 20 mouse organs creates a Tabula Muris

Collaborators

Single-cell transcriptomics of 20 mouse organs creates a Tabula Muris

Tabula Muris Consortium et al. Nature. 2018 Oct.

Abstract

Here we present a compendium of single-cell transcriptomic data from the model organism Mus musculus that comprises more than 100,000 cells from 20 organs and tissues. These data represent a new resource for cell biology, reveal gene expression in poorly characterized cell populations and enable the direct and controlled comparison of gene expression in cell types that are shared between tissues, such as T lymphocytes and endothelial cells from different anatomical locations. Two distinct technical approaches were used for most organs: one approach, microfluidic droplet-based 3'-end counting, enabled the survey of thousands of cells at relatively low coverage, whereas the other, full-length transcript analysis based on fluorescence-activated cell sorting, enabled the characterization of cell types with high sensitivity and coverage. The cumulative data provide the foundation for an atlas of transcriptomic cell biology.


Figures
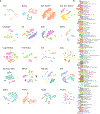
Extended Data Figure 1.
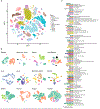
The number and type of FACS cells composing each organ. a) Cells for each organ visualized with tSNE, colored by cell type. Cell types were determined by differential gene expression of known markers between clusters. b) Barplots quantifying the number of each annotated cell type. Cell type colors match their respective tSNE plot.
Extended Data Figure 2.
The number and type of microfluidic cells composing each organ. a) tSNE plot of all cells collected by microfluidic droplet, colored by organ, overlaid with the predominant cell type composing each cluster. b) Cells for each organ visualized with tSNE, colored by cell type. Cell types were determined by differential gene expression of known markers between clusters. c) Barplots quantifying the number of each annotated cell type. Cell type colors match their respective tSNE plot.
Extended Data Figure 3.
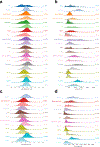
The number of reads, UMIs, and genes detected per cell for each organ. Histogram for each organ of the number of a) reads per cell (FACS), and c) unique molecular identifiers (UMIs) per cell (microfluidic droplet). Histogram of the number of genes detected per cell for each organ from b) FACS, and d) microfluidic droplet.
Extended Data Figure 4.
Graphical representation of cell ontology class representation. a) FACS and b) microfluidic droplet datasets, colored by the relative amount of each cell type in each dataset.
Extended Data Figure 4.
Graphical representation of cell ontology class representation. a) FACS and b) microfluidic droplet datasets, colored by the relative amount of each cell type in each dataset.
Extended Data Figure 5.
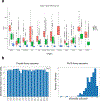
Methodological comparison of detected genes and library saturation. a) The number of genes detected (threshold of > 0 reads or UMIs per cell) by FACS (red; n= 21,105 individual cells), microfluidic droplets (green; n = 55,032 individual cells), and microwell-Seq (blue; n= 25,891 individual cells) (Han et al.). b) Library saturation fraction for all microfluidic droplet libraries. Dotted horizontal line demarcates the median saturation (~ 0.9). c) Library saturation for all FACS libraries. Saturation was calculated using the number of detected genes while downsampling the number of reads per library. Please refer to Supplementary Table 6 for summary statistics.
Extended Data Figure 6.
The number of detected genes decreases similarly across organs as the read or UMI threshold is increased. Fraction of all detected genes (defined as > 0 reads or UMIs) for each cell, across all organs, detected at increasing read or UMI thresholds for FACS (left; n= 44,949 individual cells), microfluidic droplet (middle; n= 55,656 individual cells), and microwell-Seq (right; n= 28,372 individual cells). Please refer to Supplementary Table 6 for summary statistics.
Extended Data Figure 7.
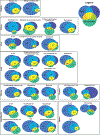
The number of differentially expressed genes for each cell type common between methods. Venn diagrams showing the overlap between differentially expressed genes for each common cell type across three methods (FACS, microfluidic droplet, microwell-Seq). Plotted data are provided in tabular form in Supplementary Table 2.
Extended Data Figure 8.
tSNE visualization of all FACS cells by cluster ID; n = 44,949 individual cells. Clusters are discussed in the text and further analyzed in Figure 3.
Extended Data Figure 9.
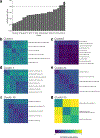
Metrics of cluster heterogeneity. a) Barplot showing the heterogeneity score for each cluster containing multiple cell types. b-f) Heatmaps showing the average between-cell-type distances within select clusters, normalized so average distance between pairs of FACS cells is 1, clipped to a max of 1, for clusters a) 1, b) 2, c) 3, d) 24, e) 48, f) 53.
Extended Data Figure 10.
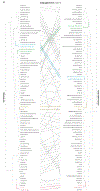
Transcription factor contribution to cell identity. a) Tanglegram contrasting the dendrogram obtained using all expressed genes with one obtained using only the expression of TFs. The solid lines indicated segments that did not change position during the alignment between the two trees, while the dotted lines correspond to dendrogram branches re-ordered during the entanglement calculations. The colors indicate the branches for which the leaves are identical in both dendrograms. b-e) tSNE visualization of b) epithelial, c) endothelial, d) B-, e) T-cells colored by organ. f-i) tSNE visualization of b) epithelial, c) endothelial, d) B-, e) T-cell expression of select TFs (grey/low to red/high). In b-i) n = 60 randomly selected cells for each cell type
Extended Data Figure 11.
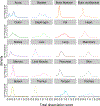
Dissociation-induced gene expression scores for each organ analyzed with FACS. The dissociation score for each organ represents the magnitude of the first principal component of the 140 dissociation-associated genes from Van Der Brink et al. The y-axis shows probability density of the normalized histogram.
Figure 1.
Figure 1.
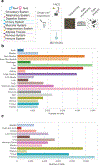
Overview of Tabula Muris. a) 20 organs from 4 male and 3 female mice were analyzed. After dissociation, cells were sorted by FACS and captured in microfluidic oil droplets for some organs. Cells were lysed, transcriptomes amplified and sequenced, reads mapped, and data analyzed. b) Barplot showing the number of sequenced cells prepared by FACS from each organ (n = 20 organ types). c) Barplot showing the number of sequenced cells prepared by microfluidic droplets from each organ (n = 12 organ types).
Figure 2.
Figure 2.. tSNE visualization of all FACS cells.
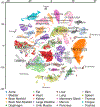
tSNE plot of all cells collected by FACS, colored by organ, overlaid with the predominant cell type composing each cluster; n = 44,949 individual cells.
Figure 3.
Figure 3.. Comparison of cell type determination.
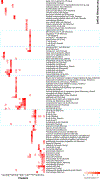
Comparison of cell type determination as done by unbiased whole transcriptome comparison versus manual annotation of clusters by organ-specific experts. The x-axis represents clusters from Figure 2 with multiple organs contributing, while the y-axis represents manual expert annotation of clusters in an organ-specific fashion (Extended Data Fig. 1). The unbiased method discovers relationships between similar cell types found in different organs (highlighted regions); in particular it groups T cells from different organs into a single cluster, B cells from different organs into a different single cluster, and endothelial cells from different organs into a single cluster.
Figure 4.
Figure 4.. Analysis of all sorted T-cells.
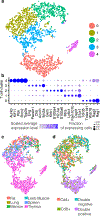
a) tSNE plot of all T cells colored by cluster membership; n = 2847 individual cells. Five clusters were identified. b) Dotplot showing level of expression (color scale) and number of expressing cells (point diameter) within each cluster of T cells. c) tSNE plot of all T cells colored by organ of origin (Fat, Lung, Marrow, Limb Muscle, Spleen or Thymus); n = 2847 individual cells. d) tSNE plot of all T cells colored by classification of T cells to 4 categories based on expression of Cd4 and Cd8 (Cd4+/ Cd8+/ Cd4+Cd8+ / Cd4-Cd8-); n = 2847 individual cells.
Figure 5.
Figure 5.. Transcription factor (TF) analysis.
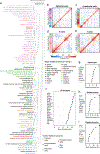
a) Dendrogram of cell types constructed with only TFs. b-e) Correlograms of top organ-specific TFs for epithelial (b), endothelial (c), B- (d) and T- (e) cells. Row colors correspond to the organ of the most-enriched cell type; n=60 randomly selected cells for each cell type f) Top 20 TFs (mean Gini importance) of the random forest model when classifying all cell types. g-i) Top 10 TFs (mean Gini importance) of the random forest model when classifying each

Comment in

  • Navigating mouse cell types.
    Burgess DJ. Burgess DJ. Nat Rev Genet. 2018 Dec;19(12):739. doi: 10.1038/s41576-018-0067-1. Nat Rev Genet. 2018. PMID: 30341441 No abstract available.
  • Cell portrait of a mouse.
    Nawy T. Nawy T. Nat Methods. 2018 Dec;15(12):1001. doi: 10.1038/s41592-018-0247-0. Nat Methods. 2018. PMID: 30504881 No abstract available.

Similar articles

  • A single-cell transcriptomic atlas characterizes ageing tissues in the mouse.
    Tabula Muris Consortium. Tabula Muris Consortium. Nature. 2020 Jul;583(7817):590-595. doi: 10.1038/s41586-020-2496-1. Epub 2020 Jul 15. Nature. 2020. PMID: 32669714 Free PMC article.
  • The Tabula Sapiens: A multiple-organ, single-cell transcriptomic atlas of humans.
    Tabula Sapiens Consortium*; Jones RC, Karkanias J, Krasnow MA, Pisco AO, Quake SR, Salzman J, Yosef N, Bulthaup B, Brown P, Harper W, Hemenez M, Ponnusamy R, Salehi A, Sanagavarapu BA, Spallino E, Aaron KA, Concepcion W, Gardner JM, Kelly B, Neidlinger N, Wang Z, Crasta S, Kolluru S, Morri M, Tan SY, Travaglini KJ, Xu C, Alcántara-Hernández M, Almanzar N, Antony J, Beyersdorf B, Burhan D, Calcuttawala K, Carter MM, Chan CKF, Chang CA, Chang S, Colville A, Culver RN, Cvijović I, D'Amato G, Ezran C, Galdos FX, Gillich A, Goodyer WR, Hang Y, Hayashi A, Houshdaran S, Huang X, Irwin JC, Jang S, Juanico JV, Kershner AM, Kim S, Kiss B, Kong W, Kumar ME, Kuo AH, Li B, Loeb GB, Lu WJ, Mantri S, Markovic M, McAlpine PL, de Morree A, Mrouj K, Mukherjee S, Muser T, Neuhöfer P, Nguyen TD, Perez K, Puluca N, Qi Z, Rao P, Raquer-McKay H, Schaum N, Scott B, Seddighzadeh B, Segal J, Sen S, Sikandar S, Spencer SP, Steffes LC, Subramaniam VR, Swarup A, Swift M, Van Treuren W, Trimm E, Veizades S, Vijayakumar S, Vo KC, Vorperian SK, Wang W, Weinstein HNW, Winkler J, Wu TTH, Xie J, Yung AR, Zhang Y, Detweiler AM, Mekonen H, Neff NF, Sit RV, Tan M, Yan J, Bean GR, Charu V, Forgó E, Martin BA, Ozawa MG,… See abstract for full author list ➔ Tabula Sapiens Consortium*, et al. Science. 2022 May 13;376(6594):eabl4896. doi: 10.1126/science.abl4896. Epub 2022 May 13. Science. 2022. PMID: 35549404 Free PMC article.
  • Ageing hallmarks exhibit organ-specific temporal signatures.
    Schaum N, Lehallier B, Hahn O, Pálovics R, Hosseinzadeh S, Lee SE, Sit R, Lee DP, Losada PM, Zardeneta ME, Fehlmann T, Webber JT, McGeever A, Calcuttawala K, Zhang H, Berdnik D, Mathur V, Tan W, Zee A, Tan M; Tabula Muris Consortium; Pisco AO, Karkanias J, Neff NF, Keller A, Darmanis S, Quake SR, Wyss-Coray T. Schaum N, et al. Nature. 2020 Jul;583(7817):596-602. doi: 10.1038/s41586-020-2499-y. Epub 2020 Jul 15. Nature. 2020. PMID: 32669715 Free PMC article.
  • Microfluidic single-cell transcriptomics: moving towards multimodal and spatiotemporal omics.
    Lin S, Liu Y, Zhang M, Xu X, Chen Y, Zhang H, Yang C. Lin S, et al. Lab Chip. 2021 Oct 12;21(20):3829-3849. doi: 10.1039/d1lc00607j. Lab Chip. 2021. PMID: 34541590 Review.
  • A primer for generating and using transcriptome data and gene sets.
    Cockrum C, Kaneshiro KR, Rechtsteiner A, Tabuchi TM, Strome S. Cockrum C, et al. Development. 2020 Dec 23;147(24):dev193854. doi: 10.1242/dev.193854. Development. 2020. PMID: 33361089 Free PMC article. Review.

Cited by

References

    1. Alberts B et al. Essential Cell Biology. (Garland Pub, 2014).
    1. Guo G et al. Resolution of cell fate decisions revealed by single-cell gene expression analysis from zygote to blastocyst. Dev. Cell 18, 675–685 (2010). - PubMed
    1. Dalerba P et al. Single-cell dissection of transcriptional heterogeneity in human colon tumors. Nat. Biotechnol. 29, 1120–1127 (2011). - PMC - PubMed
    1. Thorsen T, Roberts RW, Arnold FH & Quake SR Dynamic pattern formation in a vesicle-generating microfluidic device. Phys. Rev. Lett. 86, 4163–4166 (2001). - PubMed
    1. Macosko EZ et al. Highly parallel genome-wide expression profiling of individual cells using nanoliter droplets. Cell 161, 1202–1214 (2015). - PMC - PubMed

Publication types

Substances