The Synergy of Aging and LPS Exposure in a Mouse Model of Parkinson's Disease
- PMID: 30271656
- PMCID: PMC6147589
- DOI: 10.14336/AD.2017.1028
The Synergy of Aging and LPS Exposure in a Mouse Model of Parkinson's Disease
Abstract
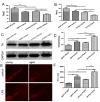
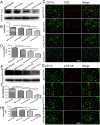
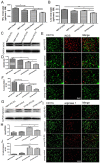
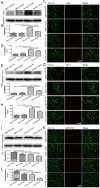
Aging is an inevitable physiological challenge occurring in organisms over time, and is also the most important risk factor of neurodegenerative diseases. In this study, we observed cellular and molecular changes of different age mice and LPS-induced Parkinson disease (PD) model. The results showed that behavioral performance and dopaminergic (DA) neurons were declined, accompanied by increased expression of pro-inflammatory factors (TLR2, p-NF-kB-p65, IL-1β and TNF-α), as well as pro-oxidative stress factor gp91phox in aged mice compared with young mice. Aging exaggerated inflammatory M1 microglia, and destroyed the balance between oxidation and anti-oxidation. The intranasal LPS instillation induced PD model in both young and aged mice. The poor behavioral performance and the loss of DA neurons as well as TLR2, p-NF-kB-p65, IL-1β, TNF-α, iNOS and gp91phox were further aggravated in LPS-aged mice. Interestingly, the expression of Nrf2 and HO-1 was up-regulated by LPS only in young LPS-PD mice, but not in aged mice. The results indicate that the synergy of aging process and LPS exposure may prominently aggravate the DA neurons loss caused by more serious neuroinflammation and oxidative stress in the brain.
Keywords: Aging; Lipopolysaccharides; Parkinson’s disease; neuroinflammation; oxidative stress.
Figures


Similar articles
-
Galangin Reduces the Loss of Dopaminergic Neurons in an LPS-Evoked Model of Parkinson's Disease in Rats.Int J Mol Sci. 2017 Dec 21;19(1):12. doi: 10.3390/ijms19010012. Int J Mol Sci. 2017. PMID: 29267220 Free PMC article.
-
Aging modulates microglia phenotypes in neuroinflammation of MPTP-PD mice.Exp Gerontol. 2018 Oct 1;111:86-93. doi: 10.1016/j.exger.2018.07.010. Epub 2018 Jul 17. Exp Gerontol. 2018. PMID: 30009921
-
Suppression of neuroinflammation by matrix metalloproteinase-8 inhibitor in aged normal and LRRK2 G2019S Parkinson's disease model mice challenged with lipopolysaccharide.Biochem Biophys Res Commun. 2017 Nov 18;493(2):879-886. doi: 10.1016/j.bbrc.2017.09.129. Epub 2017 Sep 25. Biochem Biophys Res Commun. 2017. PMID: 28958936
-
Tanshinone I selectively suppresses pro-inflammatory genes expression in activated microglia and prevents nigrostriatal dopaminergic neurodegeneration in a mouse model of Parkinson's disease.J Ethnopharmacol. 2015 Apr 22;164:247-55. doi: 10.1016/j.jep.2015.01.042. Epub 2015 Feb 7. J Ethnopharmacol. 2015. PMID: 25666429
-
Prenatal exposure to the bacteriotoxin lipopolysaccharide leads to long-term losses of dopamine neurons in offspring: a potential, new model of Parkinson's disease.Front Biosci. 2003 Sep 1;8:s826-37. doi: 10.2741/1158. Front Biosci. 2003. PMID: 12957870 Review.
Cited by
-
Pre-clinical Studies Identifying Molecular Pathways of Neuroinflammation in Parkinson's Disease: A Systematic Review.Front Aging Neurosci. 2022 Jul 4;14:855776. doi: 10.3389/fnagi.2022.855776. eCollection 2022. Front Aging Neurosci. 2022. PMID: 35912090 Free PMC article.
-
Lipopolysaccharide animal models of Parkinson's disease: Recent progress and relevance to clinical disease.Brain Behav Immun Health. 2020 Mar 18;4:100060. doi: 10.1016/j.bbih.2020.100060. eCollection 2020 Apr. Brain Behav Immun Health. 2020. PMID: 34589845 Free PMC article. Review.
-
Integrating Network Pharmacology, Transcriptomics to Reveal Neuroprotective of Curcumin Activate PI3K / AKT Pathway in Parkinson's Disease.Drug Des Devel Ther. 2024 Jul 9;18:2869-2881. doi: 10.2147/DDDT.S462333. eCollection 2024. Drug Des Devel Ther. 2024. PMID: 39006191 Free PMC article.
-
Relationship among α‑synuclein, aging and inflammation in Parkinson's disease (Review).Exp Ther Med. 2023 Nov 21;27(1):23. doi: 10.3892/etm.2023.12311. eCollection 2024 Jan. Exp Ther Med. 2023. PMID: 38125364 Free PMC article. Review.
-
Nutritional Modulation of Immune and Central Nervous System Homeostasis: The Role of Diet in Development of Neuroinflammation and Neurological Disease.Nutrients. 2019 May 15;11(5):1076. doi: 10.3390/nu11051076. Nutrients. 2019. PMID: 31096592 Free PMC article. Review.
References
-
- Isobe KI, Cheng Z, Nishio N, Suganya T, Tanaka Y, Ito S (2014). iPSCs, aging and age-related diseases. New biotechnol, 31: 411-421 - PubMed
-
- Wood-Kaczmar A, Gandhi S, Wood NW (2006). Understanding the molecular causes of Parkinson’s disease. Trends Mol Med, 12: 521-528 - PubMed
-
- Lee A, Gilbert RM (2016). Epidemiology of Parkinson Disease. Neurol clin, 34: 955-965 - PubMed
LinkOut - more resources
Full Text Sources
