. 2018 Sep 27;9(1):3958.
doi: 10.1038/s41467-018-06172-7.

AP-4 vesicles contribute to spatial control of autophagy via RUSC-dependent peripheral delivery of ATG9A

Affiliations

AP-4 vesicles contribute to spatial control of autophagy via RUSC-dependent peripheral delivery of ATG9A

Alexandra K Davies et al. Nat Commun. .

Abstract

Adaptor protein 4 (AP-4) is an ancient membrane trafficking complex, whose function has largely remained elusive. In humans, AP-4 deficiency causes a severe neurological disorder of unknown aetiology. We apply unbiased proteomic methods, including 'Dynamic Organellar Maps', to find proteins whose subcellular localisation depends on AP-4. We identify three transmembrane cargo proteins, ATG9A, SERINC1 and SERINC3, and two AP-4 accessory proteins, RUSC1 and RUSC2. We demonstrate that AP-4 deficiency causes missorting of ATG9A in diverse cell types, including patient-derived cells, as well as dysregulation of autophagy. RUSC2 facilitates the transport of AP-4-derived, ATG9A-positive vesicles from the trans-Golgi network to the cell periphery. These vesicles cluster in close association with autophagosomes, suggesting they are the "ATG9A reservoir" required for autophagosome biogenesis. Our study uncovers ATG9A trafficking as a ubiquitous function of the AP-4 pathway. Furthermore, it provides a potential molecular pathomechanism of AP-4 deficiency, through dysregulated spatial control of autophagy.


Conflict of interest statement

The authors declare no competing interests.

Figures
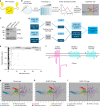
Fig. 1
Fig. 1
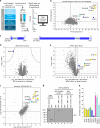
Dynamic Organellar Maps detect mislocalisation of ATG9A, SERINC1 and SERINC3 in AP-4 knockout (KO) HeLa cells. a Diagram of the AP-4 complex. b Workflow for Dynamic Organellar Map generation. Cell lysates are subjected to a series of differential centrifugation steps, to achieve partial separation of organelles. Proteins in each fraction are quantified by mass spectrometry (MS), to obtain abundance distribution profiles. Proteins associated with the same organelle have similar profiles. Clustering can be visualised by principal component analysis (PCA) and compartment assignments are made through support vector machine (SVM)-based classification. c Western blot of whole cell lysates from wild-type, AP4B1 KO and AP4E1 KO HeLa cells; α-Tubulin, loading control. Representative of two independent experiments. d Experimental design for AP-4 Dynamic Organellar Mapping. Maps were made from wild type, AP4B1 KO and AP4E1 KO cell lines, each in duplicate. Profiles from each KO map were subtracted from the cognate control profiles, to obtain two AP4E1 Δmaps, and two AP4B1 Δmaps. Proteins that did not shift had similar profiles in wild-type and AP-4 KO maps, and hence Δ profiles close to zero. To identify significantly translocating proteins, the magnitude of shift (M) and the reproducibility of shift direction (R) were scored for each protein and each Δmap. e MR plot analysis of AP-4 Dynamic Organellar Mapping. 3926 proteins were profiled across all maps. Three proteins whose subcellular localisation was significantly and reproducibly shifted across the AP-4 KO lines were identified with very high confidence (FDR < 1%). The analysis only covered proteins profiled across all maps; since AP-4 itself was not present in the KO maps, it was not included. See also Supplementary Data 1. f Topology of the proteins identified by AP-4 Dynamic Organellar Mapping. gi Visualisation of organellar maps by PCA. Each scatter point represents a protein; proximity indicates similar fractionation profiles. Known organellar marker proteins are shown in colour, and form clusters. Each plot combines the data from two independent map replicates. g wild-type; h AP4B1 KO; i AP4E1 KO. The three proteins that undergo significant shifts in AP-4 KOs are annotated
Fig. 2
Fig. 2
Multiple orthogonal proteomic approaches confirm ATG9A, SERINC1 and SERINC3 as AP-4 cargo proteins and identify RUSC1 and RUSC2 as AP-4 accessory proteins. a Workflow for proteomic vesicle profiling. Vesicle-enriched fractions were prepared in pairs from metabolically (SILAC heavy or light) labelled control and AP-4-depleted cells and compared by quantitative MS. 2848 proteins were quantified across all experiments. b PCA combining the SILAC ratios from nine comparative AP-4-depleted vesicle fraction experiments. Proteins consistently lost from the vesicle fraction of AP-4-depleted cells are in the top-right section. c Domain organisation of RUSC1 and RUSC2. There are additional RUSC1 isoforms, but our MS data identified the isoform shown as predominant in our samples. d Comparison of protein abundance in total membrane fractions prepared from AP-4 KO (AP4B1 and AP4E1, each in triplicate, n = 6) and wild-type HeLa cells (in triplicate, n = 3), analysed by label-free quantitative MS. >6600 proteins were quantified; RUSC1 was the only protein significantly depleted from the membrane fraction of AP-4 KO cells (RUSC2 and AP-4 subunits were not consistently detected). Data were analysed with a two-tailed t-test: volcano lines indicate the significance threshold (FDR = 5%). e Comparison of protein abundance in affinity purifications of biotinylated proteins from HeLa cells stably expressing AP4E1-BirA*, and control cell lines (HeLa, HeLa BirA* and HeLa GFP-BirA*), analysed by label-free quantitative MS and volcano analysis as in d. The experiment was performed in triplicate and the control dataset was compressed to the three highest LFQ intensities per protein. >3100 proteins were quantified; FDR = 5%. f High-sensitivity low-detergent immunoprecipitations from HeLa cells stably expressing the AP-4 associated protein TEPSIN-GFP. The scatter plot shows two replicate SILAC comparisons of TEPSIN-GFP immunoprecipitations versus mock immunoprecipitations (from parental HeLa). TEPSIN-GFP associated proteins have high ratios. g Western blots of GST pulldowns using GST-ε (883–1137), GST-β4 (612–739) or GST, from cytosol from HeLa cells stably expressing GFP-RUSC2, or GFP alone as a control. Input cytosol is also shown. Representative of two independent experiments. h Estimated copy numbers of AP4B1, AP4E1, AP4M1, TEPSIN, RUSC1, RUSC2, ATG9A, SERINC1 and SERINC3, in HeLa cells, from previously published data (means +/- SD; n = 6)
Fig. 3
Fig. 3
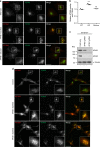
ATG9A accumulates at the trans-Golgi network (TGN) in AP-4 knockout HeLa and SH-SY5Y cells. a Widefield imaging of immunofluorescence double labelling of ATG9A and TGN46 in wild-type (WT), AP4B1 KO, and AP4B1 KO HeLa cells stably expressing AP4B1 (rescue). Scale bar: 20 μm. b Quantification of the ratio of ATG9A labelling intensity between the TGN and the rest of the cell using an automated microscope. Ratios were normalised to the mean wild-type ratio. The experiment was performed in biological triplicate (mean indicated, n = 3), and >1400 cells were scored per cell line in each replicate. Data were subjected to one-way ANOVA with Dunnett’s Multiple Comparison Test for significant differences from the wild-type: ***p ≤ 0.001; ns p > 0.05. c SH-SY5Y (neuroblastoma) cells stably expressing Cas9 were transduced with sgRNAs to AP4B1 or AP4E1. Mixed populations were selected for sgRNA expression and parental Cas9-expressing SH-SY5Y cells were used as a control. Western blot of whole cell lysates; α-Tubulin, loading control. Representative of two independent experiments. d Widefield imaging of immunofluorescence double labelling of ATG9A and TGN46 in control, AP4B1 depleted and AP4E1 depleted SH-SY5Y cells. Scale bar: 20 μm
Fig. 4
Fig. 4
ATG9A mislocalisation is a ubiquitous phenotype in cells from AP-4-deficient patients. a Widefield imaging of fibroblasts from a healthy control individual, patients with homozygous mutations in one of the four AP-4 genes, and an individual with a heterozygous (Het) mutation in AP4E1 (phenotypically normal mother of the AP4E1* patient), labelled with anti-ATG9A and anti-TGN46. In the merged image, DAPI labelling of the nucleus is also shown (blue). Scale bar: 20 µm. b Western blots of whole cell lysates from the cells shown in a; Clathrin heavy chain, loading control. Representative of two independent experiments
Fig. 5
Fig. 5
ATG9A and SERINC colocalisation in peripheral puncta is dependent on AP-4. CRISPR/Cas9 gene editing was used to introduce a C-terminal Clover (modified GFP) tag to endogenous SERINC1 or SERINC3 in HeLa cells. Cells were transfected with siRNA to knock down AP-4, or were mock transfected (without siRNA) as a control. a Confocal microscopy with Airyscanning was used to image SERINC1-Clover (via anti-GFP) and anti-ATG9A. Representative images show a confocal slice of the whole cell, and a peripheral 10 × 10 μm square imaged with Airyscanning in Superresolution mode, used for the quantification of colocalisation between SERINC1-Clover and ATG9A. Scale bar: 10 μm. b Quantification of colocalisation between SERINC1-Clover and ATG9A in peripheral regions of mock treated and AP-4 knockdown (KD) cells, using Thresholded Pearson’s Correlation Coefficient. 20 cells were quantified per condition. Data show mean (n = 20), and results of a two-tailed Mann–Whitney U-test: ***p ≤ 0.001. c Confocal microscopy with Airyscanning was used to image SERINC3-Clover (via anti-GFP) and anti-ATG9A, as in a. d Quantification of colocalisation between SERINC3-Clover and ATG9A in peripheral regions of mock treated and AP-4 knockdown cells, using Thresholded Pearson’s correlation coefficient. 19 cells were quantified per condition. Data show mean (n = 19), and results of a two-tailed Mann–Whitney U-test: ***p ≤ 0.001
Fig. 6
Fig. 6
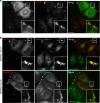
ATG9A-positive and SERINC-positive puncta accumulate at the cell periphery in RUSC2-overexpressing cells. a Widefield imaging of HeLa cells stably expressing GFP-RUSC2, mixed on coverslips with parental HeLa cells (marked with asterisks), labelled with anti-ATG9A. The insets show accumulation of GFP-RUSC2-positive and ATG9A-positive puncta at the periphery of the cell. Scale bar: 20 μm. b Widefield imaging of HeLa cells expressing endogenously tagged SERINC1-Clover or SERINC3-Clover, transiently transfected with HA-RUSC2 and double labelled with anti-GFP and anti-HA. Non-transfected cells are marked with asterisks. The insets show accumulation of HA-RUSC2- and SERINC-positive puncta at the periphery of the cell. Scale bars: 20 μm
Fig. 7
Fig. 7
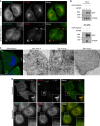
RUSC2-driven accumulation of ATG9A-vesicles at the cell periphery depends on AP-4 and microtubules. a Widefield imaging of AP4B1 knockout (KO) HeLa cells stably expressing GFP-RUSC2, labelled with anti-ATG9A, with or without rescue by transient expression of AP4B1. Scale bar: 20 µm. b Western blots of immunoprecipitates of GFP-RUSC2 from extracts of wild-type or AP4B1 KO HeLa cells stably expressing GFP-RUSC2. Parental wild-type HeLa cells were used as a negative control. Representative of three independent experiments. c Correlative light and electron microscopy (CLEM) of HeLa cells stably expressing GFP-RUSC2. The peripheral GFP-RUSC2 puncta corresponded to accumulations of small uncoated vesicular and tubular structures (electron micrograph (EM) areas a and b), which were not found in peripheral regions negative for GFP-RUSC2 (area c). Scale bars: fluorescence, 10 µm; EM, 500 nm. d Widefield imaging of HeLa cells stably expressing GFP-RUSC2, cultured with or without nocodazole (10 μg mL−1, 2 h), labelled with anti-ATG9A. Insets show how disruption of microtubules with nocodazole resulted in loss of the peripheral localisation of GFP-RUSC2 puncta, but their colocalisation with ATG9A remained. Scale bar: 20 µm
Fig. 8
Fig. 8
Loss of AP-4 or RUSCs in HeLa cells causes dysregulation of autophagy. a Western blots of whole cell lysates from wild-type and AP4E1 KO HeLa cells, cultured in full medium or starved for 1 or 2 h in EBSS, with or without the addition of bafilomycin A1 (Baf A1; 100 nM, 2 h); Clathrin heavy chain, loading control. Representative of two independent experiments. b Western blots of whole cell lysates from AP4B1 KO and AP4B1 KO HeLa cells rescued with stable expression of AP4B1, as described in a. Representative of two independent experiments. c Widefield imaging of wild-type, AP4B1 KO and AP4B1 KO HeLa cells rescued with stable expression of AP4B1, starved for two hours in EBSS, labelled with anti-LC3B. Scale bar: 20 µm. d Quantification of the apparent size (in µm2) of LC3B puncta using an automated microscope. The experiment was performed in biological triplicate (mean indicated, n = 3), and over 500 cells were scored per cell line in each replicate. Data were subjected to one-way ANOVA with Dunnett’s Multiple Comparison Test for significant differences to the wild-type: **p ≤ 0.01; ns p > 0.05. e Quantification by qRT-PCR of RUSC1 mRNA levels in HeLa cells treated with siRNA to knock down RUSC1, RUSC2, or both together, relative to cells transfected with a non-targeting (NT) siRNA. The experiment was performed in biological triplicate (mean indicated; n = 3). f Quantification of RUSC2 mRNA levels in the same cells, as described in e. g Western blots of whole cell lysates from HeLa cells treated with siRNA to knock down RUSC1, RUSC2, both together, or transfected with a non-targeting siRNA, cultured in full medium or starved for two hours in EBSS, with or without the addition of bafilomycin A1 (100 nM, 2 h); Actin, loading control. Representative of two independent experiments
Fig. 9
Fig. 9
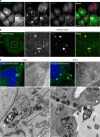
RUSC2-positive and ATG9A-positive vesicles closely associate with autophagosomes in starved cells. a Widefield imaging of HeLa cells stably expressing GFP-RUSC2, mixed on coverslips with parental HeLa cells (marked with asterisks), starved for two hours in EBSS, labelled with anti-ATG9A and anti-LC3B. The insets show GFP-RUSC2- and ATG9A-positive puncta in very close proximity to LC3B puncta. Scale bar: 20 μm. b Confocal imaging with Airyscanning of HeLa cells stably expressing GFP-RUSC2, starved for 2 h in EBSS, labelled with anti-LC3B. The zoomed area is roughly 10 μm2. Scale bar: 5 μm. c Correlative light and electron microscopy (CLEM) of HeLa cells stably expressing RUSC2-GFP, starved for two hours in EBSS with 100 nM bafilomycin A1. The RUSC2-GFP puncta correspond to clusters of small uncoated vesicular and tubular structures (marked with asterisks), often in close proximity to autophagosomes (marked with arrows). Scale bars: fluorescence and EM, 5 μm; Zoom, 500 nm
Fig. 10
Fig. 10
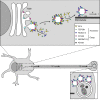
Proposed model of AP-4-dependent trafficking. (1) AP-4 and its accessory proteins, TEPSIN, RUSC1 and RUSC2, are recruited to the TGN membrane where they concentrate their transmembrane cargo proteins, ATG9A, SERINC1 and SERINC3, into a vesicle bud; (2) A vesicle carrying ATG9A and SERINCs, coated by AP-4 and its accessory proteins, buds from the TGN membrane; (3) AP-4 and TEPSIN fall off the vesicle membrane and are available for further rounds of vesicle budding at the TGN, while RUSCs remain associated with the vesicle; (4) The vesicle associates with microtubule transport machinery, via the RUSCs, for plus-end-directed transport to the cell periphery; (5) The peripheral ATG9A-containing vesicles act in the nucleation of autophagosomes. In neurons, microtubules are polarised with their plus-ends at the distal axon, which is an important site of autophagosome biogenesis. Thus, in AP-4-deficient neurons ATG9A may not be delivered efficiently to the distal axon, thereby disrupting the spatial control of autophagy

Similar articles

Cited by

References

    1. Robinson MS. Forty years of clathrin-coated vesicles. Traffic. 2015;16:1210–1238. doi: 10.1111/tra.12335. - DOI - PubMed
    1. Dell’Angelica EC, Mullins C, Bonifacino JS. AP-4, a novel protein complex related to clathrin adaptors. J. Biol. Chem. 1999;274:7278–7285. doi: 10.1074/jbc.274.11.7278. - DOI - PubMed
    1. Hirst J, Bright NA, Rous B, Robinson MS. Characterization of a fourth adaptor-related protein complex. Mol. Biol. Cell. 1999;10:2787–2802. doi: 10.1091/mbc.10.8.2787. - DOI - PMC - PubMed
    1. Hirst J, Irving C, Borner GHH. Adaptor protein complexes AP-4 and AP-5: new players in endosomal trafficking and progressive spastic paraplegia. Traffic. 2013;14:153–164. doi: 10.1111/tra.12028. - DOI - PubMed
    1. Abou Jamra R, et al. Adaptor protein complex 4 deficiency causes severe autosomal-recessive intellectual disability, progressive spastic paraplegia, shy character, and short stature. Am. J. Hum. Genet. 2011;88:788–795. doi: 10.1016/j.ajhg.2011.04.019. - DOI - PMC - PubMed

Publication types

MeSH terms