. 2018 Oct;562(7726):223-228.
doi: 10.1038/s41586-018-0552-x. Epub 2018 Sep 26.

Erythro-myeloid progenitors contribute endothelial cells to blood vessels

Affiliations

Erythro-myeloid progenitors contribute endothelial cells to blood vessels

Alice Plein et al. Nature. 2018 Oct.

Abstract

The earliest blood vessels in mammalian embryos are formed when endothelial cells differentiate from angioblasts and coalesce into tubular networks. Thereafter, the endothelium is thought to expand solely by proliferation of pre-existing endothelial cells. Here we show that a complementary source of endothelial cells is recruited into pre-existing vasculature after differentiation from the earliest precursors of erythrocytes, megakaryocytes and macrophages, the erythro-myeloid progenitors (EMPs) that are born in the yolk sac. A first wave of EMPs contributes endothelial cells to the yolk sac endothelium, and a second wave of EMPs colonizes the embryo and contributes endothelial cells to intraembryonic endothelium in multiple organs, where they persist into adulthood. By demonstrating that EMPs constitute a hitherto unrecognized source of endothelial cells, we reveal that embryonic blood vascular endothelium expands in a dual mechanism that involves both the proliferation of pre-existing endothelial cells and the incorporation of endothelial cells derived from haematopoietic precursors.


Conflict of interest statement

The authors declare no competing interests.

Figures

Extended data figure 1
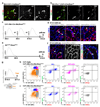
Extended data figure 1. Endothelial Csf1r-iCre targeting is observed with different recombination reporters and targeted ECs are distinguishable from macrophages and pericytes.
(a-c) Csf1r-iCre;RosaYfp (a) Csf1r-iCre;CAG-Cat-Egfp (b) and Csf1r-iCre;RosatdTom (c) hindbrains (n = 3 each) at the indicated stages were wholemount labelled with IB4 and for YFP (a) or GFP (b) or are shown together with tdTom fluorescence (c). In (a), the white squares indicate areas which were imaged at higher magnification for Fig. 1a. The indicated single channels are also shown individually. (d) Csf1r-iCre;RosatdTom E12.5 hindbrains (n = 3), wholemount labelled for ERG and CDH5 and shown including tdTom fluorescence to demonstrate that Csf1r-iCre targets ECs that form junctions with neighbouring ECs. (e,f) E12.5 Csf1r-iCre;RosaYfp hindbrains (n = 3), labelled for YFP and the microglia marker F4/80 (e) or the pericyte marker NG2 (f) together with IB4, show that Csf1r-iCre-targeted vessel-bound cells are neither microglia nor pericytes. In (e), the boxed area is shown in higher magnification and as single channels adjacent to the panel. In (f), a single optical y/z cross section at the position indicated with the yellow line is displayed at higher magnification with single channels. Symbols: Microglia and ECs are indicated with arrowheads and arrows, respectively, pericytes with double arrowheads, junctional CDH5 staining with a curved arrow; solid and clear symbols indicate the presence or absence of marker expression, respectively. Scale bars: 100 µm (a), 20 µm (b,c,e,f), 50 µm (d).
Extended data figure 2
Extended data figure 2. Endothelial Csf1r-iCre-targeting is not caused by endothelial Csf1r expression and occurs independently of myeloid differentiation.
(a,b) Csf1r-Egfp (a) and Csf1r-iCre;RosaYfp (b) E11.5 hindbrains (n = 3 each), wholemount labelled for CSF1R and EGFP or YFP together with IB4, show lack of Csf1r promoter activity and CSF1R protein in ECs. (c) Graphic representation of relative Cdh5 and Csf1r expression levels in E14.5 brain or pooled lung/liver EC microarrays ; n = 5 each; ***P < 0.0001 (two-tailed unpaired t-test). (d-g) FACS separation of tdTom+ cells from Csf1r-iCre;RosatdTom embryos (n = 3) for gene expression analysis, including (d) representative gating strategy to exclude dead cells and doublets in this and subsequent experiments and (e) sorting into PECAM1+ CD45- ECs versus CD45+ PECAM1- MCs. (f) Representative RT-qPCR gene amplification graphs for Csf1r versus Actb from tdTom+ MCs and ECs; ΔRn, normalised reporter value for SYBR Green minus baseline instrument signals. (g) Graphic representation of the fold change in RT-qPCR amplification of the indicated genes relative to Actb for both cell populations; each data point represents one embryo; *P = 0.0242, ***P < 0.0001 (two-tailed unpaired t-test). (h) Csf1r-iCre;RosaYfp P0 striatum on a Pu.1+/+ versus Pu.1-/- background (n = 3 brains each), cryo-sectioned and labelled for YFP and F4/80 together with IB4 to show that Csf1r-iCre-targeted ECs are PU.1-independent and persist postnatally. Symbols: Arrowheads indicate microglia, arrows YFP+ ECs, clear arrows YFP+ ECs that are CSF1R- and F4/80-. Scale bars: 20 µm.
Extended data figure 3
Extended data figure 3. Lineage tracing of yolk sac and liver EMPs.
(a,b) E8.5 wild type (a) and Pu.1-/- (b) yolk sacs on a Csf1r-iCre;RosaYfp background (n = 3 yolk sacs each), wholemount labelled for YFP and KIT, show Csf1r-iCre-targeted KIT+ round cells corresponding to EMPs/MPs and Csf1r-iCre-targeted KIT- flat cells corresponding to ECs. Scale bars: 20 µm. (c-f) Pregnant Csf1r-Mer-iCre-Mer;RosatdTom (c,d) and KitCreERT2;RosatdTom (e,f) dams were injected with a single tamoxifen dose on the indicated days; E12.5 yolk sacs were wholemount labelled for the indicated markers to identify Csf1r-iCre-targeted ECs and macrophages (n = 3 yolk sacs for each genotype). Symbols: Wavy arrows indicate EMPs, straight arrows Csf1r-iCre-lineage-traced ECs, arrowheads macrophages. Solid and clear symbols indicate the presence or absence, respectively, of the indicated markers. Scale bars: 20 µm. (g-i) Pregnant dams were injected with a single tamoxifen dose on E10.5 (g) before FACS analysis of E11.5 Csf1r-Egfp;Csf1r-Mer-iCre-Mer;RosatdTom (h) or Csf1r-Mer-iCre-Mer;RosatdTom control (i) livers (n = 4 each) for the indicated markers; the CD45hi KIT- differentiated MCs (blue), CD45lo KIT+ EMP/MP population (pink) and the CD45- KIT+ population (grey) were gated further for Csf1r-Egfp and tdTom. CD45- KIT+ cells were neither MCs nor EMPs, because they lacked CD45, tdTom and EGFP.
Extended data figure 4
Extended data figure 4. Immunostaining controls for cultured Csf1r-iCre-targeted cells.
The indicated cell populations were FACS-isolated from E12.5 Csf1r-iCre;RosatdTom liver or blood with the indicated markers and cultured for three days in methocult (met.) on fibronectin (FN); n = 1 experiment. Adherent cells from tdTom+ liver MC (a) and EMP/MP (b) cultures were stained for ERG and VEGFR2 (top panels) or with secondary antibodies only (bottom panels). In (c), adherent cells from tdTom+ blood EMP/MP cultures were immunostained for CSF1R together with the myeloid markers CD45 (top panels) or F4/80 (bottom panels). In the first panel in each row, the phase contrast and DAPI images were merged. In panels 2-4 in each row, immunolabelled cells were visualised together with tdTom fluorescence, with single channels for the indicated markers shown separately in grey scale. Symbols: Arrows indicate tdTom+ ECs, arrowheads tdTom+ myeloid cells; solid and clear symbols indicate the presence or absence, respectively, of the indicated markers. Scale bars: 20 µm.
Extended data figure 5
Extended data figure 5. Hoxa gene targeting with Csf1r-iCre.
(a) Schematic representation of the Hoxa gene cluster and adjacent Evx1 gene using the UCSC Genome Browser with the mouse December 2011 (GRCm38/mm10) Assembly, including position of the LoxP sites used for gene targeting. (b-c) Validation of Hoxa targeting. (b) FACS strategy to isolate KIT+ cells from E12.5 control (pooled Csf1r-iCre- or Csf1r-iCre+;Hoxa+/+; n = 14), Hoxa+/fl;Csf1r-iCre (n = 6) and Hoxafl/fl;Csf1r-iCre (n = 8) livers. (c) qPCR analysis of Hoxa gene copy number relative to Evx1; data are shown as mean ± SD; each symbol represents the value for one individual liver; * P=0.0156, *** P<0.001 (1-way ANOVA, Tukey’s multiple comparisons test). (d-f) Representative FACS analysis (d) and quantification (e,f) of liver cell populations at E12.5 shows a similar number of total CD45+ and CD45+ CD11b+ differentiated MCs in Hoxafl/fl;Csf1r-iCre mutants (n = 7 for CD45+; n = 6 for CD45+ CD11b+) versus pooled Csf1r-iCre- and Csf1r-iCre+;Hoxa+/+controls (n = 25 for CD45+, n = 17 for CD45+ CD11b+); data are shown as mean ± SD fold change in mutants compared to controls; each data point represents one liver; ns, non-significant, P = 0.6519 (e) and P = 0.496 (f), (two-tailed unpaired t-test). (g-i) E12.5 hindbrains of the indicated genotypes were immunolabelled to determine vascular complexity and quantify microglia. (g) Schematic representation of a wholemount embryonic hindbrain (left) and location of the hindbrain areas i-iv used for quantification in each hindbrain (right); values for the four areas in each hindbrain were averaged to obtain the value for that hindbrain; EC quantifications are shown in Fig. 5c. (h) Hindbrains were wholemount labelled with IB4 and for RFP to visualise tdTom and for F4/80 to visualise microglia; white boxes indicate areas shown in higher magnification in Fig. 5. (i) Quantification of microglia number in Hoxafl/fl;Csf1r-iCre mutants (n = 9) versus controls (n = 10, pooled Csf1r-iCre+;Hoxa+/+ and Csf1r-iCre- of any Hoxa genotype); mean ± SD fold change in mutant compared to control hindbrain; each data point represents one hindbrain; **P = 0.0055 (two-tailed unpaired t-test). (j-l) E11.5 Csf1+/+ and Csf1+/op littermate hindbrains, wholemount labelled for F4/80 together with IB4 (j) before quantification of microglia (k) and vascular branchpoint (l) number as a measure of vascular complexity. Mean ± SD; each data point represents the value for one hindbrain, n=3 each; ns, non-significant, P = 0.808, **P = 0.0012 (two-tailed unpaired t-test). Scale bars: 200 µm (h), 100 µm (j).
Extended data figure 6
Extended data figure 6. Csf1r-iCre-targeted ECs proliferate in vivo.
(a,b) E12.5 Csf1r-iCre;RosatdTom yolk sac (a) or hindbrain (b), wholemount stained for the proliferation marker pHH3 and VEGFR2 or for pHH3 together with IB4, respectively, and shown together with tdTom fluorescence (n = 3 each). Areas indicated with white squares were imaged at higher magnification and are shown below the corresponding panel, with tdTom and pHH3 channels also shown separately in grey scale. Symbols: The arrows indicate proliferating tdTom+ pHH3+ ECs; solid and clear symbols indicate the presence or absence, respectively, of tdTom fluorescence; the wavy arrow indicates a tdTom- pHH3+ neural progenitor. Scale bars: 100 µm (top panels), 20 µm (lower panels). (c-e) Cell cycle distribution of tdTom+ and tdTom- ECs. (c) FACS strategy to isolate tdTom+ and tdTom- PECAM1+ ECs from E12.5 Csf1r-iCre;RosatdTom embryos (n = 3 embryos). (d) Graphic representation of cell cycle distribution based on Hoechst 33342 fluorescence as a measure of DNA content; low and high staining intensity is observed in cells with a DNA ploidy of 2n (G0/G1 phase) or 4n (G2/M phase), respectively; an intermediate staining intensity corresponds to S phase. (e) Mean ± SD proportion of tdTom+ and tdTom- ECs in G1, S and G2/M based on the area of the corresponding peaks in (d); n.s., non-significant, P > 0.9999 (two-way ANOVA, Bonferroni’s multiple comparisons test).
Extended data figure 7
Extended data figure 7. Validation of gene expression data from RNA-Seq and microarray studies.
ECs were FACS-isolated from E12.5 Csf1r-iCre;RosatdTom embryos (n = 3) as in Fig. 6a to validate the RNA-Seq and microarray data shown in Fig. 6d-f. Slc2a1 was analysed as a representative brain EC-enriched transcript/differentiation marker, Mrc1 and Oit3 as representative liver EC-enriched transcripts. (a) Relative transcript levels of the Gt(ROSA)26Sor (tdTomato) transcript by RNA-Seq of the E12.5 tdTom+ and tdTom- EC populations, whose analysis is presented in Fig. 6a-f; mean ± SD of normalised counts, n = 3 each; **P = 0.0085 (two-sided unpaired t-test). (b) RT-qPCR analysis for the indicated genes in tdTom+ versus tdTom- ECs isolated from whole E12.5 embryos (n = 5) to validate genes identified by RNA-Seq in Fig. 6e,f as differentially expressed. Mean ± SD of fold change; ***P < 0.0001 (Slc2a1), ***P = 0.0008 (Mrc1) **P = 0.0056 (Oit3) (two-sided unpaired t-test). (c) RT-qPCR analysis for the indicated genes in tdTom- ECs isolated from the E12.5 brain versus liver (n = 3 for each organ) to validate organ-specific transcript enrichment identified via microarray analysis shown in Fig. 6f. Mean ± SD of fold change; *P = 0.019, **P = 0.0082, ***P < 0.0001 (two-sided unpaired t-test); ND, not detectable. (d) RT-qPCR analysis for the indicated genes to directly compare the expression levels of brain and liver EC differentiation markers in tdTom+ versus tdTom- ECs isolated from brain (n = 3) or liver (n=5). Mean ± SD of fold change; ns, non-significant, P = 0.9398 (liver Slc2a1), P = 0.8045 (liver Mrc1), P = 0.6327 (liver Oit3), **P = 0.0073 (brain Slc2a1) (two-sided unpaired t-test); ND, not detectable.
Extended data figure 8
Extended data figure 8. Csf1r-iCre-targeted ECs contribute to embryonic vasculature in multiple organs.
(a) 20 µm cryosections of the indicated E12.5 Csf1r-iCre;RosatdTom organs (n = 3 each) were immunolabelled for the indicated EC markers together with antibodies for RFP to identify tdTom protein (top and bottom panels) or are shown with tdTom fluorescence (middle panels); single channels are shown in grey scale. The white boxes indicate the position of areas shown in higher magnification in Fig. 6g; note that some areas selected for higher magnification are not contained entirely within the field of view, and accordingly the boxes are shown incomplete. Scale bars: 200 µm. (b) Gating strategy for FACS analysis of tdTom+ and tdTom- ECs from E12.5 Csf1r-iCre;RosatdTom brain, lung, heart and liver and control organs lacking iCre, using antibodies for CD11b, CD41, CD45, KIT, PECAM1; associated EC quantifications are shown in Fig. 6i. An analogous strategy was used for the quantifications shown in Fig. 6j and in the Extended Data Fig. 9b.
Extended data figure 9
Extended data figure 9. Csf1r-iCre-targeted ECs contribute to organ vasculature in late stage embryos and adults.
(a) 20 µm cryosections of the indicated organs from E18.5 Csf1r-iCre;RosaYfp mice (n = 2 each) were immunolabelled for YFP, the EC marker PECAM1 and the macrophage marker IBA1; single channels are shown in grey scale. Symbols: Arrowheads indicate YFP+ IBA1+ macrophages; solid and empty arrows indicate ECs that are YFP+ and lack IBA1 expression, respectively. Scale bars: 20 µm. (b) Flow cytometry of dissociated cells from the indicated organs of E18.5 Csf1r-iCre;RosatdTom embryos after staining with antibodies for CD11b, CD41, CD45, KIT, PECAM1, using the gating strategy shown in the Extended data Fig. 8b; mean ± SD, n = 5 each; ***P < 0.0001 (1-way ANOVA, Tukey’s multiple comparisons test). (c) 20 µm cryosections of the indicated organs from 6 months old adult Csf1r-iCre;RosaYfp mice (n = 3 organs each) were immunolabelled for YFP, the EC marker PECAM1 and the macrophage marker F4/80; single channels are shown in grey scale. Symbols: Arrowheads indicate YFP+ and F4/80+ macrophages; solid and empty arrows indicate ECs that are YFP+ and lack F4/80 expression, respectively. Scale bars: 20 µm.
Extended data figure 10
Extended data figure 10. Csf1r-iCre-targeted ECs contribute to adult organ vasculature.
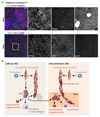
(a) 20 µm cryosections of 3 months old adult Csf1r-iCre;RosatdTom livers (n = 3) were immunolabelled for RFP and the EC marker VEGFR2 and the macrophage marker F4/80 or the liver EC sinusoidal EC marker MRC1 and then counterstained with DAPI; single channels are shown in grey scale. The white box indicates an area shown in higher magnification in Fig. 6h. Scale bars: 100 µm. (b) Working model for the role of EMPs in generating extra-embryonic yolk sac and intra-embryonic organ ECs alongside their known role in generating myeloid and erythrocyte/megakaryocyte cells.
Fig. 1
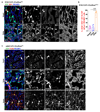
Fig. 1. Csf1r-iCre lineage tracing identifies ECs in developing brain vasculature.
(a-c) Csf1r-iCre;RosaYfp hindbrains of the indicated gestational stages. (a) Wholemount labelling for YFP and IB4; (b) YFP+ IB4+ single cells (microglia) and YFP+ IB4+ vessel-bound cells (putative ECs) per 0.72 mm2, mean ± SD; (c) positive correlation between YFP+ putative EC number and vessel area (r2, coefficient of determination; goodness of fit, P < 0.01); each data point represents one hindbrain, n = 3 hindbrains for each group. (d,e) E12.5 hindbrains of the indicated genotypes, wholemount labelled with the indicated markers and shown including tdTom fluorescence; Csf1r-Mer-iCre-Mer;RosatdTom (d) was tamoxifen-induced on E10.5 and Cdh5-CreERT2;RosatdTom (e) on E11.5; n = 3 hindbrains for each genotype. (f-h) Csf1r-iCre;RosaYfp E11.5 hindbrains on a Pu.1+/+ versus Pu.1-/- background, labelled for YFP and F4/80 together with IB4. The boxed area in (f) was 3D surface rendered and is shown in (g) en face and as a lateral view starting at the plane indicated by the yellow line; the vascular lumen (lu) is outlined. (h) YFP+ microglia (Pu.1+/+ n = 4; Pu.1-/- n = 3) and ECs (Pu.1+/+ n = 6; Pu.1-/- n = 7), mean ± SD; each data point represents one hindbrain; n.s., non-significant; ***P < 0.0001 (two-tailed unpaired t-test). Symbols: Microglia and ECs are indicated with arrowheads and arrows, respectively. Solid and clear symbols indicate the presence or absence of marker expression, respectively. Scale bars: 20 µm (a,d,f), 50 µm (e).
Fig. 2
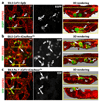
Fig. 2. Csf1r-iCre-targeted ECs emerge concomitantly with EMPs in the yolk sac.
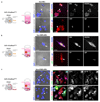
E8.5 yolk sacs were wholemount labelled with the indicated markers. (a) Csf1r-Egfp yolk sacs. (b,c) Csf1r-iCre;RosaYfp yolk sacs on a Pu.1+/+ versus (b) Pu.1-/- background (c). N = 4 yolk sacs for each genotype. The yellow lines mark the start of 3D-rendered lateral views. Wavy arrows indicate VEGFR2+ EGFP+ and VEGFR2+ YFP+ round EMPs/MPs protruding from the vascular wall into the lumen (lu) and straight arrows indicate YFP+ VEGFR2+ flat cells within the vascular wall. Scale bars: 20 µm.
Fig. 3
Fig. 3. Csf1r-iCre-targeted hindbrain ECs emerge from intraembryonic EMPs.
(a,b) A pregnant Csf1r-Egfp;Csf1r-Mer-iCre-Mer;RosatdTom dam was injected with a single tamoxifen dose on E10.5 (a) before FACS of E11.5 liver and blood cells (b) to gate the CD45hi KIT- differentiated MCs (blue) and CD45lo KIT+ EMP/MP populations (pink) for EGFP and tdTom (n = 4 embryos). (c-f) Pregnant Csf1r-Mer-iCre-Mer;RosatdTom (c,d) and KitCreERT2;RosatdTom (e,f) dams were injected with a single tamoxifen dose on the indicated days before E12.5 hindbrain wholemount staining for the indicated markers and imaging including tdTom fluorescence. Symbols: Arrows indicate tdTom+ ECs, arrowheads macrophages/microglia and the wavy arrow a cluster of tdTom+ ERG- IB4- neural cells derived from Kit+ neural progenitors. Scale bars: 20 µm.
Fig. 4
Fig. 4. EMPs in the liver and blood give rise to ECs in vitro.
(a,b) FACS strategy to separate the differentiated MC and EMP/MP populations from E12.5 Csf1r-iCre;RosatdTom liver (a) and blood (b) using antibodies for CD45 and KIT after excluding PECAM1+ cells to prevent EC contamination. (c,d) tdTom+ proportion in the FACS-isolated MC and EMP/MP populations from liver and blood shown in (a,b), and Giemsa-Wright staining of representative cells (Mo, monocyte; GC, granulocyte; Mϕ, macrophage). (e-h) Brightfield images of myeloid (white) and erythroid (rust-coloured) colonies (e,f) and immunofluorescence of adherent cells (g,h) after three days in methocult (met.) on FN. Adherent cells were immunolabelled for ERG and VEGFR2, counterstained with DAPI and are shown together with tdTom fluorescence (Tom). Symbols: Arrows indicate tdTom+ ECs, arrowheads tdTom+ MCs; solid and clear symbols indicate high versus low marker expression, respectively. Scale bars: 20 µm. N=3 independent experiments.
Fig. 5
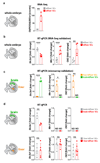
Fig. 5. Csf1r-iCre-targeted ECs form in a Hoxa-dependent mechanism and promote vascularisation in the embryonic hindbrain.
(a) Transcriptomic analysis of the indicated cell populations for the indicated genes, based on published RNAseq (n = 2, except for E10.25 YS (4) and head (3) Mϕs) , and EC microarray data (n = 3) , , shows that Hoxa transcripts are enriched in intraembryonic EMPs; white and black represent low versus high relative expression; Mϕs, macrophages; YS, yolk sac; HUVECs, human umbilical cord ECs; Adgre1 and Ptprc, encode F4/80 and CD45, respectively. (b-d) E12.5 littermate hindbrains of the indicated genotypes. (b) Wholemount labelling for the indicated markers; RFP staining to visualise tdTom demonstrates fewer Csf1r-iCre-targeted ECs; symbols: arrows and arrowheads indicate tdTom+ ECs and microglia, respectively; scale bars: 50 µm. (c) tdTom+ relative to IB4+ EC volume in Hoxa+/+ (n = 3) versus Hoxafl/fl (n = 7) hindbrains on a Csf1r-iCre;RosatdTom background, mean ± SD. (d) SVP complexity, measured as fold change of vascular branchpoints in Hoxafl/fl;Csf1r-iCre (n = 9) relative to control (pooled Csf1r-iCre+;Hoxa+/+ and Csf1r-iCre- of any Hoxa genotype, n = 13) hindbrains, mean ± SD. Each data point represents one hindbrain; *P = 0.0184 (c), *P = 0.0323 (d) (two-tailed unpaired t-test).
Fig. 6
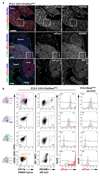
Fig. 6. The Csf1r-iCre-targeted EC population has a core endothelial transcription signature with an increase in liver EC transcripts and persists in adult organs.
(a-f) Transcriptomic analysis. (a) FACS strategy to isolate tdTom- and tdTom+ ECs from E12.5 Csf1r-iCre;RosatdTom embryos for RNA-Seq. (b) Graphic representation of genes whose expression is significantly different (green dots) and similar (black dots) between both EC populations. (c) Volcano plot of significantly differentially expressed transcripts with > 100 counts per transcript; selected genes are named; grey and red data points represent transcripts in tdTom- ECs with ≥ 2-fold over- or under-representation, respectively. Relative expression levels for: (d) markers typical of myeloid (Cx3cr1-Ptprc), astrocytic (Gfap), smooth muscle (Acta2), neuronal (Rbfox3, Nefl), skeletal muscle (Myog) or epithelial (Cdh1) differentiation; (e) EC core and maturation markers; (f) representative brain and liver EC specialisation markers, shown alongside their relative expression in brain versus liver/lung ECs microarrays . Mean ± SD; RNA-Seq, n = 3 embryos (DESeq2; Benjamini-Hochberg’s multiple comparisons test for p-value adjustment, adjP); microarray, n = 5 organs (2-way ANOVA, Bonferroni’s multiple comparisons test); ns, non-significant, *P < 0.05, **P < 0.01, ***P < 0.0001; see Source Data Figure 6 for exact values. (g,h) Csf1r-iCre;RosatdTom E12.5 (g) and adult (h) liver cryosections, labelled for the indicated markers and RFP to visualise tdTom, including DAPI counterstaining in (h); n = 3 independent experiments. Symbols: Arrows and arrowheads indicate tdTom+ ECs and macrophages, respectively; clear arrowheads indicate that macrophages lack VEGFR2. Scale bar: 50 µm. (i,j) FACS of Csf1r-iCre;RosatdTom E12.5 (i) and adult (j) brain, heart, lung and liver to determine their relative tdTom+ EC contribution; mean ± SD; n = 5 organs each (i; except lung, n = 4), n = 6 organs each (j; except liver, n = 7); each data point represents one organ; ***P < 0.0001 (i); **P = 0.0023, 0.0066, 0.00541 (j) for liver versus brain, heart, lung, respectively (1-way ANOVA, Tukey’s multiple comparisons test).

Comment in

  • A dual origin for blood vessels.
    Iruela-Arispe ML. Iruela-Arispe ML. Nature. 2018 Oct;562(7726):195-197. doi: 10.1038/d41586-018-06199-2. Nature. 2018. PMID: 30291309 Free PMC article.

Similar articles

Cited by

References

    1. Potente M, Gerhardt H, Carmeliet P. Basic and therapeutic aspects of angiogenesis. Cell. 2011;146:873–887. - PubMed
    1. Hirschi KK, Ingram DA, Yoder MC. Assessing identity, phenotype, and fate of endothelial progenitor cells. Arteriosclerosis, Thrombosis, and Vascular biology. 2008;28:1584–1595. - PMC - PubMed
    1. Pollard JW. Trophic macrophages in development and disease. Nature Reviews. Immunology. 2009;9:259–270. - PMC - PubMed
    1. Fantin A, et al. Tissue macrophages act as cellular chaperones for vascular anastomosis downstream of VEGF-mediated endothelial tip cell induction. Blood. 2010;116:829–840. - PMC - PubMed
    1. Clausen BE, Burkhardt C, Reith W, Renkawitz R, Forster I. Conditional gene targeting in macrophages and granulocytes using LysMcre mice. Transgenic Research. 1999;8:265–277. - PubMed

Publication types

MeSH terms