. 2018 Sep 25;9(1):3923.
doi: 10.1038/s41467-018-06308-9.

Persistent repair intermediates induce senescence

Affiliations

Persistent repair intermediates induce senescence

F M Feringa et al. Nat Commun. .

Abstract

Double-stranded DNA breaks activate a DNA damage checkpoint in G2 phase to trigger a cell cycle arrest, which can be reversed to allow for recovery. However, damaged G2 cells can also permanently exit the cell cycle, going into senescence or apoptosis, raising the question how an individual cell decides whether to recover or withdraw from the cell cycle. Here we find that the decision to withdraw from the cell cycle in G2 is critically dependent on the progression of DNA repair. We show that delayed processing of double strand breaks through HR-mediated repair results in high levels of resected DNA and enhanced ATR-dependent signalling, allowing p21 to rise to levels at which it drives cell cycle exit. These data imply that cells have the capacity to discriminate breaks that can be repaired from breaks that are difficult to repair at a time when repair is still ongoing.


Conflict of interest statement

The authors declare no competing interests

Figures

Fig. 1
Fig. 1
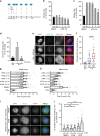
Spontaneous recovery awaits successful repair. a Timing of cell cycle exit by onset of Cyclin B1 translocation (T) or spontaneous recovery by mitotic entry (M) after IR with indicated doses. Pooled cells from three independent exp. n > 20 Mean + sd. b Number of γH2AX foci in interphase (I) cells 1 h after IR and recovering (mitotic, M) cells collected 5–7 h after IR with indicated doses. Pooled cells from three independent exp. n > 65 + sd. c Stills representing RPE CCNB1YFP cells that enter mitosis or that translocate Cyclin B1 after IR (2 Gy) and the corresponding 53BP1mCherry signal in the nucleus. Scale bar 10 μm. d Quantification of 53BP1 foci from live cell imaging at indicated timepoints after IR in cells that recover spontaneously and cells that translocate Cyclin B1. n = number of cells pooled from three independent experiments + 95% confidence interval
Fig. 2
Fig. 2
ATR signalling is the main driver of cell cycle exit in G2 phase. a Schematic representation of the experimental set-up. b, c Mitotic entry was scored in RPE CCNB1YFP-positive (G2)-cells after IR (2 Gy). ATM inhibitor (KU55933) (b) or ATR inhibitor (VE-821) (c) was added at indicated timepoints before or after IR. Average of three independent experiments + sem. d Percentage of G2 cells with nuclear translocated Cyclin B1 at 6 h after OHT addition. S phase cells were excluded based on Edu staining. Prophase cells with nuclear Cyclin B1 localization were excluded based on DNA condensation as stained by DAPI. Average of three independent experiments + sem. e Stills represent G2 cells (Edu negative) 0 h or 4 h after IR (2 Gy) with nuclear translocated or cytoplasmic Cyclin B1 localization. pSer/Thr staining in foci represents ATR substrate phosphorylation. Scale bar 10 μm. f Quantification of total pSer/Thr phosphorylation signal in foci at indicated timepoint after IR in cells with cytoplasmic or nuclear Cyclin B1 localization. Pooled cells from three independent experiments. n > 44. Box plot whiskers indicate 10–90% boundary. ****p < 0.0005 two-sided t-test. g, h Time of mitotic entry after IR (2 Gy) in G2 cells scored in (Fig. 2b, c). Pooled cells from three independent experiments n > 35 + sd. i Stills represent mitotic cells collected by nocodazole and stained for MDC1 and γH2AX to quantify DSBs in cells that entered mitosis within 9 h after IR (2 Gy) in G2 phase. Cells in S phase at the time of IR are excluded by EdU staining. Scale bar 5 μm. j Number of MDC1 and γH2AX double positive foci in mitotic cells as shown in i. Pooled cells from two independent experiments n > 35 + sd
Fig. 3
Fig. 3
Timely negative feedback is crucial to prevent irreversible cell cycle exit in G2 phase. a Mitotic entry scored in RPE CCNB1YFP cells within 15 h following IR (2 Gy). Wip1 inh or DMSO were added at indicated timepoints before or after IR. Average of three independent experiments + sem. b Percentage of cells that translocate Cyclin B1 following IR treated as in a. Average of three independent experiments + sem. c Cumulative onset of nuclear translocation of Cyclin in cells treated in b. Average of three independent experiments + sem. d Nuclear p21 intensity in G2 cells 3 h after 2 Gy in presence or absence of Wip1 inhibition. Cells that translocated Cyclin B1 to the nucleus were separated from cells with cytoplasmic nuclear B1 localization. n > 18 cells from representative experiment. Box plot whiskers indicate 10–90% boundary. ***p < 0.005 two-sided t-test. e Percentage of G2 cells that translocate Cyclin B1 to the nucleus and exit the cell cycle following IR (2 Gy) in RPE CCNB1YFP cells with wild-type or truncated Wip1. Average of three independent experiments + sem
Fig. 4
Fig. 4
Efficient processing of DNA lesions is necessary to prevent cell cycle exit. a Schematic representation of the experimental set-up. b Stills represent RPE CCNB1YFP cells with 53BP1mCherry tracked by live-cell imaging at indicated timepoints after IR (2 Gy) followed by an image of the identical cell that was fixed 4 h after IR and stained for RPA and Rad51. Scale bar 10 μm. c Number of indicated foci in cells that have cytoplasmic Cyclin B1 localization at 4 h after IR (2 Gy) or cells that translocated Cyclin B1 and therefore have nuclear localization at 4 h after IR. 53BP1 foci were determined at indicated timepoints by live-cell imaging of RPE CCNB1YFP-53BP1mCherry cells. RPA and Rad51 foci were determined in the tracked cell by imaging of the same position after fixation, pre-extraction and antibody staining for RPA and Rad51. Pooled cells from three independent experiments. n > 65 + sd
Fig. 5
Fig. 5
Disrupting DNA repair efficiency drives cell cycle exit. a Mitotic entry scored in RPE CCNB1YFP cells within 15 h following IR (2 Gy). Average of three independent experiments + sem. b Percentage of RPE CCNB1YFP cells that translocate Cyclin B1 after IR (2 Gy). Average of three independent experiments + sem. c Induction of GFPp21 expression after IR (2 Gy) upon depletion or inhibition of the indicated repair proteins. Mean lines from pooled individual cells from two independent experiments, n > 50 cells per condition, significance by 2-way ANOVA

Similar articles

Cited by

References

    1. Shaltiel IA, Krenning L, Bruinsma W, Medema RH. The same, only different - DNA damage checkpoints and their reversal throughout the cell cycle. J. Cell Sci. 2015;128:607–620. doi: 10.1242/jcs.163766. - DOI - PubMed
    1. Ciccia A, Elledge SJ. The DNA damage response: making it safe to play with knives. Mol. Cell. 2010;40:179–204. doi: 10.1016/j.molcel.2010.09.019. - DOI - PMC - PubMed
    1. Khanna KK, Jackson SP. DNA double-strand breaks: signaling, repair and the cancer connection. Nat. Genet. 2001;27:247–254. doi: 10.1038/85798. - DOI - PubMed
    1. Jackson SP, Bartek J. The DNA-damage response in human biology and disease. Nature. 2009;461:1071–1078. doi: 10.1038/nature08467. - DOI - PMC - PubMed
    1. Blackford AN, Jackson SP. ATM, ATR, and DNA-PK: the Trinity at the Heart of the DNA Damage Response. Mol. Cell. 2017;66:801–817. doi: 10.1016/j.molcel.2017.05.015. - DOI - PubMed

Publication types

MeSH terms

Substances