. 2018 Oct 22;475(20):3201-3219.
doi: 10.1042/BCJ20180638.

N-terminal acetylation and methylation differentially affect the function of MYL9

Affiliations

N-terminal acetylation and methylation differentially affect the function of MYL9

Chris Nevitt et al. Biochem J. .

Abstract

Deciphering the histone code has illustrated that acetylation or methylation on the same residue can have analogous or opposing roles. However, little is known about the interplay between these post-translational modifications (PTMs) on the same nonhistone residues. We have recently discovered that N-terminal acetyltransferases (NATs) and N-terminal methyltransferases (NRMTs) can have overlapping substrates and identified myosin regulatory light chain 9 (MYL9) as the first confirmed protein to occur in either α-amino-methylated (Nα-methyl) or α-amino-acetylated (Nα-acetyl) states in vivo Here we aim to determine if these PTMs function similarly or create different MYL9 proteoforms with distinct roles. We use enzymatic assays to directly verify MYL9 is a substrate of both NRMT1 and NatA and generate mutants of MYL9 that are exclusive for Nα-acetylation or Nα-methylation. We then employ eukaryotic cell models to probe the regulatory functions of these Nα-PTMs on MYL9. Our results show that, contrary to prevailing dogma, neither of these modifications regulate the stability of MYL9. Rather, exclusive Nα-acetylation promotes cytoplasmic roles of MYL9, while exclusive Nα-methylation promotes the nuclear role of MYL9 as a transcription factor. The increased cytoplasmic activity of Nα-acetylated MYL9 corresponds with increased phosphorylation at serine 19, a key MYL9 activating PTM. Increased nuclear activity of Nα-methylated MYL9 corresponds with increased DNA binding. Nα-methylation also results in a decrease of interactions between the N-terminus of MYL9 and a host of cytoskeletal proteins. These results confirm that Nα-acetylation and Nα-methylation differentially affect MYL9 function by creating distinct proteoforms with different internal PTM patterns and binding properties.

Keywords: acetylation/deacetylation; methylation; myosins.


Conflict of interest statement

Competing Interests

The authors declare that there are no competing interests associated with the manuscript.

Figures
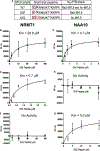
Figure 1.
Figure 1.. N-terminal mutants of MYL9 select for Nα-methylation or Nα-acetylation.
(A) WT MYL9 (SSK) has been found in Nα-methylated and Nα-acetylated forms. The S3P (SPK) MYL9 mutant is Nα-methylated, and the K4Q (SSQ) MYL9 mutant is Nα-acetylated. In vivo, the initiator methionine of WT MYL9 is cleaved to reveal the N-terminal sequence shown. (B–G) in vitro methyltransferase and acetyltransferase assays were performed to determine the KM of NRMT1 or NAA10 (the catalytic subunit of NatA) when using peptides corresponding to the 14 N-terminal amino acids (after Met cleavage) of WT and mutant MYL9 as substrates. (B) The KM of NRMT1 with WT (SSK) MYL9 was determined to be 28.8 μM. (C) NAA10 with WT (SSK) MYL9 had a KM of 0.7 μM. (D) SPK MYL9 was confirmed to be a preferred substrate of NRMT1 with a KM of 0.7 μM. (E) NAA10 showed no activity with SPK MYL9 up to 40 μM. (F) SSQ MYL9 Figure 1. N-terminal mutants of MYL9 select for Nα-methylation or Nα-acetylation. Part 2 of 2 was not a substrate of NRMT1, showing no activity up to 160 μM. (G) The KM of NAA10 with SSQ MYL9 was 5.0 μM. n = 3 for all experiments. All error bars represent standard deviation.
Figure 2.
Figure 2.. Nα-PTMs do not alter the half-life of MYL9.
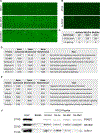
(A) Fluorescence images of cells expressing Dendra2 alone. (B) The sum fluorescence intensity of Dendra2 only expressing cells is plotted over 48 h. Individual cells show decreased RFP intensity as cell division occurs, but the sum intensity over the field of view remains constant. (C) Fluorescent images of cells expressing WT or mutant MYL9-Dendra2 out to 24 h. (D,E) Fluorescent decay for WT, SPK, and SSQ MYL9 was plotted and fit to a model of one-phase exponential decay. SPK and SSQ MYL9 were each fit to an individual model of decay and a model of decay shared with WT MYL9. Individual and shared fit models were then evaluated by an extra sum-of-squares F test. For both SPK and SSQ MYL9 it was determined that a shared model of decay with WT MYL9 was as effective as an individual model, indicating no effect on stability. The half-life of MYL9 was determined to be 16.4 h. Scale bars are 100 μM. n = 3–4 for all experiments. All error bars represent standard deviation.
Figure 3.
Figure 3.. Nα-acetylation of MYL9 promotes cell spreading.
(A) NIH 3T3 cells expressing the Nα-methylation deficient SSQ mutant of MYL9 showed considerable cell spreading, with lamellipodia and filopodia (black arrows) readily observable. Scale bar is 100 μM. (B) Cells expressing SSQ MYL9 covered significantly greater area than all other cell lines at 45 (P < 0.01) and 60 (P < 0.001) minutes as determined by two-way random measures ANOVA with Tukey’s multiple comparisons test (all measurements μm2; 45 min: Control — 96.7 ± 6.1, WT MYL9 — 96.4 ± 14.6, SPK MYL9 — 98.4 ± 22.1, SSQ MYL9 — 154.1 ± 25.2; 60 min: Control — 115.1 ± 12.6, WT MYL9 — 113.6 ± 18.7, SPK MYL9 — 113.0 ± 28.9, SSQ MYL9 — 188.3 ± 30.0) (n = 3). (C) Equal expression of MYL9 variants was confirmed through Western Blotting. FLAG was used as a measure of MYL9-FLAG expression. GAPDH was used as a loading control. All error bars represent standard deviation.
Figure 4.
Figure 4.. Nα-acetylation promotes cell migration and serine 19 phosphorylation.
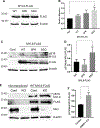
(A,B) HCT116 cells were transduced with WT or mutant MYL9-FLAG and transwell migration assays were performed. (A) Western Blotting confirms that MYL9 variants were expressed at equal levels. β-actin was used as a loading control. (B) Only cells expressing the nonmethylatable SSQ MYL9 mutant showed significantly greater migration than nontransduced control cells (P = 0.01), indicating enhanced cytoskeletal activity (Control — 1.00, WT — 1.27 ± 0.10, SPK — 1.52 ± 0.25, SSQ — 1.81 ± 0.26). (C) Representative blot showing increased pS19 of the nonmethylatable SSQ MYL9 mutant after calcimycin treatment. FLAG blot used to determine total MYL9 protein levels. (D) SSQ MYL9 had a significantly greater ratio of pS19 to total protein than SPK MYL9 (P < 0.05; WT — 0.30 ± 0.06, SPK — 0.21 ± 0.12, SSQ — 0.58 ± 0.13). (E) Representative blot showing increased pS19 of WT MYL9 in cells that lack Nα-methylation (Me3). (F) WT MYL9 in NRMT1 KO cells had a significantly greater ratio of pS19 to total protein than WT MYL9 in control cells (P < 0.005; Control — 0.47 ± 0.01, NRMT1 KO — 0.81 ± 0.08). One-way ANOVA with Tukey’s multiple comparisons test was used for analysis of results in B and D. Results in F were analyzed by a Student’s two-tailed t-test. n = 3 for all experiments. All error bars represent standard deviation.
Figure 5.
Figure 5.. Nα-methylation promotes the nuclear function of MYL9.
(A) Cells expressing the Nα-methylation enriched SPK mutant of MYL9 show significantly greater transcription of ICAM1 than all other TNFα stimulated cell lines. Results are shown as fold-change compared with untreated, nontransduced cells, and one-way ANOVA with Tukey’s multiple comparisons test was performed for statistical analysis (P < 0.001; Control — 9.03 ± 1.50, WT — 6.35 ± 1.36, SPK — 23.71 ± 3.21, SSQ — 4.18 ± 1.23). (B) The induction of ICAM1 transcription by SPK MYL9 was significantly decreased in methylation-deficient NRMT1 KO cells. Results are shown as fold-change compared with treated control cells, and a Student’s two-tailed t-test was performed for statistical analysis (P < 0.005; Control — 1.00, NRMT1 KO — 0.46 ± 0.11). (C) All MYL9-Dendra2 protein variants showed equal increases in nuclear localization after TNFα treatment (P < 0.05). Control Dendra2 protein showed no change in localization upon treatment. Two-way ANOVA with Bonferroni’s multiple comparisons test was used for analysis of results (Dendra2-only no treatment (No Tx) — 0.59 ± 0.01, TNFα — 0.58 ± 0.01; WT No Tx — 0.41 ± 0.005, TNFα — 0.50 ± 0.04; SPK No Tx — 0.42 ± 0.03, TNFα — 0.50 ± 0.01; SSQ No Tx — 0.41 ± 0.005, TNFα — 0.48 ± 0.005). Scale bars are 100 μM. (D) ChIP experiments showing the Nα-methylation enriched SPK MYL9-FLAG mutant was the only protein to result in detectable enrichment of the ICAM1 promoter sequence over input. The PLK promoter served as an off-target control sequence. n = 3 for all experiments. All error bars represent standard deviation.
Figure 6.
Figure 6.. Protein–protein interactions of Nα-acetyl- and Nα-methyl-MYL9.
Nα-PTMs of MYL9 were not specifically bound by any of the tested (A) methyl or (B) acetyl reader domains. Nonspecific binding was observed for all forms of MYL9 peptide to the Tudor domain from the LBR protein, which is consistently recognized nonspecifically. (C) The SILAC LC–MS/MS screen identified few proteins whose interactions increased with Nα-modified MYL9. However, both Nα-mono and trimethylation led to widespread blocking of interactions. (D) Only six proteins showed up-regulated interaction with Nα-modified MYL9. (E) Many of the hundreds of proteins that showed down-regulated interaction with Nα-methylated MYL9 are associated with cytoskeletal regulation. (F) Western blots of pulldowns did not confirm the increased interactions with PSMD7 and HEXIM2, but did confirm the decrease in Cofilin-1 interaction with methylated MYL9.

Similar articles

Cited by

References

    1. Rothbart SB and Strahl BD (2014) Interpreting the language of histone and DNA modifications. Biochim. Biophys. Acta 1839, 627–643 10.1016/j.bbagrm.2014.03.001 - DOI - PMC - PubMed
    1. Wolffe AP and Hayes JJ (1999) Chromatin disruption and modification. Nucleic Acids Res. 27, 711–720 10.1093/nar/27.3.711 - DOI - PMC - PubMed
    1. Reeder JE, Kwak YT, McNamara RP, Forst CV and D’Orso I (2015) HIV tat controls RNA Polymerase II and the epigenetic landscape to transcriptionally reprogram target immune cells. eLife 4, e08955 10.7554/eLife.08955 - DOI - PMC - PubMed
    1. Boisvert FM, Rhie A, Richard S and Doherty AJ (2005) The GAR motif of 53BP1 is arginine methylated by PRMT1 and is necessary for 53BP1 DNA binding activity. Cell Cycle 4, 1834–1841 10.4161/cc.4.12.2250 - DOI - PubMed
    1. Boisvert FM, Dery U, Masson JY and Richard S (2005) Arginine methylation of MRE11 by PRMT1 is required for DNA damage checkpoint control. Genes Dev. 19, 671–676 10.1101/gad.1279805 - DOI - PMC - PubMed

Publication types