

Effects of protein size, thermodynamic stability, and net charge on cotranslational folding on the ribosome
- PMID: 30224455
- PMCID: PMC6176590
- DOI: 10.1073/pnas.1812756115
Effects of protein size, thermodynamic stability, and net charge on cotranslational folding on the ribosome
Abstract
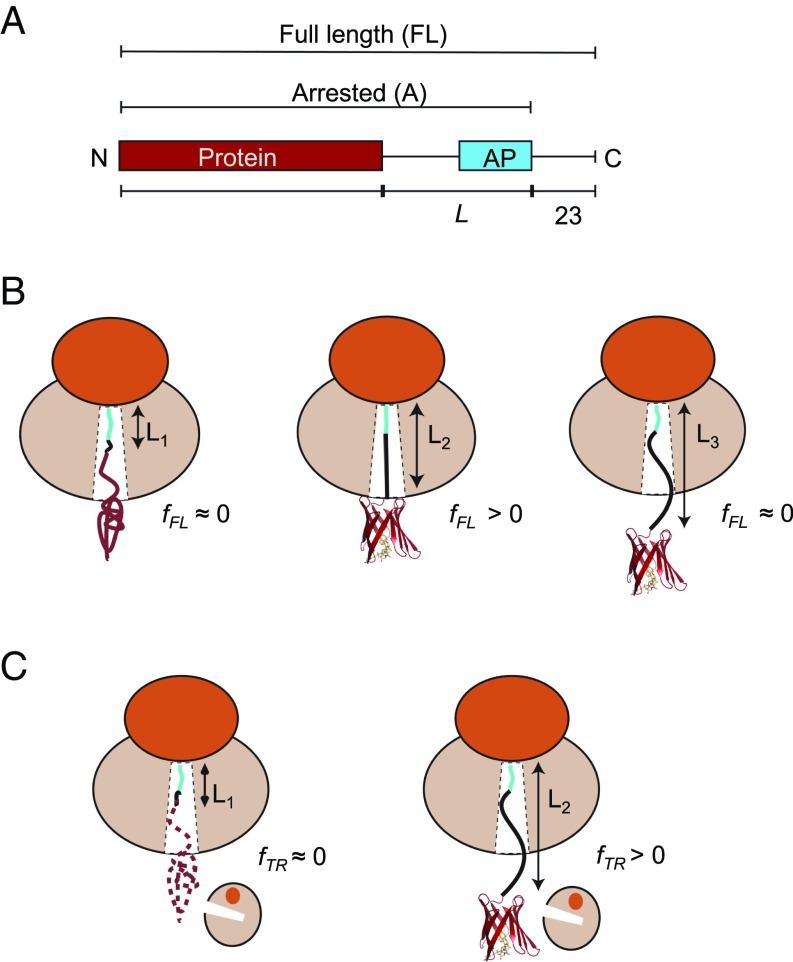
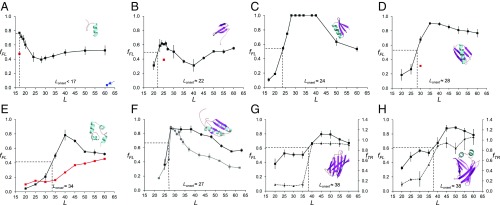
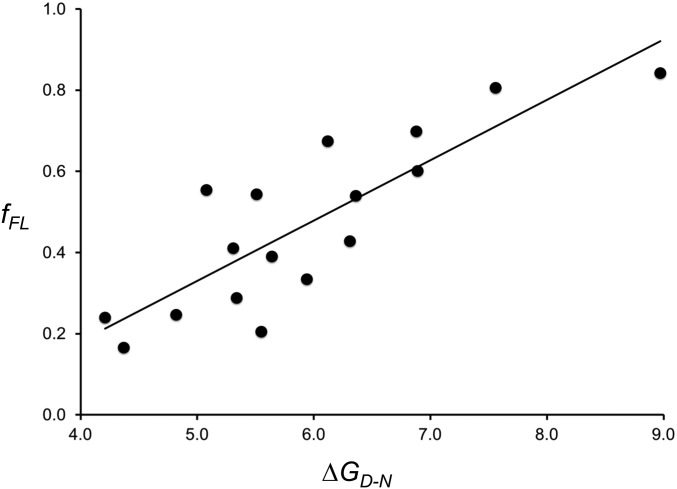
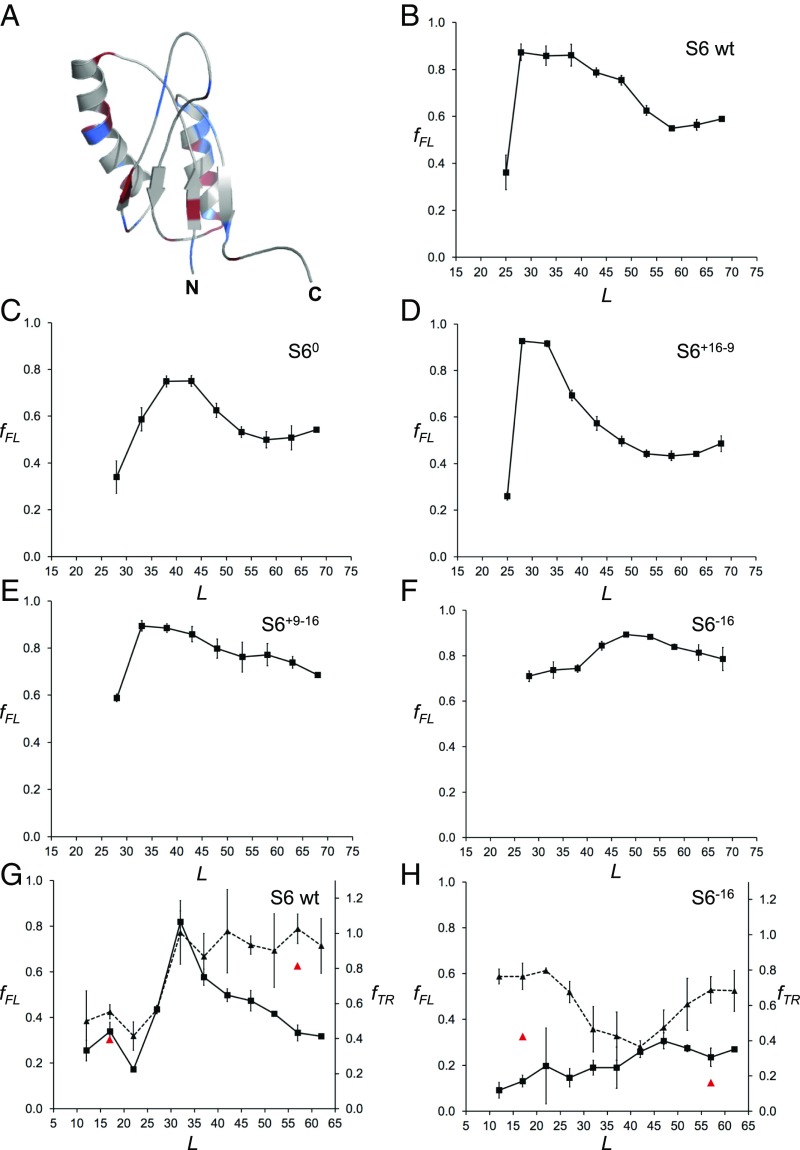
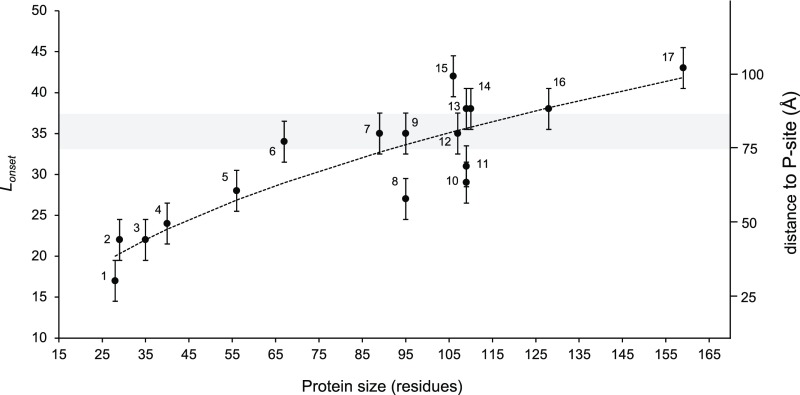
During the last five decades, studies of protein folding in dilute buffer solutions have produced a rich picture of this complex process. In the cell, however, proteins can start to fold while still attached to the ribosome (cotranslational folding) and it is not yet clear how the ribosome affects the folding of protein domains of different sizes, thermodynamic stabilities, and net charges. Here, by using arrest peptides as force sensors and on-ribosome pulse proteolysis, we provide a comprehensive picture of how the distance from the peptidyl transferase center in the ribosome at which proteins fold correlates with protein size. Moreover, an analysis of a large collection of mutants of the Escherichia coli ribosomal protein S6 shows that the force exerted on the nascent chain by protein folding varies linearly with the thermodynamic stability of the folded state, and that the ribosome environment disfavors folding of domains of high net-negative charge.
Keywords: arrest peptide; protein folding; pulse proteolysis; ribosome.
Conflict of interest statement
The authors declare no conflict of interest.
Figures
Similar articles
-
Cotranslational Folding of Proteins on the Ribosome.Biomolecules. 2020 Jan 7;10(1):97. doi: 10.3390/biom10010097. Biomolecules. 2020. PMID: 31936054 Free PMC article. Review.
-
Quantitative determination of ribosome nascent chain stability.Proc Natl Acad Sci U S A. 2016 Nov 22;113(47):13402-13407. doi: 10.1073/pnas.1610272113. Epub 2016 Nov 7. Proc Natl Acad Sci U S A. 2016. PMID: 27821780 Free PMC article.
-
A switch from α-helical to β-strand conformation during co-translational protein folding.EMBO J. 2022 Feb 15;41(4):e109175. doi: 10.15252/embj.2021109175. Epub 2022 Jan 7. EMBO J. 2022. PMID: 34994471 Free PMC article.
-
The ribosome destabilizes native and non-native structures in a nascent multidomain protein.Protein Sci. 2017 Jul;26(7):1439-1451. doi: 10.1002/pro.3189. Epub 2017 May 19. Protein Sci. 2017. PMID: 28474852 Free PMC article.
-
Folding of a nascent peptide on the ribosome.Prog Nucleic Acid Res Mol Biol. 2001;66:41-66. doi: 10.1016/s0079-6603(00)66026-9. Prog Nucleic Acid Res Mol Biol. 2001. PMID: 11051761 Review.
Cited by
-
Unveiling the Potential of B3O3 Nanoflake as Effective Transporter for the Antiviral Drug Favipiravir: Density Functional Theory Analysis.Molecules. 2023 Dec 14;28(24):8092. doi: 10.3390/molecules28248092. Molecules. 2023. PMID: 38138581 Free PMC article.
-
Fluorescence Anisotropy Decays and Microscale-Volume Viscometry Reveal the Compaction of Ribosome-Bound Nascent Proteins.J Phys Chem B. 2021 Jun 24;125(24):6543-6558. doi: 10.1021/acs.jpcb.1c04473. Epub 2021 Jun 10. J Phys Chem B. 2021. PMID: 34110829 Free PMC article.
-
Mechanisms of Cotranslational Protein Maturation in Bacteria.Front Mol Biosci. 2021 May 25;8:689755. doi: 10.3389/fmolb.2021.689755. eCollection 2021. Front Mol Biosci. 2021. PMID: 34113653 Free PMC article. Review.
-
Cotranslational Folding of Proteins on the Ribosome.Biomolecules. 2020 Jan 7;10(1):97. doi: 10.3390/biom10010097. Biomolecules. 2020. PMID: 31936054 Free PMC article. Review.
-
Mechanochemistry in Translation.Biochemistry. 2019 Nov 26;58(47):4657-4666. doi: 10.1021/acs.biochem.9b00260. Epub 2019 Jun 11. Biochemistry. 2019. PMID: 31134795 Free PMC article. Review.
References
-
- Anfinsen CB. Principles that govern the folding of protein chains. Science. 1973;181:223–230. - PubMed
-
- Holtkamp W, et al. Cotranslational protein folding on the ribosome monitored in real time. Science. 2015;350:1104–1107. - PubMed
-
- Kim SJ, et al. Protein folding. Translational tuning optimizes nascent protein folding in cells. Science. 2015;348:444–448. - PubMed
-
- Trovato F, O’Brien EP. Insights into cotranslational nascent protein behavior from computer simulations. Annu Rev Biophys. 2016;45:345–369. - PubMed
-
- O’Brien EP, Christodoulou J, Vendruscolo M, Dobson CM. New scenarios of protein folding can occur on the ribosome. J Am Chem Soc. 2011;133:513–526. - PubMed
Publication types
MeSH terms
Substances
LinkOut - more resources
Full Text Sources
Other Literature Sources
