. 2018 Nov 12;92(23):e01042-18.
doi: 10.1128/JVI.01042-18. Print 2018 Dec 1.

The Nucleolar Protein LYAR Facilitates Ribonucleoprotein Assembly of Influenza A Virus

Affiliations

The Nucleolar Protein LYAR Facilitates Ribonucleoprotein Assembly of Influenza A Virus

Cha Yang et al. J Virol. .

Abstract

Influenza A viral ribonucleoprotein (vRNP) is responsible for transcription and replication of the viral genome in infected cells and depends on host factors for its functions. Identification of the host factors interacting with vRNP not only improves understanding of virus-host interactions but also provides insights into novel mechanisms of viral pathogenicity and the development of new antiviral strategies. Here, we have identified 80 host factors that copurified with vRNP using affinity purification followed by mass spectrometry. LYAR, a cell growth-regulating nucleolar protein, has been shown to be important for influenza A virus replication. During influenza A virus infection, LYAR expression is increased and partly translocates from the nucleolus to the nucleoplasm and cytoplasm. Furthermore, LYAR interacts with RNP subunits, resulting in enhancing viral RNP assembly, thereby facilitating viral RNA synthesis. Taken together, our studies identify a novel vRNP binding host partner important for influenza A virus replication and further reveal the mechanism of LYAR regulating influenza A viral RNA synthesis by facilitating viral RNP assembly.IMPORTANCE Influenza A virus (IAV) must utilize the host cell machinery to replicate, but many of the mechanisms of IAV-host interaction remain poorly understood. Improved understanding of interactions between host factors and vRNP not only increases our basic knowledge of the molecular mechanisms of virus replication and pathogenicity but also provides insights into possible novel antiviral targets that are necessary due to the widespread emergence of drug-resistant IAV strains. Here, we have identified LYAR, a cell growth-regulating nucleolar protein, which interacts with viral RNP components and is important for efficient replication of IAVs and whose role in the IAV life cycle has never been reported. In addition, we further reveal the role of LYAR in viral RNA synthesis. Our results extend and improve current knowledge on the mechanisms of IAV transcription and replication.

Keywords: LYAR; host factor; influenza A virus; vRNP; viral RNP assembly.


Figures

FIG 1
FIG 1
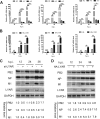
Effects of silenced candidate proteins on IAV replication and polymerase activity. (A) Effects of candidate proteins on virus replication. A549 cells transfected with the indicated siRNAs were infected with the PR8 H1N1 virus (MOI of 0.1) for 24 h, and virus titers were determined by plaque assay on MDCK cells. (B) Effects of candidate proteins on polymerase activity. HEK293T cells were transfected with the indicated siRNAs and viral RNP reconstitution plasmids (pCDNA-3.1-PB1, -PB2, -PA, and -NP, pPolI-Luc, and Renilla); polymerase activity was measured at 24 h posttransfection. (C) The silencing efficiency of the indicated siRNAs was determined by real-time PCR. For all experiments, the data are presented as the means ± SD from three independent experiments (*, P < 0.05; **, P < 0.01; ***, P < 0.001; all by two-tailed Student's t test).
FIG 2
FIG 2
Interactions between LYAR and viral RNP components. (A and B) The interactions between LYAR and RNP components in transfected cells. HEK293T cells transfected with the indicated plasmids were lysed at 24 h posttransfection. The cell lysates were left untreated (A) or were treated with 100 U RNase A (B) at 37°C for 1 h. Co-IP was performed using an anti-HA antibody, followed by Western blotting to detect the viral proteins and LYAR and PLSCR1 by using anti-HA and anti-Flag antibodies, respectively (asterisks indicate specific PB2 or PB1 detected). (C) The interactions between endogenous LYAR and RNP components in IAV-infected cells. A549 cells were infected with the PR8 H1N1 virus (MOI of 2) for 10 h, cells were treated as described above, and Co-IP was performed using an anti-LYAR mouse antibody or mouse IgG. The endogenous LYAR and coprecipitated viral proteins were detected by using an anti-LYAR antibody and the antibodies against individual viral proteins, respectively. Mouse IgG served as the negative control. (D) The interactions between reconstituted vRNP and LYAR or its truncation mutants. HEK293T cells were cotransfected with the vRNP reconstitution plasmids (pCDNA 3.1-PB1, -PB2, and -PA, pPolI-eGFP, HA-NP, or pCAGGS-HA) along with Flag-LYAR (WT), Flag-LYAR N-terminal domain (NTD; amino acids 1 to 167), or Flag-LYAR C-terminal domain (CTD; amino acids 168 to 379). Co-IP was performed using an anti-HA antibody to immunoprecipitate PA and LYAR or its truncation mutants. For all of these experiments, GAPDH served as the loading control.
FIG 3
FIG 3
Colocalization of LYAR and RNP components. (A) Colocalization of LYAR and RNP components in transfected cells. HeLa cells cultured on slides were cotransfected with Flag-LYAR and HA-PA, -PB1, -PB2, -NP, or vector (HA). Cells were fixed at 24 h posttransfection and stained for LYAR (red) and viral proteins (green) or endogenous NPM1 (green) using the anti-Flag mouse antibodies and anti-HA rabbit antibodies or anti-NPM1 rabbit antibodies, followed by immunostaining with the Alexa Fluor 594-conjugated AffiniPure goat anti-mouse secondary antibodies and Alexa Fluor 488-conjugated AffiniPure goat anti-rabbit antibodies. DAPI was used to stain for the nucleus (blue). The boxed region was enlarged and is shown on the right. (B and C) Colocalization of LYAR and RNP components in IAV-infected cells. HeLa cells (B) and A549 cells (C) were left uninfected (mock) or infected with the PR8 H1N1 virus (MOI of 2) for 6 h, and confocal microscopy was performed using an anti-LYAR mouse antibody (red) and anti-NP rabbit antibody (green) or anti-NPM1 rabbit antibody (green), followed by immunostaining with the Alexa Fluor 594-conjugated AffiniPure goat anti-mouse secondary antibodies and Alexa Fluor 488-conjugated AffiniPure goat anti-rabbit antibodies. The nuclei were visualized by DAPI (blue). For all of these experiments, fluorescence was examined with a confocal microscope (LSM 880; Zeiss). Images are representative of three independent experiments. Scale bar, 5 μm.
FIG 4
FIG 4
Expression level of LYAR during IAV infection. A549 cells were left uninfected or were infected with the PR8 H1N1 virus (A to C) or HM H5N1 virus (D to F) at an MOI of 0.01. Samples were collected at 0, 6, 12, 24, and 36 hpi, followed by qRT-PCR and Western blotting to determine the mRNA (A and B and D and E) and protein levels (C and F) of NP and LYAR, respectively. The mRNA level was normalized to the 18S rRNA level. The data are presented as means ± SD from three independent experiments (*, P < 0.05; **, P < 0.01; ***, P < 0.001; all by two-tailed Student's t test). For Western blot analysis, GAPDH was used as a loading control. The band intensities were quantified by ImageJ (NIH), and the relative LYAR levels (LYAR/GAPDH) are shown below.
FIG 5
FIG 5
Effect of LYAR knockdown on IAV replication. (A) The silencing efficiency of LYAR-specific siRNAs. A549 cells were transfected with three individual siRNAs targeted to LYAR (si-1, si-2, and si-3) or nontarget siRNA (NC) for 36 h, followed by Western blotting to detect the protein level of LYAR. GAPDH served as a loading control. The band intensities were quantified with ImageJ, and the relative LYAR levels are shown below. (B) The effect of si-LYAR on A549 cell viability. A549 cells were treated with LYAR siRNA (si-2 and si-3) or negative-control siRNA. Cell viability was measured by CCK-8 assay at the indicated time points posttransfection. (C and D) Growth curves of IAV in LYAR-silenced and mock-treated cells. A549 cells were transfected with siRNA targeted to LYAR (si-2 and si-3) or nontarget siRNA (NC) for 24 h and then infected with the PR8 H1N1 virus (C) or HM H5N1 (D) virus at an MOI of 0.01. Cell supernatants were collected at the indicated time points postinfection. Virus titers were determined by plaque assay on MDCK cells (means ± SD from three independent experiments) (*, P < 0.05; **, P < 0.01; ***, P < 0.001; all by two-tailed Student's t test). (E) Generation of LYAR-KO A549 cells. LYAR-KO A549 cells were generated by using the CRISPR/Cas9 system. LYAR knockout was confirmed by Western blotting with an anti-LYAR mouse antibody. (F and G) Virus replication in LYAR-KO A549 cells. LYAR-KO A549 cells (KO) or wild-type A549 cells (WT) were infected with either PR8 H1N1 virus (F) or HM H5N1 virus (G) at an MOI of 0.01. Virus titers were determined by plaque assay on MDCK cells (means ± SD from three independent experiments) (*, P < 0.05; **, P < 0.01; ***, P < 0.001; all by two-tailed Student's t test).
FIG 6
FIG 6
Effect of LYAR on IAV RNA synthesis. (A) The effect of LYAR silencing on IAV RNA synthesis during infection. A549 cells were transfected with LYAR siRNA (si-2 and si-3) or negative-control siRNA (NC) and then infected with the PR8 H1N1 virus (MOI of 0.01). Samples were collected at 12, 24, and 36 hpi. The levels of NP RNAs (vRNA, cRNA, and mRNA) were determined by qRT-PCR. The viral RNA levels were normalized to the 18S rRNA level (means ± SD from three independent experiments) (*, P < 0.05; **, P < 0.01; ***, P < 0.001; all by two-tailed Student's t test). (B) The effect of LYAR overexpression on NP RNA synthesis during infection. A549 cells were transfected with HA-LYAR or HA, and other procedures were the same as those described for panel A (means ± SD from three independent experiments) (*, P < 0.05; **, P < 0.01; ***, P < 0.001; all by two-tailed Student's t test). (C and D) The effect of LYAR silencing (C) and overexpression (D) on IAV protein synthesis. A549 cells were treated and infected as described above, and Western blotting was done to determine the protein levels of PB2, NP, M1, and LYAR. GAPDH was used as a loading control. The band intensities were quantified with ImageJ, and the relative PB2, NP, and M1 levels (PB2, NP, or M1/GAPDH) are shown below.
FIG 7
FIG 7
Effect of LYAR on IAV primary transcription and genome replication. (A and B) Effect of LYAR silencing on NP RNA synthesis in cells treated with CHX or left untreated. A549 cells were mock treated with DMSO (A) or treated with 100 μg/ml CHX (B) for 1 h and then infected with the PR8 H1N1 virus (MOI of 1.0). NP vRNA, cRNA, and mRNA levels in mock-treated cells and vRNA and mRNA levels in CHX-treated cells were measured at 4, 6, and 8 hpi. NP RNAs levels were normalized to the 18S rRNA level (means ± SD from three independent experiments) (*, P < 0.05; **, P < 0.01; ***, P < 0.001; all by two-tailed Student's t test). (C) A comparison of NP mRNA levels in cells infected with virus for 8 h in the presence or absence of CHX (means ± SD from three independent experiments) (**, P < 0.01 by two-tailed Student's t test).
FIG 8
FIG 8
Effect of LYAR on IAV polymerase activity. (A) Effect of LYAR silencing on viral polymerase activity. HEK293T cells were cotransfected with vRNP reconstitution plasmids and Renilla together with si-LYAR (si-2 and si-3) or si-NC. Luciferase activity was measured at 24 h posttransfection, and Renilla luciferase was used as an internal control (means ± SD from three independent experiments) (***, P < 0.001 by two-tailed Student's t test). (B) Effect of LYAR overexpression on viral polymerase activity. Cells were treated as described for panel A, except cells were also transfected with HA-LYAR (0.25, 0.5, and 1.0 μg) (means ± SD from three independent experiments) (**, P < 0.01 by two-tailed Student's t test). (C) Effects of LYAR silencing and overexpression on the expression of RNP components. HEK293T cells were transfected with the indicated plasmids as described above, except cells were transfected with pPolI-eGFP instead of pPolI-luc. Protein expression of individual RNP components LYAR and GFP was analyzed by Western blotting. GAPDH was used as a loading control. (D) The effect of LYAR silencing on HEK293T cell viability. HEK293T cells were treated with si-LYAR (si-2 and si-3) or si-NC, and cell viability was measured by using CCK-8 assay at the indicated time points posttransfection.
FIG 9
FIG 9
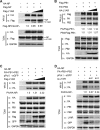
Effect of LYAR on viral RNP assembly. (A) The effect of LYAR on NP oligomerization. HEK293T cells were transfected with Flag-LYAR (0, 0.5, and 1.0 μg), Flag-NP, and HA-NP or HA. Cells were then lysed at 24 h posttransfection, and Co-IP was performed using an anti-HA antibody followed by Western blotting. The band intensities were quantified, and relative precipitated Flag-NP/HA-NP ratios are shown below. (B) Effect of LYAR on 3P formation. HEK293T cells were transfected with pCDNA3.1-PA, pCDNA3.1-PB2, HA-LYAR (0, 0.5, 1.0 μg), and Flag-PB1 or Flag. Cells were then treated as described above, and Co-IP was performed using an anti-Flag antibody. The immune complexes were analyzed by Western blotting using antibodies against PA, PB2, and Flag, respectively. The band intensities were quantified, and relative precipitated PA/Flag-PB1 and PB2/Flag-PB1 ratios are shown below. (C and D) The effect of LYAR on vRNP assembly. HEK293T cells were transfected with the vRNP reconstitution plasmids together with Flag-LYAR (0, 0.5, and 1.0 μg) (C) or si-LYAR (D), and then Co-IP was performed using an anti-HA antibody followed by Western blotting. The relative precipitated PA/HA-NP ratios are shown below. For all experiments, the band intensities were analyzed using the software ImageJ (NIH). GAPDH was used as a loading control.
FIG 10
FIG 10
Effect of LYAR on vRNP nuclear export. (A and B) Confocal microscopy analysis of the nucleocytoplasmic distribution of NP in virus-infected LYAR knockdown cells. A549 cells transfected with si-LYAR (si-3) or si-NC were infected with the PR8 H1N1 virus (MOI of 2.0). At 7 hpi, NP was detected by IFA using an anti-NP antibody (red), and images were acquired by confocal microscopy (LSM 510; Zeiss). Scale bar, 20 μM. Images are representative of three independent experiments. Six images in a random field of view from each sample were scored by the Cell Counter plugin of ImageJ (NIH). (B) The ratios of NP nuclear-retained cells to total infected cells were analyzed from three independent experiments (means ± SD from three independent experiments) (***, P < 0.001 by two-tailed Student's t test). (C) Western blot analysis of the distribution of NP in the cytoplasmic and nuclear fractions in virus-infected LYAR knockdown cells. A549 cells were treated as described for panel A. Cells were harvested and subjected to nuclear and cytoplasmic fractionation. Western blotting using an anti-NP antibody to determine the NP content of the nuclear (Nuc) and cytoplasmic (Cyt) fractions (upper panel) and whole-cell lysates (WCL) (lower panel). The silencing efficiency of LYAR was also detected (right). Histone 3.1 was used as a nuclear loading control and marker and GAPDH as a cytosolic loading control and marker. The band intensities were analyzed by ImageJ (NIH), and the relative NP levels (NP/GAPDH or Histone 3.1) are shown below. (D and E) Confocal microscopy analysis of the nucleocytoplasmic distribution of vRNAs in virus-infected LYAR knockdown cells. A549 cells were transfected with si-LYAR (si-3) or si-NC and then were infected with the PR8 H1N1 virus (MOI of 2.0). At 7 hpi, cells were subjected to in situ hybridization assays using Quasar 570 (red)-labeled vRNA-specific probes targeting the M gene. The boxed region was enlarged and is shown on the right. Scale bar, 10 μm. Images are representative of three independent experiments. Six images in a random field of view from each sample were scored by the Cell Counter plugin of ImageJ (NIH). (E) The ratios of vRNA nuclear-retained cells to total infected cells were analyzed from three independent experiments (means ± SD from three independent experiments) (***, P < 0.001 by two-tailed Student's t test).

Similar articles

Cited by

References

    1. Molinari NA, Ortega-Sanchez IR, Messonnier ML, Thompson WW, Wortley PM, Weintraub E, Bridges CB. 2007. The annual impact of seasonal influenza in the US: measuring disease burden and costs. Vaccine 25:5086–5096. doi:10.1016/j.vaccine.2007.03.046. - DOI - PubMed
    1. Simonsen L. 1999. The global impact of influenza on morbidity and mortality. Vaccine 17(Suppl 1):S3–S10. doi:10.1016/S0264-410X(99)00099-7. - DOI - PubMed
    1. Cheng PY, Palekar R, Azziz-Baumgartner E, Iuliano D, Alencar AP, Bresee J, Oliva O, de Souza MF, Widdowson MA. 2015. Burden of influenza-associated deaths in the Americas, 2002-2008. Influenza Other Respir Viruses 9(Suppl 1):S13–S21. doi:10.1111/irv.12317. - DOI - PMC - PubMed
    1. Ryan J, Zoellner Y, Gradl B, Palache B, Medema J. 2006. Establishing the health and economic impact of influenza vaccination within the European Union 25 countries. Vaccine 24:6812–6822. doi:10.1016/j.vaccine.2006.07.042. - DOI - PubMed
    1. . 2013. Infectious Disease/CDC Update: Update on emerging infections: news from the Centers for Disease Control and Prevention. Evaluation of 11 commercially available rapid influenza diagnostic tests-United States, 2011-2012. Ann Emerg Med 61:573–577. - PubMed

Publication types

MeSH terms

LinkOut - more resources