Tumor Necrosis Factor Alpha Induces Reactivation of Human Cytomegalovirus Independently of Myeloid Cell Differentiation following Posttranscriptional Establishment of Latency
- PMID: 30206173
- PMCID: PMC6134100
- DOI: 10.1128/mBio.01560-18
Tumor Necrosis Factor Alpha Induces Reactivation of Human Cytomegalovirus Independently of Myeloid Cell Differentiation following Posttranscriptional Establishment of Latency
Abstract
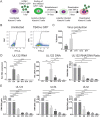
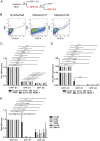
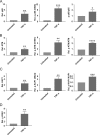
We used the Kasumi-3 model to study human cytomegalovirus (HCMV) latency and reactivation in myeloid progenitor cells. Kasumi-3 cells were infected with HCMV strain TB40/Ewt-GFP, flow sorted for green fluorescent protein-positive (GFP+) cells, and cultured for various times to monitor establishment of latency, as judged by repression of viral gene expression (RNA/DNA ratio) and loss of virus production. We found that, in the vast majority of cells, latency was established posttranscriptionally in the GFP+ infected cells: transcription was initially turned on and then turned off. We also found that some of the GFP- cells were infected, suggesting that latency might be established in these cells at the outset of infection. We were not able to test this hypothesis because some GFP- cells expressed lytic genes and thus it was not possible to separate them from GFP- quiescent cells. In addition, we found that the pattern of expression of lytic genes that have been associated with latency, including UL138, US28, and RNA2.7, was the same as that of other lytic genes, indicating that there was no preferential expression of these genes once latency was established. We confirmed previous studies showing that tumor necrosis factor alpha (TNF-α) induced reactivation of infectious virus, and by analyzing expression of the progenitor cell marker CD34 as well as myeloid cell differentiation markers in IE+ cells after treatment with TNF-α, we showed that TNF-α induced transcriptional reactivation of IE gene expression independently of differentiation. TNF-α-mediated reactivation in Kasumi-3 cells was correlated with activation of NF-κB, KAP-1, and ATM.IMPORTANCE HCMV is an important human pathogen that establishes lifelong latent infection in myeloid progenitor cells and reactivates frequently to cause significant disease in immunocompromised people. Our observation that viral gene expression is first turned on and then turned off to establish latency suggests that there is a host defense, which may be myeloid cell specific, responsible for transcriptional silencing of viral gene expression. Our observation that TNF-α induces reactivation independently of differentiation provides insight into molecular mechanisms that control reactivation.
Keywords: cytomegalovirus; latency; reactivation.
Copyright © 2018 Forte et al.
Figures


Similar articles
-
Human Cytomegalovirus US28 Ligand Binding Activity Is Required for Latency in CD34+ Hematopoietic Progenitor Cells and Humanized NSG Mice.mBio. 2019 Aug 20;10(4):e01889-19. doi: 10.1128/mBio.01889-19. mBio. 2019. PMID: 31431555 Free PMC article.
-
Latency-Associated Expression of Human Cytomegalovirus US28 Attenuates Cell Signaling Pathways To Maintain Latent Infection.mBio. 2017 Dec 5;8(6):e01754-17. doi: 10.1128/mBio.01754-17. mBio. 2017. PMID: 29208743 Free PMC article.
-
A myeloid progenitor cell line capable of supporting human cytomegalovirus latency and reactivation, resulting in infectious progeny.J Virol. 2012 Sep;86(18):9854-65. doi: 10.1128/JVI.01278-12. Epub 2012 Jul 3. J Virol. 2012. PMID: 22761372 Free PMC article.
-
Human cytomegalovirus: Latency and reactivation in the myeloid lineage.J Clin Virol. 2008 Mar;41(3):180-5. doi: 10.1016/j.jcv.2007.11.014. J Clin Virol. 2008. PMID: 18164651 Review.
-
Aspects of human cytomegalovirus latency and reactivation.Curr Top Microbiol Immunol. 2008;325:297-313. doi: 10.1007/978-3-540-77349-8_17. Curr Top Microbiol Immunol. 2008. PMID: 18637513 Review.
Cited by
-
Does reactivation of cytomegalovirus contribute to severe COVID-19 disease?Immun Ageing. 2021 Mar 12;18(1):12. doi: 10.1186/s12979-021-00218-z. Immun Ageing. 2021. PMID: 33712035 Free PMC article.
-
HCMV Antivirals and Strategies to Target the Latent Reservoir.Viruses. 2021 May 1;13(5):817. doi: 10.3390/v13050817. Viruses. 2021. PMID: 34062863 Free PMC article. Review.
-
Human Cytomegalovirus UL138 Interaction with USP1 Activates STAT1 in infection.bioRxiv [Preprint]. 2023 Feb 7:2023.02.07.527452. doi: 10.1101/2023.02.07.527452. bioRxiv. 2023. Update in: PLoS Pathog. 2023 Jun 8;19(6):e1011185. doi: 10.1371/journal.ppat.1011185 PMID: 36798153 Free PMC article. Updated. Preprint.
-
Murine cytomegalovirus dissemination but not reactivation in donor-positive/recipient-negative allogeneic kidney transplantation can be effectively prevented by transplant immune tolerance.Kidney Int. 2020 Jul;98(1):147-158. doi: 10.1016/j.kint.2020.01.034. Epub 2020 Feb 21. Kidney Int. 2020. PMID: 32471635 Free PMC article.
-
Cytomegalovirus Latency and Reactivation: An Intricate Interplay With the Host Immune Response.Front Cell Infect Microbiol. 2020 Mar 31;10:130. doi: 10.3389/fcimb.2020.00130. eCollection 2020. Front Cell Infect Microbiol. 2020. PMID: 32296651 Free PMC article. Review.
References
-
- Gilbert GL, Hayes K, Hudson IL, James J. 1989. Prevention of transfusion-acquired cytomegalovirus infection in infants by blood filtration to remove leucocytes. Neonatal Cytomegalovirus Infection Study Group. Lancet i:1228–1231. - PubMed
-
- Sindre H, Tjøonnfjord GE, Rollag H, Ranneberg-Nilsen T, Veiby OP, Beck S, Degré M, Hestdal K. 1996. Human cytomegalovirus suppression of and latency in early hematopoietic progenitor cells. Blood 88:4526–4533. - PubMed
Publication types
MeSH terms
Substances
Grants and funding
LinkOut - more resources
Full Text Sources
Other Literature Sources
Molecular Biology Databases
Research Materials
Miscellaneous

