. 2018 Oct;20(10):1181-1192.
doi: 10.1038/s41556-018-0178-0. Epub 2018 Sep 10.

BAP1 links metabolic regulation of ferroptosis to tumour suppression

Affiliations

BAP1 links metabolic regulation of ferroptosis to tumour suppression

Yilei Zhang et al. Nat Cell Biol. 2018 Oct.

Abstract

The roles and regulatory mechanisms of ferroptosis (a non-apoptotic form of cell death) in cancer remain unclear. The tumour suppressor BRCA1-associated protein 1 (BAP1) encodes a nuclear deubiquitinating enzyme to reduce histone 2A ubiquitination (H2Aub) on chromatin. Here, integrated transcriptomic, epigenomic and cancer genomic analyses link BAP1 to metabolism-related biological processes, and identify cystine transporter SLC7A11 as a key BAP1 target gene in human cancers. Functional studies reveal that BAP1 decreases H2Aub occupancy on the SLC7A11 promoter and represses SLC7A11 expression in a deubiquitinating-dependent manner, and that BAP1 inhibits cystine uptake by repressing SLC7A11 expression, leading to elevated lipid peroxidation and ferroptosis. Furthermore, we show that BAP1 inhibits tumour development partly through SLC7A11 and ferroptosis, and that cancer-associated BAP1 mutants lose their abilities to repress SLC7A11 and to promote ferroptosis. Together, our results uncover a previously unappreciated epigenetic mechanism coupling ferroptosis to tumour suppression.


Figures
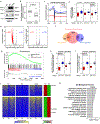
Figure 1.
Figure 1.. Genome-wide analyses link BAP1 to metabolism-related biological processes.
a, Restoring BAP1 WT but not C91A in UMRC6 cells decreased H2Aub level. Experiment was repeated four times independently with similar results. b, Box plot showing fold changes of H2Aub occupancies in BAP1 WT or C91A compared with empty vector (EV) cells. Two-tailed unpaired Student’s t-test. n=24648 counts of promoter whose H2Aub occupancy (RPKM) is higher than 0.5 in all 3 samples. c, Average genome-wide occupancies of H2Aub in indicated cells. TSS: transcription start site; TES: transcription end site. d, Box plots of the log2 fold changes of H2Aub occupancies in promoter, gene body, and intergenic regions in BAP1 WT or C91A compared with EV cells. n=25772 for promoter and gene body, which is the total gene count in human reference. n=14237, which is the total number of intergenic regions. e, Volcano plots of H2Aub ChIP-seq data for BAP1 WT or C91A compared with EV cells. The red and blue dots represent genes with an at least 1.6-fold decrease or increase of H2Aub occupancies in BAP1 WT (left) or C91A (right) compared with EV cells. f, Venn diagram showing the overlap between 5837 genes with decreased H2Aub occupancies and 1700 differentially expressed genes (FC > 1.5, FDR < 0.05) upon restoring BAP1 in UMRC6 cells. g, GSEA showing that the 101 genes with > 2.5-fold H2Aub reduction were positively enriched in BAP1-upregulated genes. h, i, Box plots of log2 fold changes of H2Aub occupancies in promoter and gene body regions for the 187 genes (h) and 354 genes (i) as shown in Fig. 1f. j, Left 3 panels; heatmaps showing the H2Aub profile around the TSS of 187 downregulated and 354 upregulated genes (see Fig. 1f) in EV, BAP1 WT and C91A cells in decreasing order. Right panel, heatmap showing expression levels of the corresponding genes in EV and BAP1 WT cells. k, GO analysis for the 187 downregulated genes. Top annotation clusters are shown according to their enrichment scores [−log10 (p-value)]. *, positive regulation of glucose import in response to insulin stimulus. Fisher Exact test. Box and whisker plots show centre line at median, box limits at 25th/75th centiles and whiskers ±1.5× interquartile range (IQR). Unprocessed blots in Supplementary Fig. 7.
Figure 2.
Figure 2.. Cancer genomic analyses link SLC7A11 to BAP1-mediated tumor suppression in human cancers.
a, The pipeline of identifying relevant BAP1 target genes in cancer. b, e, The scatter plots showing the inverse correlation of BAP1 and SLC7A11 expression in different cancer types. KIRC, n=606 independent samples; KIPR, n=323 independent samples, UVM, n=80 independent samples, PCPG, n=187 independent samples, BRCA, n=1218 independent samples. c, g, i, The box plots showing the comparison of SLC7A11 or BAP1 expression levels in normal tissues (N) and corresponding tumor (T) samples. KIRC, n=606 independent samples; KIRP, n=323 independent samples; Normal kidney, n=28 independent samples; PCPG, n=187 independent samples; Normal nerve, n=278 independent samples; BRCA, n=1218 independent samples; Normal breast, n=179 independent samples. d, Kaplan-Meier plots of KIRC patients stratified by SLC7A11 expression levels. f, Immunoblotting analyses of BAP1 and SLC7A11 protein levels in different cancer cell lines. Experiment was repeated twice independently with similar results. h, Bar graphs showing the frequencies of BAP1 genetic alterations in the indicated tumor types. The data are integrated from cBioPortal (http://www.cbioportal.org/), and the data sources for each column (left to right) are: TCGA, Provisional; IRC, Nat Genet 2014; TCGA, Provisional; TCGA, Nature 2013; U Tokyo, Nat Genet 2013; BGI, Nat Genet 2012; TCGA, Provisional; Sanger, Nature 2012; TCGA, Cell 2015; British Columbia, Nature 2012; TCGA, Provisional; TCGA, Nature 2012; Broad, Nature 2012; TCGA, Provisional. j, k, Kaplan-Meier plots of KIRP (j) and UVM (k) patients stratified by SLC7A11 expression levels. l, Kaplan-Meier plots of UVM patients stratified by BAP1 expression levels. m, n, Kaplan-Meier plots of KIRP (m) or UVM (n) patients stratified by unsupervised clustering on BAP1 and SLC7A11 expression. Group 1 has higher BAP1 and lower SLC7A11 expression, while Group 2 has lower BAP1 and higher SLC7A11 expression. Pearson’s correlation (two-sided) analysis was used in b and e. Two-tailed unpaired Student’s t-test was used in c, g and i. Log-rank Mantel-Cox test was used in d, j, k, l, m and n. Detailed statistical tests were described in Methods. Scanned images of unprocessed blots are shown in Supplementary Fig. 7.
Figure 3.
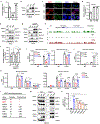
Figure 3.. BAP1 suppresses SLC7A11 expression and reduces H2Aub occupancy on the SLC7A11 promoter.
a, b, SLC7A11 expression levels in indicated UMRC6 cells were measured by RT-PCR (a) and Western blotting (b). Error bars are mean ± s.d., n = 3 independent repeats (a). Experiment was repeated four times independently with similar results (d). c, BAP1 (red) and SLC7A11 (green) expression and localization in indicated cells were analyzed by immunofluorescence. Cell nuclei were labeled by DAPI (blue) staining. Scale bar, 10 µm. Experiment was repeated twice independently with similar results. d, e, mRNA and protein levels of indicated genes in indicated 786-O cells were measured by RT-PCR (d) and Western blotting (e). Error bars are mean ± s.d., n = 3 independent repeats (d). Experiment was repeated three times independently with similar results (e). f, g, mRNA and protein levels of indicated genes in indicated 786-O cells were measured by RT-PCR (f) and Western blotting (g). Error bars are mean ± s.d., n = 3 independent repeats (f). Experiment was repeated twice independently with similar results (g). h, H2Aub ChIP-Seq occupancy profiles at the SLC7A11 loci in indicated UMRC6 cells. i, ChIP-qPCR confirming the lower H2Aub binding on the SLC7A11 promoter and selected exon regions in BAP1 WT cells than in EV or BAP1 C91A cells. Error bars are mean ± s.d., n = 3 independent repeats. j, ChIP-qPCR showing the increased H2Aub binding on the SLC7A11 promoter upon BAP1 deficiency in 786-O cells. Error bars are mean ± s.d., n = 3 independent repeats. k, ChIP-qPCR analysis of RNA polymerase II (Pol II), S5-CTD, and S2-CTD binding on the SLC7A11 promoter and selected exon regions. Error bars are mean ± s.d., n = 3 independent repeats. l, Lists of BAP1 binding proteins identified by mass spectrometry. m, Interactions between indicated proteins and BAP1 were verified by Western blotting in indicated cells. Experiment was repeated twice independently with similar results. n, Bar graph showing the binding of PR-DUB proteins on the SLC7A11 promoter by ChIP-qPCR. Error bars are mean ± s.d., n = 3 independent repeats. All P values were calculated using two-tailed unpaired Student’s t-test. Detailed statistical tests were described in Methods. Scanned images of unprocessed blots are shown in Supplementary Fig. 7.
Figure 4.
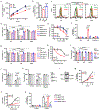
Figure 4.. BAP1 suppresses SLC7A11-mediated cystine uptake and promotes ferroptosis.
a, Cystine uptake levels were measured in indicated cells. b, Bar graph showing intracellular GSH levels in indicated cells. c, Lipid peroxidation was assessed by flow cytometry after C11-BODIPY staining in indicated cells. Experiment was repeated three times independently with similar results. d, f, Bar graph showing cell viability in indicated cells treated with ROS (100 µM TBH) (d) or 20 µM erastin (f) combined with 5 µM Z-VAD-fmk (Z-VAD), 2 µM Necrostatin-1s (Nec-1s), 2 µM ferrostatin-1 (Ferr-1), or 100 µM deferoxamine (DFO). e, Cell viability in indicated cells was measured after treatment with different concentrations of erastin for 30 hr. g, Cell death was measured in indicated cells after treatment with Ferr-1 (2 µM) and erastin (20 µM) for 24 hr. h, Cell viability of indicated cells was measured upon culturing in cystine-low (2 µM cystine) medium for indicated durations. i, Cell viability of indicated cells was measured after culturing in cystine-low medium + Ferr-1 (2 µM) for 48 hr. j, k, Cell viability was measured in BAP1 KO 786-O cells treated with erastin (10 µM) for 24 hr (j) or cultured in cystine-low medium + Ferr-1 (2 µM) for 24 hr (k). l, Western blotting analysis of BAP1 expression in Bap1 WT and KO MEFs. Experiment was repeated twice independently with similar results. m, n, Erastin-induced cell death in Bap1 WT and KO MEFs at different time points (2 µM) (m) or at different concentrations after 8 hr of treatment (n). o, Cell death was measured in BAP1 KO 786-O cells restored with BAP1 WT or C91A mutant and treated with erastin (10 µM) for 24 hr. Error bars are mean ± s.d., n = 3 (a, b, d, f, h, j, m and n ) or 4 (e, g, i, and k) independent repeats. Two-way ANOVA analysis was performed in a, e, h, m and n. Two-tailed unpaired Student’s t-test in b, d, f, g, i, j, k and o. Detailed statistical tests were described in Methods. Scanned images of unprocessed blots are shown in Supplementary Fig. 7.
Figure 5.
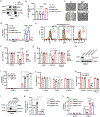
Figure 5.. BAP1 promotes ferroptosis through SLC7A11.
a, Western blotting analysis of BAP1 and SLC7A11 in the indicated cell lines. Experiment was repeated twice independently with similar results. b, Cystine uptake levels at 2 hr were measured in the indicated cells. c, Representative phase-contrast images of the indicated cells treated with 20 μM erastin for 24 hr. Scale bar, 100 µm. d, Bar graph showing cell death in the indicated cell lines upon erastin treatment. e, Lipid peroxidation in the indicated cells after treatment with 10 µM erastin for 24 hr was assessed by flow cytometry after C11-BODIPY staining. f, Bar graph showing cell death in the indicated cells induced by ROS (100 µM TBH, 16 hr). g, Bar graph showing viability of the indicated cells cultured in cystine-low (2 µM) medium for 2 days with or without 2 µM ferrostatin-1 (Ferr-1). h, Western blotting analysis of SLC7A11 expression in SLC7A11-knockdown cell lines. Experiment was repeated twice independently with similar results. i, Bar graph showing cell death of the indicated cells upon 20 µM erastin treatment for 30 hr. j, k, Bar graph showing viability of the indicated cells treated with erastin (10 µM) with or without 2 µM Ferr-1 for 30 hr (j), or cultured in cystine-low medium with or without 2 µM Ferr-1 for 2 days (k). l, m, Western blotting (l) and RT-PCR (m) analyses of SLC7A11 in BAP1 KO 786-O cell lines with SLC7A11-knockdown. Experiment was repeated twice independently with similar results (l). n, Bar graph showing cell death in the indicated cell lines after 10 µM erastin treatment for 24 hr. Error bars are mean ± s.d., n = 3 (b, d, f, g, i, j, m and n ) or 4 (k) independent repeats. All P values were calculated using two-tailed unpaired Student’s t-test. Detailed statistical tests were described in Methods. Scanned images of unprocessed blots are shown in Supplementary Fig. 7.
Figure 6.
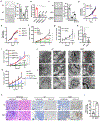
Figure 6.. BAP1 inhibits tumor development partly through SLC7A11 and ferroptosis.
a-c, Representative images showing colonies of the indicated cell lines on soft agar. Scale bar, 500 µm. Bar graph showing the relative number of colonies formed by the indicated cells in the soft agar assay. Error bars are mean ± s.d., n = 5 (a and c) or 6 (b) independent repeats. P value was calculated using two-tailed unpaired Student’s t-test. d, e, Cell growth assays of UMRC6 cells with indicated genotypes. Error bars are mean ± s.d., n = 3 (e) or 4 (d) independent repeats. P value was determined using two-way ANOVA analysis. f, g, Volumes of xenograft tumors with the indicated genotypes at different time points (weeks) after tumor cell injection Error bars are mean ± s.d., n = 5 independent repeats. P value was determined using two-way ANOVA analysis. h, Bar graph showing the weight of tumor xenografts from the indicted genotypes. Error bars are mean ± s.d., n = 5 independent repeats. P value was calculated using two-tailed unpaired Student’s t-test. i, Tumor volumes of xenografts tumors from 786-O cell lines with indicated genotypes at different weeks. Error bars are mean ± s.d., n = 5 (sgCon and sgBAP1+EV) or 8 (sgBAP1+WT and BAP1+C91A) independent repeats. P value was determined using two-way ANOVA analysis. j, Tumor xenografts from the EV and BAP1-restored cell lines were subjected to transmission electron microscopy. White arrow: mitochondria with obvious cristae. Red arrow: shrunken mitochondria. Scale bars: left, 2 µm; right, 500 nm. Experiment was repeated twice independently with similar results. k, Hematoxylin and eosin and immunohistochemical staining of tumor xenografts from the EV and BAP1-restored cell lines. Scale bar, 50 µm. Experiment was repeated twice independently with similar results. l, Percentage of 4HNE-positive stained cells per field. Error bars are mean ± s.d., n = 5 randomly selected high-power fields. P value was calculated using two-tailed unpaired Student’s t-test. m, Volumes of xenograft tumors with the indicated genotypes and treatments at different weeks. Error bars are mean ± s.d., n = 5 independent repeats. P value was determined using two-way ANOVA analysis. Detailed statistical tests were described in Methods.
Figure 7.
Figure 7.. Cancer-associated BAP1 mutations are defective in regulating SLC7A11 and ferroptosis.
a, Diagram showing BAP1 domain structure and mutated sites of cancer-associated BAP1 mutations generated in this study. UCH, ubiquitin C-terminal hydrolases; BA, BRCA1‑binding domain; H, HCF1‑binding domain; ULD, UCH37‑like domain; NLS, nuclear localization signal. b, Western blotting analysis of UMRC6 cells with re-expression of cancer-associated BAP1 mutants and WT BAP1 as indicated. Experiment was repeated twice independently with similar results. c, Relative mRNA levels of SLC7A11 in the indicated UMRC6 cells were determined by RT-PCR. Error bars are mean ± s.d., n = 3 independent repeats. P value was calculated using two-tailed unpaired Student’s t-test. d, e, Bar graphs showing the viability of the indicated cells treated with 20 µM erastin for 30 hr (e) or cultured in cystine-low (2 µM) medium for 2 days (e). Error bars are mean ± s.d., n = 4 independent repeats. P value was calculated using two-tailed unpaired Student’s t-test. f, Bar graph showing the relative number of colonies of the indicated cells in the soft agar assay. Error bars are mean ± s.d., n = 5 independent repeats. P value was calculated using two-tailed unpaired Student’s t-test. Detailed statistical tests were described in Methods. Scanned images of unprocessed blots are shown in Supplementary Fig. 7.

Comment in

Similar articles

Cited by

References

    1. Pavlova NN & Thompson CB The Emerging Hallmarks of Cancer Metabolism. Cell Metab 23, 27–47 (2016). - PMC - PubMed
    1. DeBerardinis RJ & Chandel NS Fundamentals of cancer metabolism. Sci Adv 2, e1600200 (2016). - PMC - PubMed
    1. Green DR, Galluzzi L & Kroemer G Cell biology. Metabolic control of cell death. Science 345, 1250256 (2014). - PMC - PubMed
    1. Boroughs LK & DeBerardinis RJ Metabolic pathways promoting cancer cell survival and growth. Nat Cell Biol 17, 351–359 (2015). - PMC - PubMed
    1. Jones RG & Thompson CB Tumor suppressors and cell metabolism: a recipe for cancer growth. Genes Dev 23, 537–548 (2009). - PMC - PubMed

Publication types

MeSH terms