Label-Free Prostate Cancer Detection by Characterization of Extracellular Vesicles Using Raman Spectroscopy
- PMID: 30157378
- PMCID: PMC6170952
- DOI: 10.1021/acs.analchem.8b01831
Label-Free Prostate Cancer Detection by Characterization of Extracellular Vesicles Using Raman Spectroscopy
Abstract
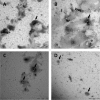
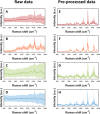
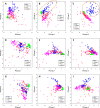
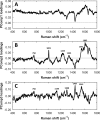
Mammalian cells release extracellular vesicles (EVs) into their microenvironment that travel the entire body along the stream of bodily fluids. EVs contain a wide range of biomolecules. The transported cargo varies depending on the EV origin. Knowledge of the origin and chemical composition of EVs can potentially be used as a biomarker to detect, stage, and monitor diseases. In this paper, we demonstrate the potential of EVs as a prostate cancer biomarker. A Raman optical tweezer was employed to obtain Raman signatures from four types of EV samples, which were red blood cell- and platelet-derived EVs of healthy donors and the prostate cancer cell lines- (PC3 and LNCaP) derived EVs. EVs' Raman spectra could be clearly separated/classified into distinct groups using principal component analysis (PCA) which permits the discrimination of the investigated EV subtypes. These findings may provide new methodology to detect and monitor early stage cancer.
Conflict of interest statement
The authors declare no competing financial interest.
Figures


Similar articles
-
Synchronized Rayleigh and Raman scattering for the characterization of single optically trapped extracellular vesicles.Nanomedicine. 2020 Feb;24:102109. doi: 10.1016/j.nano.2019.102109. Epub 2019 Oct 24. Nanomedicine. 2020. PMID: 31669420
-
Extracellular vesicles for liquid biopsy in prostate cancer: where are we and where are we headed?Prostate Cancer Prostatic Dis. 2017 Sep;20(3):251-258. doi: 10.1038/pcan.2017.7. Epub 2017 Apr 4. Prostate Cancer Prostatic Dis. 2017. PMID: 28374743 Free PMC article. Review.
-
Enabling Sensitive Phenotypic Profiling of Cancer-Derived Small Extracellular Vesicles Using Surface-Enhanced Raman Spectroscopy Nanotags.ACS Sens. 2020 Mar 27;5(3):764-771. doi: 10.1021/acssensors.9b02377. Epub 2020 Mar 17. ACS Sens. 2020. PMID: 32134252
-
Metabolomic Profiling of Extracellular Vesicles and Alternative Normalization Methods Reveal Enriched Metabolites and Strategies to Study Prostate Cancer-Related Changes.Theranostics. 2017 Aug 23;7(16):3824-3841. doi: 10.7150/thno.19890. eCollection 2017. Theranostics. 2017. PMID: 29109780 Free PMC article.
-
Single particle analysis: Methods for detection of platelet extracellular vesicles in suspension (excluding flow cytometry).Platelets. 2017 May;28(3):249-255. doi: 10.1080/09537104.2016.1260704. Epub 2016 Dec 29. Platelets. 2017. PMID: 28033028 Review.
Cited by
-
On an Affordable Approach towards the Diagnosis and Care for Prostate Cancer Patients Using Urine, FTIR and Prediction Machines.Diagnostics (Basel). 2022 Aug 30;12(9):2099. doi: 10.3390/diagnostics12092099. Diagnostics (Basel). 2022. PMID: 36140500 Free PMC article.
-
Extracellular Vesicle Preparation and Analysis: A State-of-the-Art Review.Adv Sci (Weinh). 2024 Aug;11(30):e2401069. doi: 10.1002/advs.202401069. Epub 2024 Jun 14. Adv Sci (Weinh). 2024. PMID: 38874129 Free PMC article. Review.
-
Identification of extracellular vesicles from their Raman spectra via self-supervised learning.Sci Rep. 2024 Mar 21;14(1):6791. doi: 10.1038/s41598-024-56788-7. Sci Rep. 2024. PMID: 38514697 Free PMC article.
-
Overview of extracellular vesicle characterization techniques and introduction to combined reflectance and fluorescence confocal microscopy to distinguish extracellular vesicle subpopulations.Neurophotonics. 2022 Apr;9(2):021903. doi: 10.1117/1.NPh.9.2.021903. Epub 2022 Apr 4. Neurophotonics. 2022. PMID: 35386596 Free PMC article. Review.
-
Spectroscopic profiling variations in extracellular vesicle biochemistry in a model of myogenesis.J Tissue Eng. 2021 May 31;12:20417314211022092. doi: 10.1177/20417314211022092. eCollection 2021 Jan-Dec. J Tissue Eng. 2021. PMID: 34104390 Free PMC article.
References
Publication types
MeSH terms
LinkOut - more resources
Full Text Sources
Other Literature Sources
Medical

