. 2018 Oct 19;293(42):16364-16375.
doi: 10.1074/jbc.RA118.004073. Epub 2018 Aug 28.

Yap/Taz mediates mTORC2-stimulated fibroblast activation and kidney fibrosis

Affiliations

Yap/Taz mediates mTORC2-stimulated fibroblast activation and kidney fibrosis

Yuan Gui et al. J Biol Chem. .

Abstract

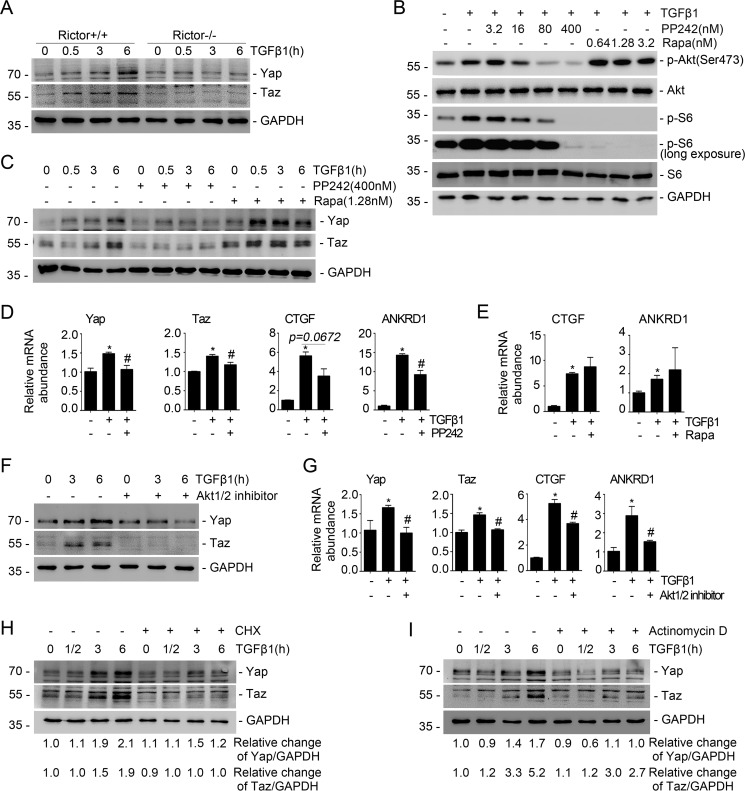
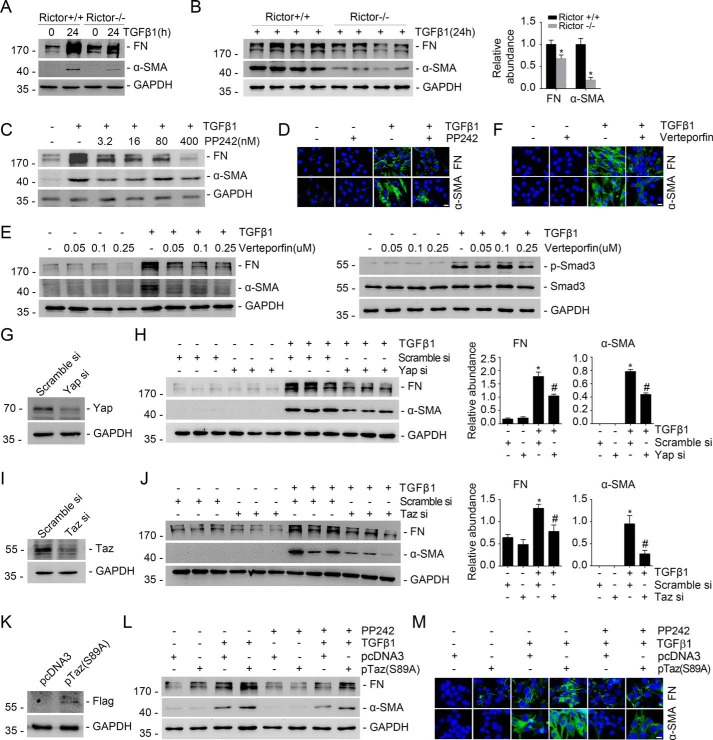
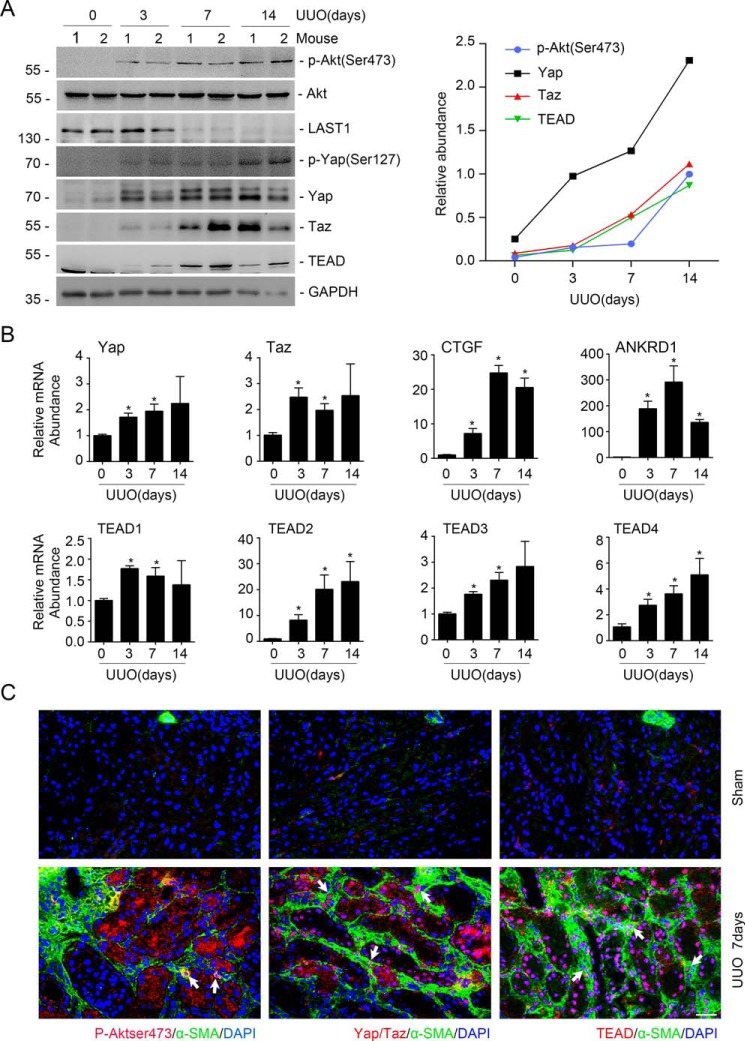
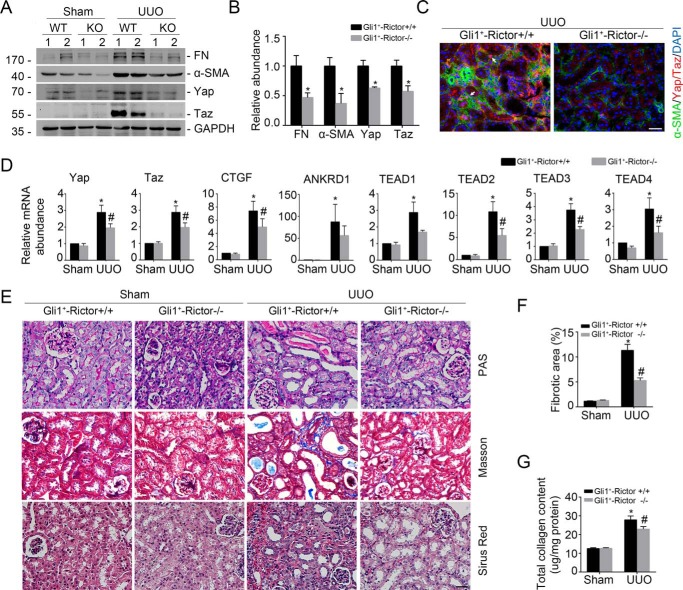
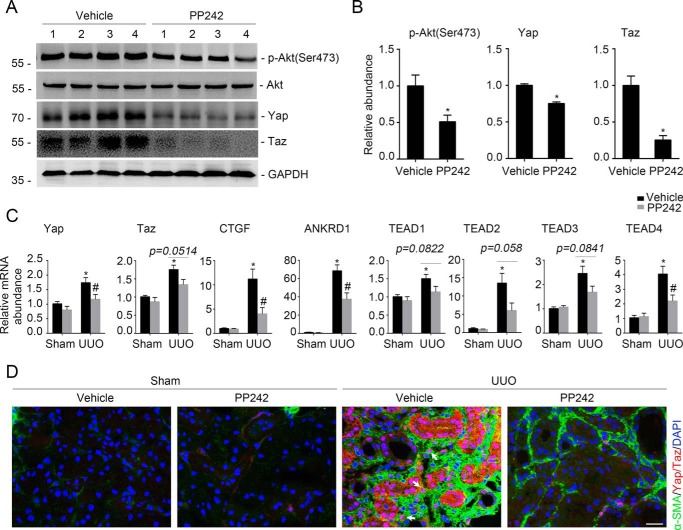
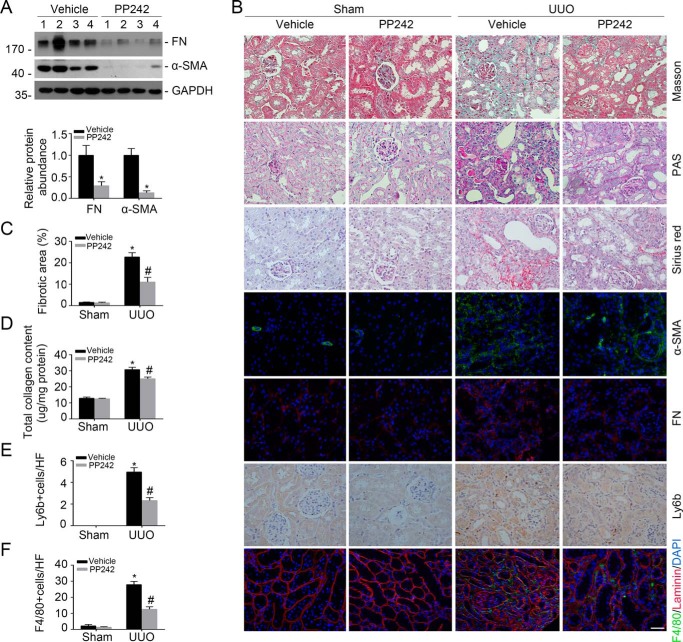
Our previously published study demonstrated that mammalian target of rapamycin complex 2 (mTORC2) signaling mediates TGFβ1-induced fibroblast activation. However, the underlying mechanisms for mTORC2 in stimulating fibroblast activation remain poorly understood. Here, we found that TGFβ1 could stimulate mTORC2 and Yap/Taz activation in NRK-49F cells. Blocking either mTORC2 or Yap/Taz signaling diminished TGFβ1-induced fibroblast activation. In addition, blockade of mTORC2 could down-regulate the expression of Yap/Taz, connective tissue growth factor (CTGF), and ankyrin repeat domain 1 (ANKRD1). Overexpression of constitutively active Taz (Taz-S89A) could restore fibroblast activation suppressed by PP242, an mTOR kinase inhibitor in NRK-49F cells. In mouse kidneys with unilateral ureter obstructive (UUO) nephropathy, both mTORC2 and Yap/Taz were activated in the interstitial myofibroblasts. Ablation of Rictor in fibroblasts/pericytes or blockade of mTOR signaling with PP242 attenuated Yap/Taz activation and UUO nephropathy in mice. Together, this study uncovers that targeting mTORC2 retards fibroblast activation and kidney fibrosis through suppressing Yap/Taz activation.

Keywords: Rictor; Yes-associated protein (YAP); cell signaling; fibroblast; fibrosis; kidney.


Conflict of interest statement

The authors declare that they have no conflicts of interest with the contents of this article

Figures

Figure 1.
Figure 1.
Blockade of Rictor/mTORC2 signaling reduces TGFβ1-induced Yap/Taz expression. A, the primary cultured fibroblasts generated from the kidneys of Rictorfl/fl mice were infected with adeno-Cre virus. After 48 h, the fibroblasts were serum-starved overnight and then treated with TGFβ1 (2 ng/ml). Western blot assays show the abundance for Yap/Taz. GAPDH was probed to show the equal loading of the samples. B, Western blot analyses showing the abundance of p-Akt (Ser-473) and p-S6 in NRK-49F cells after PP242 or rapamycin treatment. C, NRK-49F cells were pretreated with PP242 (400 nm) and rapamycin (1.28 nm) for 30 min, followed by TGFβ1 (2 ng/ml) administration for different durations. The Western blot assay demonstrated that PP242 but not rapamycin could inhibit TGFβ1-induced Yap/Taz expression. D, real-time PCR analysis showing the mRNA abundance for Yap, Taz, CTGF, and ANKRD1 in NRK-49F cells. *, p < 0.05 compared with control cells (n = 3–4); #, p < 0.05 compared with cells treated with TGFβ1 (n = 3–4). E, real-time PCR analysis showing the mRNA abundance for CTGF and ANKRD1 in NRK-49F cells. *, p < 0.05 compared with control cells (n = 3). F, Western blot analysis showing that Akt1/2 inhibitor could suppress TGFβ1-induced Yap and Taz expression. G, real-time PCR analysis showing the mRNA abundance for Yap, Taz, CTGF, and ANKRD1 in NRK-49F cells. *, p < 0.05 compared with control cells (n = 3–4); #, p < 0.05 compared with cells treated with TGFβ1 (n = 3–4). H and I, NRK-49F cells were treated with cycloheximide (50 μg/ml) or actinomycin D (0.1 μm), followed by TGFβ1 (2 ng/ml) administration. A Western blot assay shows the abundance for Yap and Taz. GAPDH was probed to show the equal loading of the samples. Error bars, S.E.
Figure 2.
Figure 2.
Yap/Taz mediates Rictor/mTORC2-stimulated fibroblast activation. A, Western blot assay showing that ablation of Rictor reduced TGFβ1-induced FN and α-SMA expression in kidney fibroblasts. B, Western blot assay (left) and quantitative analysis (right) showing the protein abundance for FN and α-SMA in Rictor+/+ and Rictor−/− primary cultured kidney fibroblasts. Fibroblasts were treated with TGFβ1 for 24 h. *, p < 0.05 compared with Rictor+/+ fibroblasts (n = 4). GAPDH was probed to show the equal loading of the samples. C, Western blot analysis showing that PP242 could dose-dependently inhibit TGFβ1-induced FN and α-SMA expression in NRK-49F cells. D, immune staining showing that PP242 could inhibit TGFβ1-induced NRK-49F cell activation. Cells were co-stained with 4′,6-diamidino-2-phenylindole (DAPI) to visualize the nuclei. Scale bar, 5 μm. E, Western blot analyses showing the abundance of FN and α-SMA expression (left) and p-Smad3 (right). NRK-49F cells were treated with verteporfin, followed by TGFβ1 administration for 24 h (left) or 30 min (right). F, representative micrographs showing that verteporfin could abolish TGFβ1-induced fibroblast activation in NRK-49F cells. Cells were co-stained with DAPI to visualize the nuclei. Scale bar, 5 μm. G and I, Western blot analyses demonstrating the down-regulation of Yap (G) or Taz (I) after siRNA transfection, respectively. H and J, NRK-49F cells were pretreated with scramble, Yap, or Taz siRNA for 24 h, followed by TGFβ1 treatment for 24 h. Western blot analysis shows that knocking down Yap or Taz could reduce TGFβ1-induced FN and α-SMA expression (left). Right, graphic presentation of FN and α-SMA protein abundance in NRK-49F cells. *, p < 0.05 compared with control (n = 3); #, p < 0.05 compared with TGFβ1-treated cells (n = 3). K and L, Western blot assay showing the expression of exogenous Taz (S89A) in NRK-49F cells after Taz-S89A plasmid transfection (K). Western blot assays show the abundance for FN and α-SMA in NRK-49F cells (L). NRK-49F cells were transiently transfected with pTaz-S89A, followed 24 h later by TGFβ1 with or without PP242 treatment for 24 h. M, representative micrographs showing the immunostaining for FN and α-SMA in fibroblasts after various treatments as indicated. Cells were co-stained with DAPI to visualize the nuclei. Scale bar, 5 μm. Error bars, S.E.
Figure 3.
Figure 3.
Co-activation of mTORC2 and Yap/Taz signaling in myofibroblasts from the UUO kidneys. A, Western blot assay (left) and semiquantitative analysis (right) showing the induction of p-Akt (Ser-473), p-Yap (Ser-127), Yap, Taz, and TEAD in the UUO kidneys. B, real-time RT-PCR analysis showing the mRNA abundance for Yap, Taz, CTGF, ANKRD1, and TEAD1–4 in the UUO kidneys. *, p < 0.05 compared with sham control (n = 3–4). C, representative images showing the induction for p-Akt (Ser-473), Yap/Taz, and TEAD in myofibroblasts from the UUO kidneys at day 7 after surgery. White arrows, myofibroblasts with the induction of p-Akt (Ser-473), Yap/Taz, and TEAD, respectively. Scale bar, 20 μm. Error bars, S.E.
Figure 4.
Figure 4.
Ablation of Rictor in fibroblasts diminishes Yap/Taz activation and UUO nephropathy in mice. Mice were performed with UUO and sacrificed at day 7 after surgery. A and B, Western blot assay (A) and quantitative analysis (B) showing FN, α-SMA, Yap, and Taz protein abundance in the Sham and UUO kidneys from Gli1+-Rictor+/+ and Gli1+-Rictor−/− mice, respectively. Numbers indicate individual animals within each group. *, p < 0.05 compared with Gli1+-Rictor+/+ littermates after UUO (n = 4). C, representative images showing the lesser induction of Yap/Taz protein in the kidney myofibroblasts from the Gli1+-Rictor−/− mice. White arrows, Yap/Taz-positive myofibroblasts. Scale bar, 20 μm. D, real-time PCR analysis showing the mRNA abundance for Yap, Taz, CTGF, ANKRD1, and TEAD1–4 from Sham and UUO kidneys. *, p < 0.05 versus Sham control (n = 5–6); #, p < 0.05 versus Rictor+/+ littermates after UUO (n = 5–6). E, representative images of periodic acid–Schiff (PAS), Masson, and Sirius red staining in the kidneys from different groups as indicated. Scale bar, 20 μm. F and G, graphic presentation showing the fibrotic area and total collagen content in kidney tissues among groups as indicated. *, p < 0.05 compared with Sham control (n = 4–5); #, p < 0.05 compared with UUO kidneys from control littermates (n = 4–5). Error bars, S.E.
Figure 5.
Figure 5.
Blockade of mTORC2 signaling with PP242 inactivates Yap/Taz. Male CD1 mice were performed with UUO and sacrificed at day 7 after surgery. A, Western blot analysis showing that PP242 administration could inhibit the induction of p-Akt (Ser-473), Yap, and Taz in the fibrotic kidneys with UUO nephropathy compared with those treated with vehicle. The numbers indicate the individual animal within each group. B, graphic presentation showing the relative abundance for p-Akt (Ser-473), Yap, and Taz, respectively. *, p < 0.05 compared with vehicle controls (n = 4–6). C, real-time PCR analysis showing the mRNA abundance for Yap, Taz, CTGF, ANKRD1, and TEAD1–4 in the kidneys from each group. *, p < 0.05 compared with sham control (n = 5–6); #, p < 0.05 compared with mice treated with vehicle alone (n = 4–6). D, representative images showing the lesser induction of Yap/Taz protein in the kidney myofibroblasts from the mice treated with PP242 compared with those treated with vehicle. White arrows, Yap/Taz-positive myofibroblasts. Scale bar, 20 μm. Error bars, S.E.
Figure 6.
Figure 6.
Blockade of mTORC2 signaling with PP242 attenuates UUO nephropathy in mice. Male CD1 mice were performed with UUO and sacrificed at day 14 after surgery. A, Western blot analysis showing FN and α-SMA protein abundance in the UUO kidneys from mice treated with vehicle and PP242, respectively. Numbers indicate individual animals within each group (top). Graphic presentation showing the protein abundance for FN and α-SMA in the UUO kidneys (bottom). *, p < 0.05 compared with vehicle group (n = 4). B, representative micrographs showing Masson, periodic acid–Schiff (PAS), and Sirius red staining, as well as immunostaining for FN, α-SMA, Ly6b, and F4/80 in the contralateral (CTL) and UUO kidneys from various groups as indicated. Scale bar, 20 μm. C–F, graphic presentation showing the fibrotic area (C), total collagen content (D), neutrophils (E), and macrophages (F) in kidney tissues among groups as indicated. *, p < 0.05 compared with CTL kidneys (n = 3–6); #, p < 0.05 compared with UUO kidneys with vehicle (n = 3–6). Error bars, S.E.

Similar articles

Cited by

References

    1. Liu Y. (2011) Cellular and molecular mechanism of renal fibrosis. Nat. Rev. Nephrol. 7, 684–696 10.1038/nrneph.2011.149 - DOI - PMC - PubMed
    1. Meguid El Nahas A., and Bello A. K. (2005) Chronic kidney disease: the global challenge. Lancet 365, 331–340 10.1016/S0140-6736(05)17789-7 - DOI - PubMed
    1. Grande M. T., and López-Novoa J. M. (2009) Fibroblast activation and myofibroblast generation in obstructive nephropathy. Nat. Rev. Nephrol. 5, 319–328 10.1038/nrneph.2009.74 - DOI - PubMed
    1. Nath K. A. (1992) Tubulointerstitial changes as a major determinant in the progression of renal damage. Am. J. Kidney Dis. 20, 1–17 10.1016/S0272-6386(12)80312-X - DOI - PubMed
    1. Humphreys B. D. (2018) Mechanisms of renal fibrosis. Annu. Rev. Physiol. 80, 309–326 10.1146/annurev-physiol-022516-034227 - DOI - PubMed

Publication types