. 2019 Jan;15(1):98-112.
doi: 10.1080/15548627.2018.1509608. Epub 2018 Sep 11.

Transcriptional and epigenetic profiling of nutrient-deprived cells to identify novel regulators of autophagy

Affiliations

Transcriptional and epigenetic profiling of nutrient-deprived cells to identify novel regulators of autophagy

J G C Peeters et al. Autophagy. 2019 Jan.

Abstract

Macroautophagy (hereafter autophagy) is a lysosomal degradation pathway critical for maintaining cellular homeostasis and viability, and is predominantly regarded as a rapid and dynamic cytoplasmic process. To increase our understanding of the transcriptional and epigenetic events associated with autophagy, we performed extensive genome-wide transcriptomic and epigenomic profiling after nutrient deprivation in human autophagy-proficient and autophagy-deficient cells. We observed that nutrient deprivation leads to the transcriptional induction of numerous autophagy-associated genes. These transcriptional changes are reflected at the epigenetic level (H3K4me3, H3K27ac, and H3K56ac) and are independent of autophagic flux. As a proof of principle that this resource can be used to identify novel autophagy regulators, we followed up on one identified target: EGR1 (early growth response 1), which indeed appears to be a central transcriptional regulator of autophagy by affecting autophagy-associated gene expression and autophagic flux. Taken together, these data stress the relevance of transcriptional and epigenetic regulation of autophagy and can be used as a resource to identify (novel) factors involved in autophagy regulation.

Keywords: Autophagy; ChIP-seq; EGR1; RNA-seq; nutrient-deprivation.


Figures
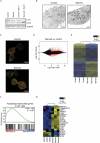
Figure 1.
Figure 1.
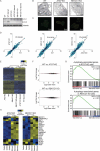
Increased expression of autophagy-associated genes after nutrient deprivation. (a) Western Blot of HAP1 cells in control and starved (6 h EBSS) condition, with and without bafilomycin A1 (40 nM). Representative blot is shown (n = 4). (b) Representative EM images of HAP1 cells in control and starved (6 h EBSS) condition, treated with bafilomycin A1. Autolysosomal structures are indicated by arrows. (c) Representative images of HAP1 cells transfected with a plasmid encoding mCherry-EGFP-LC3B in control and starved (6 h EBSS) condition. mCherry+ EGFP+ dots (yellow) are autophagosomes and mCherry+ dots (red) are autolysosomes. (d) MA plot of HAP1 cells upon 6 h starvation with EBSS, displaying all expressed genes. Red dots indicate genes with a FDR < 0.05. (e) Heatmap of genes differentially expressed in HAP1 cells after 6 h starvation with EBSS. (f) Gene set enrichment analysis for autophagy-associated genes in HAP1 cells upon starvation (6 h EBSS). (g) Heatmap depicting expression of key autophagy proteins upon starvation (6 h EBSS) of HAP1 cells. See also Figure S1.
Figure 2.
Figure 2.
Increased expression of autophagy-associated genes upon nutrient deprivation in ATG7 KO and RB1CC1 KO cells. (a) Western Blot of WT, ATG7 KO, and RB1CC1 KO HAP1 cells in control and starved (3 h EBSS) condition, treated with bafilomycin A1 (40 nM). Representative blot is shown (n = 4). (b) Representative EM images of WT, ATG7 KO, and RB1CC1 KO HAP1 cells in starved (6 h EBSS) condition, treated with bafilomycin A1. Autolysosomes are indicated by arrows. (c) Representative images of HAP1 WT, ATG7 KO, and RB1CC1 KO cells transfected with a plasmid encoding mCherry-EGFP-LC3B in starved (6 h EBSS) condition. mCherry+ EGFP+ dots (yellow) are autophagosomes and mCherry+ dots (red) are autolysosomes. (d) Fold change of significantly differentially expressed genes in either WT, ATG7 KO and/or RB1CC1 KO HAP1 cells. Blue dots represent autophagy-associated genes. (e) Heatmap of WT, ATG7 KO, and RB1CC1 KO HAP1 cells upon starvation (6 h EBSS) displaying genes significantly different in one of the cell lines. (f) MA plot of genes differentially expressed between WT and ATG7 KO or RB1CC1 KO HAP1 cells upon starvation (6 h EBSS). Red dots indicate genes with a FDR < 0.05. (g) Gene set enrichment analysis of autophagy-associated genes in ATG7 KO and RB1CC1 KO HAP1 cells upon starvation (6 h EBSS). (h) Heatmap depicting expression of key autophagy proteins upon starvation (6 h EBSS) of ATG7 KO and RB1CC1 KO cells. See also Figure S2.
Figure 3.
Figure 3.
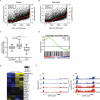
Increased transcription of autophagy-associated genes contributes to increased expression of autophagy-associated genes. Rank analysis of gene body POLR2 occupancy and RNA-sequencing signal in control (a) condition and after starvation (b). Genes are ranked according to RNA-sequencing data. (c) Boxplots with 5%-95% whiskers displaying log2 fold change of body POLR2 signal for genes unchanged, increased, and decreased ≥ log1 based on RNA-sequencing. (d) Gene set enrichment analysis of autophagy-associated genes for genes associated with an alteration of body POLR2 signal upon starvation (3 h EBSS). (e) Heatmap depicting body POLR2 signal for key autophagy genes upon starvation (3 h EBSS). (f) Gene track for MAP1LC3B displaying ChIP-seq signals for POLR2. See also Figure S3.
Figure 4.
Figure 4.
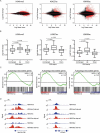
Increased transcription of autophagy-associated genes is reflected at the epigenetic level. (a) MA plots of H3K4me3, H3K27ac and H3K56ac signal upon starvation (3 h EBSS). Red dots indicate genes with a FDR < 0.05. (b) Boxplots with 5%-95% whiskers displaying log2 fold change in H3K4me3, H3K27ac or H3K56ac signal for genes unchanged, increased, and decreased ≥ log1 based on RNA-sequencing. (c) Gene set enrichment analysis of autophagy-associated genes for genes associated with an alteration of H3K4me3, H3K27ac or H3K56ac signal upon starvation (3 h EBSS). (d) Gene tracks for MAP1LC3B and ATG4D displaying ChIP-seq signals for H3K4me3, H3K27ac, and H3K56ac with and without starvation (3 h EBSS). See also Figure S4.
Figure 5.
Figure 5.
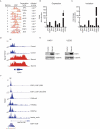
Epigenetic and transcriptomic analysis identifies EGR1 as a candidate transcriptional regulator of autophagy. (a) Top 10 transcription factor binding motifs enriched in autophagy-associated genes. Log2 FPKM (b) and fold change (c) after starvation (6 h EBSS) of transcription factors with binding motifs enriched in autophagy-associated genes. (d) Gene track for EGR1 displaying ChIP-seq signal for POLR2 with and without starvation (3 h EBSS). (e) EGR1 and TUBA4A/tubulin expression in HAP1 and U2OS cells upon starvation (6 h EBSS). Representative blots are shown (n = 3). (f) Gene track for MAP1LC3B displaying ChIP-seq signals for EGR1 (obtained from GEO GSE32465, samples GSM803414 and GSM803434), H3K4me3, H3K27ac, H3K56ac, DNAse I hypersensitivity sites, and EGR1 motif.
Figure 6.
Figure 6.
EGR1 acts as a transcriptional regulator of autophagy. (a) Expression of autophagy-associated genes in HAP1 cells with and without EGR1 knockdown starved for 6 h with EBSS. Fold change relative to cells transfected with scrambled siRNA is shown. Data are represented as mean ± SEM (n = 6–9). (b) Expression of autophagy-associated genes in HAP1 cells with and without EGR1 overexpression starved for 6 h with EBSS. Fold change relative to empty vector (EV)-transfected cells is shown. Data are represented as mean ± SEM (n = 3–6). (c) Expression of autophagy-associated genes in HAP1 EGR1 KO cells starved for 6 h with EBSS. Fold change relative to WT HAP1 starved for 6 h is shown. Data are represented as mean ± SEM (n = 6). (d) LC3 and TUBA4A expression in WT and EGR1 KO HAP1 cells in control and starved (3 h and 6 h EBSS) condition, treated with bafilomycin A1 (40 nM). Representative blot is shown (3 h: n = 4; 6 h: n = 6). (e) EGR1, LC3, and TUBA4A expression in WT HAP1 cells with and without EGR1 overexpression in control and starved (3 h and 6 h EBSS) condition, treated with bafilomycin A1 (40 nM). Representative blot is shown (3 h: n = 3; 6 h: n = 3). (f) LC3, EGR1, and TUBA4A expression in HEK293 cells with and without EGR1 overexpression in control and starved (3 h and 6 h EBSS) condition, treated with bafilomycin A1 (40 nM). Representative blot is shown (3 h: n = 3; 6 h: n = 6). (g) Representative images of HAP1 WT and EGR1 KO cells transfected with a plasmid encoding mCherry-EGFP-LC3B in starved (6 h EBSS) condition. mCherry+ EGFP+ dots (yellow) are autophagosomes and mCherry+ dots (red) are autolysosomes. (h) Boxplots with 5%-95% whiskers displaying the ratio red vs. yellow dots per cell and the total amount of dots per cell (75 cells were counted within 2 independent experiments). * = p < 0.05, ** = p < 0.01, *** = p < 0.001.

Similar articles

Cited by

References

    1. Klionsky DJ, Emr SD.. Autophagy as a regulated pathway of cellular degradation. Science. 2000;290:1717–1721. - PMC - PubMed
    1. Yang Z, Klionsky DJ. Eaten alive: a history of macroautophagy. Nat Cell Biol. 2010;12:814–822. - PMC - PubMed
    1. Mizushima N. Autophagy in Protein and Organelle Turnover. Cold Spring Harb Symp Quant Biol. 2011;76:397–402. - PubMed
    1. Feng Y, Yao Z, Klionsky DJ. How to control self-digestion: transcriptional, post-transcriptional, and post-translational regulation of autophagy. Trends Cell Biol. 2015;25:354–363. - PMC - PubMed
    1. Tasdemir E, Maiuri MC, Galluzzi L, et al. Regulation of autophagy by cytoplasmic p53. Nat Cell Biol. 2008;10:676–687. - PMC - PubMed

Publication types

Substances

Grants and funding

This work was supported by the Nederlandse Organisatie voor Wetenschappelijk Onderzoek [022.004.018];Nederlandse Organisatie voor Wetenschappelijk Onderzoek [91615113];Wilhelmina Children’s Hospital;Marie Skłodowska-Curie Cofund [713660];Marie Skłodowska-Curie ITN [765912];Reumafonds [14-3-201];ZonMw [016.130.606].