. 2018 Aug 13:9:866.
doi: 10.3389/fphar.2018.00866. eCollection 2018.

Hyperglycemia Promotes Chemoresistance Through the Reduction of the Mitochondrial DNA Damage, the Bax/Bcl-2 and Bax/Bcl-XL Ratio, and the Cells in Sub-G1 Phase Due to Antitumoral Drugs Induced-Cytotoxicity in Human Colon Adenocarcinoma Cells

Affiliations

Hyperglycemia Promotes Chemoresistance Through the Reduction of the Mitochondrial DNA Damage, the Bax/Bcl-2 and Bax/Bcl-XL Ratio, and the Cells in Sub-G1 Phase Due to Antitumoral Drugs Induced-Cytotoxicity in Human Colon Adenocarcinoma Cells

Loredana Bergandi et al. Front Pharmacol. .

Abstract

Diabetes and cancer are common, chronic, and potentially fatal diseases that frequently co-exist. Observational studies clearly indicate that the risk of several types of cancer is increased in diabetic patients and a number of cancer types have shown a higher mortality rate in patients with hyperglycemic associated pathologies. This scenario could be due, at least in part, to a lower efficacy of the cancer treatments which needs to be better investigated. Here, we evaluated the effects of a prolonged exposure to high glucose (HG) to the response to chemotherapy on human colon adenocarcinoma HT29 and LOVO cell lines. We observed that hyperglycemia protected against the decreased cell viability and cytotoxicity and preserved from the mitochondrial DNA lesions induced by doxorubicin (DOX) and 5-fluorouracil (5-FU) treatments by lowering ROS production. In HT29 cells the amount of intracellular DOX and its nuclear localization were not modified by HG incubation in terms of Pgp, BCRP, MRP1, 5 and 8 activity and gene expression. On the contrary, in LOVO cells, the amount of intracellular DOX was significantly decreased after a bolus of DOX in HG condition and the expression and activity of MPR1 was increased, suggesting that HG promotes drug chemoresistance in both HT29 and LOVO cells, but in a different way. In both cell types, HG condition prevented the susceptibility to apoptosis by decreasing the ratio Bax/Bcl-2 and Bax/Bcl-XL and diminished the level of cytosolic cytochrome c and the cleavage of full length of PARP induced by DOX and 5-FU. Finally, hyperglycemia reduced cell death by decreasing the cell percentage in sub-G1 peak induced by DOX (via a cell cycle arrest in the G2/M phase) and 5-FU (via a cell cycle arrest in the S phase) in HT29 and LOVO cells. Taken together, our data showed that a prolonged exposure to HG protects human colon adenocarcinoma cells from the cytotoxic effects of two widely used chemotherapeutic drugs, impairing the effectiveness of the chemotherapy itself.

Keywords: 5-fluorouracil; cell damage; chemoresistance; colon adenocarcinoma; cytotoxicity; doxorubicin; hyperglycemia.


Figures
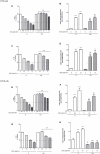
FIGURE 1
FIGURE 1
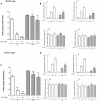
Effect of normal glucose (G) and high glucose (HG) on cell proliferation and on LDH release from cells in the supernatant in absence or presence of doxorubicin (DOX) in human colon cancer (HT29 and LOVO) cells. Cells were cultured for ≥7 days in the presence of G and HG, then subjected to the following investigations. (A) Cells were left untreated or incubated for 48 h in the presence of different concentrations (0.05 μM, 0.1 μM, 0.5 μM, 1 μM, 2.5 μM) of DOX (A,E) or 24 h in the presence of different concentrations (2.5 μM, 5 μM, 10 μM) of DOX (C,G). Samples were then stained in quadruplicate with the neutral red solution (n = 4) to assess cell viability. IC50 was calculated as the concentration of DOX that kills 50% (dotted line) of cells. p < 0.01 0.5, 1, 2.5, 5, and 10 μM DOX in HT29/LOVO cells cultured in G vs. 0 μM DOX in HT29/LOVO cells cultured in G; ••p < 0.001 0.05, 0.1, 0.5, 1, 2.5, 5, and 10 μM DOX in HT29/LOVO cells cultured in HG, respectively, vs. 0.05, 0.1, 0.5, 1, 2.5, 5, and 10 μM DOX in HT29/LOVO cells cultured in G. (B) Cells were left untreated or incubated for 48 h before analysis with 0.5 μM and 1 μM of DOX (B,F) or for 24 h with 5 μM and 10 μM of DOX (D,H), then the LDH activity was measured. Extracellular LDH activity was calculated as total (intracellular and extracellular) LDH activity in the dish. Measurements (n = 8) were performed in duplicate. ∗∗∗p < 0.0001 0.5, 1, 5, and 10 μM DOX in HT29/LOVO cells cultured in G vs. 0 μM DOX in HT29/LOVO cells cultured in G; •••p < 0.0001 0.5, 1, 5, and 10 μM DOX in HT29/LOVO cells cultured in HG vs. 0 μM DOX in HT29/LOVO cells cultured in HG; ∘∘p < 0.001 1 μM DOX in HT29/LOVO cells cultured in HG vs. 0 μM DOX in HT29/LOVO cells cultured in HG; ∘∘p < 0.001 and °p < 0.002, respectively, 0.5, 1, 5, and 10 μM DOX in HT29/LOVO cells cultured in HG vs. 0.5, 1, 5, and 10 μM DOX in HT29/LOVO cells cultured in G; § p < 0.002 0 μM DOX in LOVO cells cultured in HG vs. 0 μM DOX in LOVO cells cultured in HG.
FIGURE 2
FIGURE 2
Effect of normal glucose (G) and high glucose (HG) on cell proliferation and on LDH release from cells in the supernatant in absence or presence of 5-fluorouracil (5-FU) in human colon cancer (HT29 and LOVO) cells. Cells were cultured for ≥7 days in the presence of G and HG, then subjected to the following investigations. (A) Cells were left untreated or incubated for 72 h in the presence of different concentrations (1 μM, 5 μM, 10 μM, 25 μM, 50 μM) of 5-FU (A,C). Samples were then stained in quadruplicate with the neutral red solution (n = 4) to assess cell viability. IC50 was calculated as the concentration of 5-FU that kills 50% (dotted line) of cells. p < 0.01 25 and 50 μM 5-FU in HT29/LOVO cells cultured in G vs. 0 μM 5-FU in HT29/LOVO cells cultured in G; ••p < 1, 5, 10, 25, 50 5-FU in HT29/LOVO cells cultured in HG, respectively, vs. 1, 5, 10, 25, 50 5-FU in HT29/LOVO cells cultured in G. (B) Cells were left untreated or incubated for 72 h with 25 μM and 50 μM of 5-FU (B,D), then the LDH activity was measured. Measurements (n = 8) were performed in duplicate. ∗∗∗p < 0.0001 25 and 50 μM 5-FU in HT29/LOVO cells cultured in G vs. 0 μM 5-FU in HT29/LOVO cells cultured in G; ∗∗p < 0.001 25 μM 5-FU in HT29 cells cultured in G vs. 0 μM 5-FU in HT29 cells cultured in G; •••p < 0.0001 25 and 50 μM 5-FU in LOVO cells cultured in HG vs. 0 μM 5-FU in LOVO cells cultured in G; ••p < 0.001 25 and 50 μM 5-FU in HT29 cells cultured in HG vs. 0 μM 5-FU in HT29 cells cultured in G; ∘∘p < 0.001 25 and 50 μM 5-FU in HT29/LOVO cells cultured in HG vs. 25 and 50 μM 5-FU in HT29 cells cultured in G; °p < 0.002, 25 μM 5-FU in HT29 cells cultured in HG vs. 25 μM 5-FU in HT29 cells cultured in G.
FIGURE 3
FIGURE 3
Effect of normal glucose (G) and high glucose (HG) on mitochondrial ROS production in absence or presence of DOX (A,C) or 5-FU (B,D) in human colon cancer (HT29 and LOVO) cells. Cells were cultured for ≥7 days in the presence of G and HG, incubated for 24 h before analysis with 5 and 10 μM DOX or 25 and 50 μM 5-FU and then the mitochondrial ROS levels were measured fluorimetrically in triplicate using the DCFDA-AM probe. Measurements (n = 8) were performed in duplicate. (A) ∗∗∗p < 0.0001 5 and 10 μM DOX in HT29 cells cultured in G vs. 0 μM DOX in HT29 cells cultured in G; ∘∘∘p < 0.0001 5 and 10 μM DOX in HT29 cells cultured in HG vs. 5 and 10 μM DOX in HT29 cells cultured in G; •••p < 0.0001 5 and 10 μM DOX in HT29 cells cultured in HG vs. 0 μM DOX in HT29 cells cultured in HG. (B) ∗∗∗p < 0.0001 25 and 50 μM 5-FU in HT29 cells cultured in G vs. 0 μM 5-FU in HT29 cells cultured in G; ∘∘p < 0.001 25 and ∘∘∘p < 0.0001 50 μM 5-FU in HT29 cells cultured in HG vs. 25 and 50 μM 5-FU in HT29 cells cultured in G; ••p < 0.001 25 and •••p < 0.0001 50 μM 5-FU in HT29 cells cultured in HG vs. 0 μM 5-FU in HT29 cells cultured in HG. (C) ∗∗∗p < 0.0001 5 and 10 μM DOX in LOVO cells cultured in G vs. 0 μM DOX in HT29 cells cultured in G; ∘∘p < 0.001 5 and 10 μM DOX in HT29 cells cultured in HG vs. 5 and 10 μM DOX in LOVO cells cultured in G; ••p < 0.001 5 and 10 μM DOX in LOVO cells cultured in HG vs. 0 μM DOX in HT29 cells cultured in HG. (D) ∗∗∗p < 0.0001 25 and 50 μM 5-FU in LOVO cells cultured in G vs. 0 μM 5-FU in LOVO cells cultured in G; ∘∘∘p < 0.0001 25 and ∘∘p < 0.001 50 μM 5-FU in LOVO cells cultured in HG vs. 25 and 50 μM 5-FU in LOVO cells cultured in G; •••p < 0.0001 25 and ••p < 0.001 50 μM 5-FU in LOVO cells cultured in HG vs. 0 μM 5-FU in LOVO cells cultured in HG.
FIGURE 4
FIGURE 4
Effect of normal glucose (G) and high glucose (HG) on mitochondrial DNA damage (mtDNA) in absence or presence of DOX in human colon cancer (HT29 and LOVO) cells. Cells were cultured for ≥7 days in the presence of G and HG, incubated for 24 h before analysis with 5 and 10 μM DOX, then washed and processed to determine the mtDNA integrity by qRT-PCR and the lesion rate by semi-long run rt-PCR (SLR rt-PCR). Measurements (n = 6) were performed in triplicate. (A) For mtDNA integrity measurements: ∗∗p < 0.001 and ∗∗∗p < 0.0001, respectively, 5 and or 10 μM DOX in HT29 cells cultured in G vs. 0 μM DOX in HT29 cells cultured in G; °p < 0.00 10 μM DOX in HT29 cells cultured in HG vs. 0 μM DOX in HT29 cells cultured in HG; •••p < 0.0001 5 and or 10 μM DOX in HT29 cells cultured in HG vs. 5 and or 10 μM DOX in HT29 cells cultured in G. (C) ∗∗∗p < 0.0001, 5 and or 10 μM DOX in LOVO cells cultured in G vs. 0 μM DOX in LOVO cells cultured in G; °p < 0.00 10 μM DOX in LOVO cells cultured in HG vs. 0 μM DOX in LOVO cells cultured in HG; •••p < 0.0001 5 and or 10 μM DOX in LOVO cells cultured in HG vs. 5 and or 10 μM DOX in LOVO cells cultured in G. (B,D) For lesion rate measurements: ∗∗p < 0.001 and ∗∗∗p < 0.0001, respectively, 5 and or 10 μM DOX in HT29/LOVO cells cultured in G vs. 0 μM DOX in HT29/LOVO cells cultured in G; § p < 0.01 0 μM DOX in HT29/LOVO cells cultured in HG vs. 0 μM DOX in HT29/LOVO cells cultured in G; °p < 0.01 and ∘∘p < 0.001, respectively, 5 and 10 μM DOX in HT29/LOVO cells cultured in HG vs. 0 μM DOX in HT29/LOVO cells cultured in HG; •• and •••p < 0.0001, respectively, 5 and or 10 μM DOX in HT29/LOVO cells cultured in HG vs. 5 and or 10 μM DOX in HT29/LOVO cells cultured in G.
FIGURE 5
FIGURE 5
Effect of normal glucose (G) and high glucose (HG) on intracellular accumulation of DOX in human colon cancer (HT29 and LOVO) cells. Cells were cultured for ≥7 days in the presence of G and HG and incubated with 5 and 10 μM DOX for 24 h before analysis (A,B). The measurements were performed in triplicate (n = 6). ∗∗p < 0.001 5 μM DOX in HT29 cells cultured in G and in HG vs. 0 μM DOX in HT29 cells cultured in G and in HG; ∗∗∗p < 0.0001 10 μM DOX in HT29 cells cultured in G and in HG vs. 0 μM DOX in HT29/LOVO cells cultured in G and in HG; ∗∗∗p < 0.0001 5 and 10 μM DOX in HT29 cells cultured in G vs. 0 μM DOX in HT29 cells cultured in G; •••p < 0.0001 5 DOX in LOVO cells cultured in HG vs. 5 μM DOX in LOVO cells cultured in G; ••p < 0.001 10 DOX in LOVO cells cultured in HG vs. 10 μM DOX in LOVO cells cultured in G.
FIGURE 6
FIGURE 6
Effect of normal glucose (G) and high glucose (HG) on accumulation of 5-FU in human colon cancer HT29 and LOVO cells. Cells were cultured for ≥7 days in the presence of G and HG and incubated with 25 and 50 μM 5-FU for 72 h before analysis, then subjected to the following investigations. (A) The extracellular content of 5-FU (A,C) was assessed by HPLC. The measurements were performed in duplicate and data are presented as mean ± SEM (n = 4). p < 0.05 25 μM 5-FU in HT29 cells cultured in HG vs. G; ∗∗∗p < 0.0001 50 μM 5-FU in HT29 cells cultured in HG vs. G. p < 0.05 25 μM 5-FU in LOVO cells cultured in HG vs. G; p < 0.05 50 μM 5-FU in LOVO cells cultured in HG vs. G. (B) The intracellular drug content of 5-FU (B,D) was assessed by HPLC-MS. The measurements were performed in triplicate and data are presented as mean ± SEM (n = 3). At 25 μM 5-FU (B - I): ∗∗p < 0.001 in HT29 cells cultured in HG vs. G at 24 h; p < 0.05 in HT29 cells cultured in HG vs. G at 48 h; ∗∗p < 0.001 in HT29 cells cultured in HG vs. G at 72 h. At 25 μM 5-FU (D - I): ∗∗p < 0.001 in LOVO cells cultured in HG vs. G at 24 h; p < 0.05 in LOVO cells cultured in HG vs. G at 48 h; ∗∗p < 0.001 in LOVO cells cultured in HG vs. G at 72 h. At 50 μM 5-FU (B - II): ∗∗p < 0.001 in HT29 cells cultured in HG vs. G at 24 h; p < 0.05 in HT29 cells cultured in HG vs. G at 48 h; p < 0.05 in HT29 cells cultured in HG vs. G at 72 h. At 50 μM 5-FU (D - II): p < 0.05 in LOVO cells cultured in HG vs. G at 24 h; ∗∗p < 0.001 in LOVO cells cultured in HG vs. G at 48 h; ∗∗p < 0.001 in LOVO cells cultured in HG vs. G at 72 h.
FIGURE 7
FIGURE 7
ATP binding cassette transporters activity (A,C) and levels of messenger RNA (mRNA) (B,D) of MDR-related proteins (such as BCRP and MRP1, 5 and 8) and P-glycoprotein (Pgp) genes in normal glucose (G) and high glucose (HG) in human colon cancer (HT29 and LOVO) cells. (A,C) Cells were cultured for ≥7 days in the presence of G and HG, then washed and maintained for further 20 min at 37°C in fresh medium or DBPS buffer, respectively, containing rhodamine 123 (to assess Pgp and MRP activity) or Hoechst 33342 (to assess BCRP activity). The cells were lysed and the intracellular fluorescence, inversely related to its efflux, was assessed fluorimetrically. Measurements (n = 6) were performed in triplicate. ∗∗p < 0.001 LOVO cells cultured in HG vs. LOVO cells cultured in G. (B,D) At the same experimental conditions cells were analyzed by quantitative real-time polymerase chain reaction (RT-qPCR). Measurements (n = 6) were performed in triplicate, and data, expressed as relative expression, are presented as means ± SEM; p < 0.01 LOVO cells cultured in HG vs. LOVO cells cultured in G.
FIGURE 8
FIGURE 8
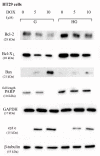
Effect of normal glucose (G) and high glucose (HG) on Bcl-2, Bcl-XL, Bax, PARP and cyt c protein expression in absence or presence of DOX in human colon cancer HT29 cells. Cells were cultured for ≥7 days in the presence of G and HG, incubated for 24 h before analysis with 5 and 10 μM DOX, then washed and lysed. The level of GAPDH, used as an housekeeping protein in total lysates, and the level of β-tubulin, used as an housekeeping protein in mitochondrial lysates, were used to check the equal protein loading. The figure is representative of three independent experiments.
FIGURE 9
FIGURE 9
Densitometry of Bcl-2, Bcl-XL, Bax, PARP, and cyt c protein expression in absence or presence of DOX in human colon cancer HT29 cells in G and HG conditions. The protein bands of three independent experiments have been quantified by densitometry and the values are expressed as arbitrary units. (A) For Bcl-2 measurements: ∗∗p < 0.001 and ∗∗∗p < 0.0001 5 and 10 μM, respectively, DOX in HT29 cells cultured in G vs. 0 μM DOX in HT29 cells cultured in G; §§ p < 0.001 0 μM DOX in HT29 cells cultured in HG vs. 0 μM DOX in HT29 cells cultured in G; °p < 0.001 and ∘∘p < 0.0001 5 and 10 μM DOX in HT29 cells cultured in HG vs. 0 μM DOX in HT29 cells cultured in HG; ••p < 0.001 and •••p < 0.0001 5 and 10 μM DOX, respectively, in HT29 cells cultured in HG vs. 5 and 10 μM DOX, respectively, DOX in HT29 cells cultured in G. (B) For Bcl-XL measurements: ∗∗∗p < 0.0001 and ∗∗p < 0.001 5 and 10 μM, respectively, DOX in HT29 cells cultured in G vs. 0 μM DOX in HT29 cells cultured in G; §§p < 0.001 0 μM DOX in HT29 cells cultured in HG vs. 0 μM DOX in HT29 cells cultured in G; °p < 0.001 and ∘∘p < 0.0001 5 and 10 μM DOX in HT29 cells cultured in HG vs. 0 μM DOX in HT29 cells cultured in HG; ?p < 0.01 10 μM DOX in HT29 cells cultured in HG vs. 10 μM DOX in HT29 cells cultured in G. (C) For Bax measurements: ∗∗∗p < 0.0001 and ∗∗p < 0.001 5 and 10 μM, respectively, DOX in HT29 cells cultured in G vs. 0 μM DOX in HT29 cells cultured in G; °p < 0.001 and ∘∘∘p < 0.0001 5 and 10 μM DOX in HT29 cells cultured in HG vs. 0 μM DOX in HT29 cells cultured in HG; ?p < 0.001 and ••p < 0.001 and •••p < 0.0001 5 and 10 μM DOX, respectively, in HT29 cells cultured in HG vs. 5 and 10 μM DOX, respectively, DOX in HT29 cells cultured in G. (D) For Bax/Bcl-2 ratio measurements: p < 0.001 and ∗∗∗p < 0.0001 5 and 10 μM, respectively, DOX in HT29 cells cultured in G vs. 0 μM DOX in HT29 cells cultured in G; ?p < 0.001 and •••p < 0.0001 5 and 10 μM, respectively, DOX in HT29 cells cultured in HG vs. 5 and 10 μM DOX in HT29 cells cultured in G. (E) For Bax/Bcl-XL ratio measurements: p < 0.01 and ∗∗∗p < 0.0001, respectively, 5 and or 10 μM DOX in HT29 cells cultured in G vs. 0 μM DOX in HT29 cells cultured in G; ?p < 0.001 and •••p < 0.0001, respectively, 5 and or 10 μM DOX in HT29 cells cultured in HG vs. 5 and or 10 μM DOX in HT29 cells cultured in G. (F) For full length PARP measurements: ∗∗∗p < 0.0001 10 μM DOX in HT29 cells cultured in G vs. 0 μM DOX in HT29 cells cultured in G; §§ p < 0.001 0 μM DOX in HT29 cells cultured in HG vs. 0 μM DOX in HT29 cells cultured in G. (H) For cit cyt c measurements: ∗∗∗p < 0.0001 5 and 10 μM, respectively, DOX in HT29 cells cultured in G vs. 0 μM DOX in HT29 cells cultured in G; ∘∘p < 0.001 5 and 10 μM DOX in HT29 cells cultured in HG vs. 0 μM DOX in HT29 cells cultured in HG; ••p < 0.0001 5 and 10 μM DOX, respectively, in HT29 cells cultured in HG vs. 5 and 10 μM DOX, respectively, DOX in HT29 cells cultured in G. (G,I) For GAPDH and β-tubulin measurements: n.s.
FIGURE 10
FIGURE 10
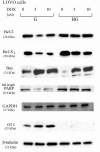
Effect of normal glucose (G) and high glucose (HG) on Bcl-2, Bcl-XL, Bax, PARP and cyt c protein expression in absence or presence of DOX in human colon cancer LOVO cells. Cells were cultured for ≥7 days in the presence of G and HG, incubated for 24 h before analysis with 5 and 10 μM DOX, then washed and lysed. The level of GAPDH, used as an housekeeping protein in total lysates, and the level of β-tubulin, used as an housekeeping protein in mitochondrial lysates, were used to check the equal protein loading. The figure is representative of three independent experiments.
FIGURE 11
FIGURE 11
Densitometry of Bcl-2, Bcl-XL, Bax, PARP and cyt c protein expression in absence or presence of DOX in human colon cancer LOVO cells in G and HG conditions. The protein bands of three independent experiments have been quantified by densitometry and the values are expressed as arbitrary units. (A) For Bcl-2 measurements: ∗∗∗p < 0.0001 and ∗∗p < 0.001 5 and 10 μM, respectively, DOX in HT29 cells cultured in G vs. 0 μM DOX in HT29 cells cultured in G; •••p < 0.0001 5 and 10 μM DOX, respectively, in HT29 cells cultured in HG vs. 5 and 10 μM DOX, respectively, DOX in HT29 cells cultured in G. (B) For Bcl-XL measurements: ∗∗∗p < 0.0001 5 and 10 μM, respectively, DOX in HT29 cells cultured in G vs. 0 μM DOX in HT29 cells cultured in G; §§ p < 0.001 0 μM DOX in HT29 cells cultured in HG vs. 0 μM DOX in HT29 cells cultured in G; °p < 0.001 5 and 10 μM DOX in HT29 cells cultured in HG vs. 0 μM DOX in HT29 cells cultured in HG; •••p < 0.0001 5 and 10 μM DOX in HT29 cells cultured in HG vs. 5 and 10 μM DOX in HT29 cells cultured in G. (C) For Bax measurements: ∗∗∗p < 0.0001 5 and 10 μM, respectively, DOX in HT29 cells cultured in G vs. 0 μM DOX in HT29 cells cultured in G; §§ p < 0.001 0 μM DOX in HT29 cells cultured in HG vs. 0 μM DOX in HT29 cells cultured in G; ∘∘∘p < 0.0001 and ∘∘p < 0.001 5 and 10 μM DOX in HT29 cells cultured in HG vs. 0 μM DOX in HT29 cells cultured in HG; •••p < 0.0001 5 and 10 μM DOX, respectively, in HT29 cells cultured in HG vs. 5 and 10 μM DOX, respectively, DOX in HT29 cells cultured in G. (D) For Bax/Bcl-2 ratio measurements: ∗∗∗p < 0.0001 5 and 10 μM, respectively, DOX in HT29 cells cultured in G vs. 0 μM DOX in HT29 cells cultured in G; §§ p < 0.001 0 μM DOX in HT29 cells cultured in HG vs. 0 μM DOX in HT29 cells cultured in G; ∘∘∘p < 0.001 5 and 10 μM DOX in HT29 cells cultured in HG vs. 0 μM DOX in HT29 cells cultured in HG; •••p < 0.0001 5 and 10 μM, respectively, DOX in HT29 cells cultured in HG vs. 5 and 10 μM DOX in HT29 cells cultured in G. (E) For Bax/Bcl-XL ratio measurements: p < 0.01 and ∗∗∗p < 0.0001, respectively, 5 and or 10 μM DOX in HT29 cells cultured in G vs. 0 μM DOX in HT29 cells cultured in G; §§ p < 0.001 0 μM DOX in HT29 cells cultured in HG vs. 0 μM DOX in HT29 cells cultured in G; ∘∘p < 0.001 5 and 10 μM DOX in HT29 cells cultured in HG vs. 0 μM DOX in HT29 cells cultured in HG; •••p < 0.0001, respectively, 5 and or 10 μM DOX in HT29 cells cultured in HG vs. 5 and or 10 μM DOX in HT29 cells cultured in G. (F) For full length PARP measurements: ∗∗p < 0.001 5 and 10 μM, respectively, DOX in HT29 cells cultured in G vs. 0 μM DOX in HT29 cells cultured in G; § p <0.01 0 μM DOX in HT29 cells cultured in HG vs. 0 μM DOX in HT29 cells cultured in G. (H) For cit cyt c measurements: ∗∗∗p < 0.0001 5 and 10 μM, respectively, DOX in HT29 cells cultured in G vs. 0 μM DOX in HT29 cells cultured in G; •••p < 0.0001 5 and 10 μM DOX, respectively, in HT29 cells cultured in HG vs. 5 and 10 μM DOX, respectively, DOX in HT29 cells cultured in G. (G,I) For GAPDH and β-tubulin measurements: n.s.
FIGURE 12
FIGURE 12
Effect of normal glucose (G) and high glucose (HG) on cell cycle in HT29 and LOVO cells in absence or presence of DOX (A,C) or 5-FU (B,D). Cells were cultured for ≥7 days in the presence of G and HG, incubated for 24 h before analysis with 5 and 10 μM DOX (A,C) or for 72 h with 25 and 50 μM 5-FU (B,D) and then cells were analyzed for DNA content by FACS analysis. Panels represent the distribution of cells in different phases of cell cycle. Measurements (n = 3) were performed and data are presented as means ± SEM. (A,C) p < 0.01 5 and 10 μM DOX in HT29 cells cultured in G vs. 0 μM DOX in HT29 cells cultured in G; § p < 0.01 10 μM DOX in HT29 cells cultured in HG vs. 0 μM DOX in HT29 cells cultured in HG; #p <0.01 5 and 10 μM DOX in HT29 cells cultured in HG vs. 5 and 10 μM DOX in HT29 cells cultured in G. (B,D) p < 0.01 and ∗∗p < 0.001 25 and 50 μM 5-FU in HT29 cells cultured in G vs. 0 μM 5-FU in HT29 cells cultured in G; § p < 0.01 50 μM 5-FU in HT29 cells cultured in HG vs. 0 μM 5-FU in HT29 cells cultured in HG; #p < 0.01 50 μM 5-FU in HT29 cells cultured in HG vs. 50 μM 5-FU in HT29 cells cultured in G.
FIGURE 13
FIGURE 13
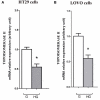
Effect of normal glucose (G) and high glucose (HG) on mRNA expression and in absence or presence of DOX in human colon cancer (HT29 (A) and LOVO (B)) cells. Cells were cultured for ≥7 days in the presence of G and HG, then washed and processed to determine the Topoisomerase II mRNA expression. The figure is representative of three independent experiments. Cells were analyzed by quantitative real-time polymerase chain reaction (RT-qPCR). Measurements (n = 6) were performed in triplicate, and data are expressed as relative expression; (A) p < 0.01 HT29 cells cultured in HG vs. HT29 cells cultured in G and (B) p < 0.01 LOVO cells cultured in HG vs. LOVO cells cultured in G.
FIGURE 14
FIGURE 14
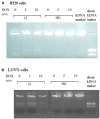
Effect of normal glucose (G) and high glucose (HG) on Topoisomerase II alpha activity in absence or presence of DOX in human colon cancer (HT29 (A) and LOVO (B)) cells. Cells were cultured for ≥7 days in the presence of G and HG, incubated for 24 h before analysis with 5 and 10 μM DOX, then washed and processed to determine the nuclear Topoisomerase II catalytic activity. The figure is representative of three independent experiments. The nuclear Topo II alpha activity is represented by the reduction of catenated kDNA provided in TopoGEN assay kit and/or the appearance of decatenated kDNA.

Similar articles

Cited by

References

    1. Arcidiacono B., Iiritano S., Nocera A., Possidente K., Nevolo M. T., Ventura V., et al. (2012). Insulin resistance and cancer risk: an overview of the pathogenetic mechanisms. Exp. Diabetes Res. 2012 1–12. 10.1155/2012/789174 - DOI - PMC - PubMed
    1. Atlas Website (2014). Diabetes Research and Clinical Practice and on the IDF Diabetes Atlas Website. Available at: www.idf.org/diabetesatlas
    1. Bergandi L., Aina V., Garetto S., Malavasi G., Aldieri E., Laurenti E., et al. (2010). Fluoride-containing bioactive glasses inhibit pentose phosphate oxidative pathway and glucose 6-phosphate dehydrogenase activity in human osteoblasts. Chem. Biol. Interact. 183 405–415. 10.1016/j.cbi.2009.11.021 - DOI - PubMed
    1. Beutler E. (1971). Red Cell Metabolism A Manual of Biochemical Methods. New York, NY: Grune & Stratton.
    1. Biadgo B., Melku M., Abebe S. M., Abebe M. (2016). Hematological indices and their correlation with fasting blood glucose level and anthropometric measurements in type 2 diabetes mellitus patients in Gondar, Northwest Ethiopia. Diabetes Metab. Syndr. Obes. 9 91–99. 10.2147/DMSO.S97563 - DOI - PMC - PubMed