. 2018 Sep 6;174(6):1522-1536.e22.
doi: 10.1016/j.cell.2018.07.047. Epub 2018 Aug 23.

Transcription Elongation Can Affect Genome 3D Structure

Affiliations

Transcription Elongation Can Affect Genome 3D Structure

Sven Heinz et al. Cell. .

Abstract

How transcription affects genome 3D organization is not well understood. We found that during influenza A (IAV) infection, rampant transcription rapidly reorganizes host cell chromatin interactions. These changes occur at the ends of highly transcribed genes, where global inhibition of transcription termination by IAV NS1 protein causes readthrough transcription for hundreds of kilobases. In these readthrough regions, elongating RNA polymerase II disrupts chromatin interactions by inducing cohesin displacement from CTCF sites, leading to locus decompaction. Readthrough transcription into heterochromatin regions switches them from the inert (B) to the permissive (A) chromatin compartment and enables transcription factor binding. Data from non-viral transcription stimuli show that transcription similarly affects cohesin-mediated chromatin contacts within gene bodies. Conversely, inhibition of transcription elongation allows cohesin to accumulate at previously transcribed intragenic CTCF sites and to mediate chromatin looping and compaction. Our data indicate that transcription elongation by RNA polymerase II remodels genome 3D architecture.

Keywords: CTCF; NS1; chromatin compaction; cohesin; genome 3D structure; influenza A virus; readthrough transcription; transcription; transcription elongation; transcription termination.


Figures

Figure 1.
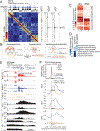
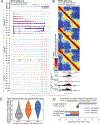
Figure 1.. Influenza A virus (IAV) infection perturbs host cell genome 3D structure and induces transcription read-through at response gene
(A) IFIT locus in situ Hi-C contact maps of mock-infected (lower left) and lAV-infected (upper right) primary human monocyte-derived macrophages (MDM) at 6 hours post infection (hpi) (merge of 2 replicates per condition). Top, PC1 values (compartments) and RNAPII ChIP-seq read densities in mock-infected cells. Right, changes in PC1, distal-to-local interaction ratio (DLR) and interchromosomal fraction of interactions (ICF) between IAV and mock conditions. White arrows: IAV-induced changes in chromatin interactions at the IFIT2 locus. (B) Schematic defining chromatin A & B compartments (PC1) and chromatin compaction (DLR, ICF). (C) Hierarchical clustering of genes significantly regulated by IAV and IFNβ (RNA-seq, 2 replicates each, log2FC > 3, FDR<5%). (D) Top-enriched GO terms gene sets induced by both IAV and IFNβ, or IAV alone. (E) Genome browser tracks of total RNA-seq, ChIP-seq (RNAPII/H3K27ac), compartments changes (PC1) and compaction ΔDLR, ΔICF) after IAV infection or IFNβ treatment at the IFIT family locus. (F) Meta-gene profiles of changes in PC1, DLR, ICF and RNAPII after IAV or IFNβ treatment at highly IFNβ-responsive genes (FC > 8, FPKM > 5; 75 genes, see Table S2). See also Figure S1.
Figure 2.
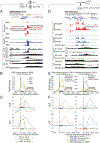
Figure 2.. IAV-induced read-through and structural changes are NS1-dependent
(A) Genome browser tracks of RNA-seq and RNAPII ChIP-seq read densities and chromatin compaction changes at the CMPK2/RSAD2 locus in mock-, wild-type IAV-, and IAV with NS1 truncation ΔNS1)-infected MDM. (B,C) Meta-gene plot of RNAPII ChIP-seq reads (B) and changes in chromatin compaction ΔDLR and ΔICF) (C) after IAV, ΔNS1, or IFNβ treatment of MDM at highly IFNβ-responsive genes defined in Figure 1F. (D) Genome browser tracks of RNA-seq and RNAPII ChIP-seq reads and chromatin compaction changes at the IFIT family locus in THP-1 cells expressing either EGFP or influenza NS1 protein with or without IFNβ and flavopiridol. (E,F) Meta-gene plot of RNAPII ChIP-seq reads (E) or changes in chromatin compaction ΔDLR and ΔICF) (F) in THP-1 cells expressing EGFP or NS1, treated with either IFNβ or PAM (TLR2 agonist) and flavopiridol at genes highly responsive to IFNβ or PAM stimulation in THP-1 (IFNβ: FC > 8, RNAPII FPKM > 5; 30 response genes; PAM: FC > 4, RNAPII FPKM > 5; 27 response genes, see Table S2). See also Figure S2.
Figure 3.
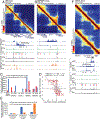
Figure 3.. High-level transcription removes cohesin from CTCF sites and eliminates loops
(A) Loss of interactions at the highly induced IFIT family locus following infection. Hi-C contact map in mock- (lower left) and IAV- (upper right) infected MDM (merge of 2 replicates). ChIP-seq for RNAPII, CTCF, RAD21 (cohesin), and H3K27ac below. Red and blue triangles indicate preferred interaction direction of CTCF motifs. Black arrows mark regions with dynamic cohesin changes during infection. (B) Same as (A) for the IAV-repressed RAPGEF1 locus, showing increase of CTCF-colocalizing cohesin (black arrow) and loop strengthening with IAV infection. (C) Weakened loops are preferentially located in read-through regions. Fraction of regulated chromatin loops with at least one anchor overlapping IAV read-through regions or regulated ChIP-seq peaks that either increase or decrease 2-fold after IAV infection (CTCF, cohesin, RNAPII, H3K27ac) (15 kb resolution). (D) Negatively correlation between changes in cohesin and RNAPII levels at CTCF peaks in highly transcribed regions (>7.5 FPKM RNAPII, CTCF, and cohesin signal per CTCF site in either mock or IAV conditions, 431 regions total). Grey points are CTCF peaks by H3K27ac in either condition (FPKM > 2.5), indicating regulatory elements where RNAPII is often paused. (E) Loop weakening with transcription elongation. Percentage of loops regulated in common between IAV, ΔNS1, or IFNβ, or weakened specifically with IAV-infection. At least one loop anchor overlaps IFNβ-regulated gene bodies or IAV read-through regions. Loops connecting an IFNβ-regulated gene and an IAV read-through region were assigned to the gene. (F) Hi-C contact map of the STAT1 locus in EGFP- (lower left) and NS1- (upper right) expressing THP-1 cells stimulated with IFNβ and/or flavopiridol. ChIP-seq for RNAPII, CTCF and cohesin below. Black arrows mark cohesin peaks lost due to read-through transcription and recovered with flavopiridol. See also Figure S3.
Figure 4.
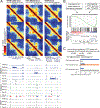
Figure 4.. Intragenic chromatin loops weaken with normal transcriptional responses to cellular signaling
(A) Hi-C contact maps and RNAPII, cohesin, and CTCF ChIP-seq signal at loci that selectively respond to PAM (NFKB1), IFNβ (IFIH1), and dexamethasone (FKBP5) in THP-1 cells. Chromatin loops are weakened only if the corresponding gene is induced. Black arrows mark intragenic CTCF sites where cohesin is lost following transcription induction. (B) Gene Set Enrichment Analysis (GSEA) of ranked lists of chromatin loops for loop anchor overlap at CTCF sites with increased RNAPII following treatment (>1.5 fold). Loops are ranked by their log2 ratio of Hi-C interactions in treated versus control conditions. (C) Association between transcribed CTCF sites and chromatin loop changes is signaling-specific. GSEA enrichment q-values comparing each ranked list of chromatin loop changes with each set of CTCF sites with increased RNAPII density for PAM, IFNβ, and dexamethasone (Dex) treatments. See also Figures S4 and S5.
Figure 5.
Figure 5.. Loop formation in and compaction of transcribed regions upon blocking transcription elongation with flavopiridol
(A) Flavopiridol stalls RNAPII at regulatory elements, enabling cohesin to accumulate at intragenic CTCF sites. Genome browser tracks of RNAPII, cohesin, and CTCF at the ACTB locus in control and flavopiridol-treated THP-1 cells. (B) Loops that strengthen with elongation inhibition overlap CTCF sites that become less transcribed flavopiridol. Moving average showing the fraction of loops with anchors overlapping CTCF sites that lose RNAPII following flavopiridol treatment plotted against the change in loop strength. (C) Gain of loops at CTCF sites located within the ACTB gene body. Hi-C contact map and RNAPII, cohesin, and CTCF ChIP-seq signal at the ACTB locus in control- (lower left) and flavopiridol- (upper right) treated THP-1 cells. Black arrows mark CTCF sites that gain cohesin following flavopiridol treatment. (D) Highly transcribed genes exhibit greater compaction along their gene bodies after flavopiridol treatment. Meta-gene profiles of changes in ΔDLR and ΔICF for genes longer than 50 kb separated by RNAPII levels in control THP-1 cells. (E) Log2 ratio of Hi-C interaction frequencies relative to interaction distance in flavopiridol versus control-treated THP-1 cells at long genes (>50 kb) segregated by their RNAPII levels. See also Figure S5.
Figure 6.
Figure 6.. Kinetic analysis of RNAPII elongation and cohesin displacement
(A) RNAPII, cohesin, and CTCF ChIP-seq at the NFKB1 (p50) locus. THP-1 cells treated with PAM followed by flavopiridol for the indicated times. Flavopiridol treatment for 240 minutes is included as a control. Grey box, CTCF site that loses cohesin when transcribed by RNAPII. Black arrows mark putative PAM-specific enhancers that accumulate RNAPII and cohesin following PAM and flavopiridol treatments. (B) Hi-C contact maps of the NFKB1 locus showing the weakening of the loop formed by the CTCF site highlighted by grey box in (A). Altered interaction patterns are observed near the NFKB1 gene body in PAM+flavopiridol-treated samples. (C) Distribution of correlation coefficients between the temporal levels of RNAPII and RAD21 for each RAD21 peak exhibiting high-magnitude changes in RNAPII density (FC > 2, RNAPII FPKM > 10). Peaks were segregated based on CTCF (>10 FPKM) and whether or not they are found in ‘initiating’ or ‘elongation’ regions based on the increase or decrease in RNAPII density following flavopiridol treatment. (D) GSEA enrichment q-values for changes in loop strength overlapping with the subsets of RAD21 peaks defined in (C). See also Figure S6.
Figure 7.
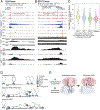
Figure 7.. Read-through transcription into B compartment chromatin results in enhanced transcription factor binding
(A,B) Transcription factor binding is increased where B-to-A compartment changes occur. ChIP-seq tracks for PU.1, RNAPII, and H3K27ac at the IFI44 (A) and STAT1 (B) loci in macrophages infected with IAV, IAV lacking NS1 (ΔNS1), or mock. PC1 values and changes in ΔDLR and ΔICF are depicted for each locus. Black arrow highlights new H3K27ac-marked PU.1 site. (C) Distribution of log2 binding ratios between IAV and ΔNS1 conditions for the 500 PU.1 ChIP-seq peaks in regions exhibiting the largest changes in ΔPC1, ΔICF, ΔDLR, or random regions. (D) Model of RNAPII elongation-mediated dissolution of chromatin structure by removal of cohesin at CTCF sites. (E) Model of RNAPII elongation-mediated switching of regions from the B to the A compartment following IAV infection. See also Figure S7.

Similar articles

Cited by

References

    1. Amaral PP, Leonardi T, Han N, Viré E, Gascoigne DK, Arias-Carrasco R, Büscher M, Pandolfini L, Zhang A, Pluchino S, et al. (2018). Genomic positional conservation identifies topological anchor point RNAs linked to developmental loci. Genome Biol. 19, 32. - PMC - PubMed
    1. Bailey JA, Gu Z, Clark RA, Reinert K, Samonte RV, Schwartz S, Adams MD, Myers EW, Li PW, and Eichler EE (2002). Recent segmental duplications in the human genome. Science 297, 1003–1007. - PubMed
    1. Bercovich-Kinori A, Tai J, Gelbart IA, Shitrit A, Ben-Moshe S, Drori Y, Itzkovitz S, Mandelboim M, and Stern-Ginossar N (2016). A systematic view on influenza induced host shutoff. Elife 5. - PMC - PubMed
    1. Bhatt DM, Pandya-Jones A, Tong A-J, Barozzi I, Lissner MM, Natoli G, Black DL, and Smale ST (2012). Transcript dynamics of proinflammatory genes revealed by sequence analysis of subcellular RNA fractions. Cell 150, 279–290. - PMC - PubMed
    1. Busslinger GA, Stocsits RR, van der Lelij P, Axelsson E, Tedeschi A, Galjart N, and Peters J-M (2017). Cohesin is positioned in mammalian genomes by transcription, CTCF and Wapl. Nature 544, 503–507. - PMC - PubMed

Publication types

MeSH terms