. 2018 Oct 1;215(10):2600-2616.
doi: 10.1084/jem.20180783. Epub 2018 Aug 22.

N-glycanase NGLY1 regulates mitochondrial homeostasis and inflammation through NRF1

Affiliations

N-glycanase NGLY1 regulates mitochondrial homeostasis and inflammation through NRF1

Kun Yang et al. J Exp Med. .

Abstract

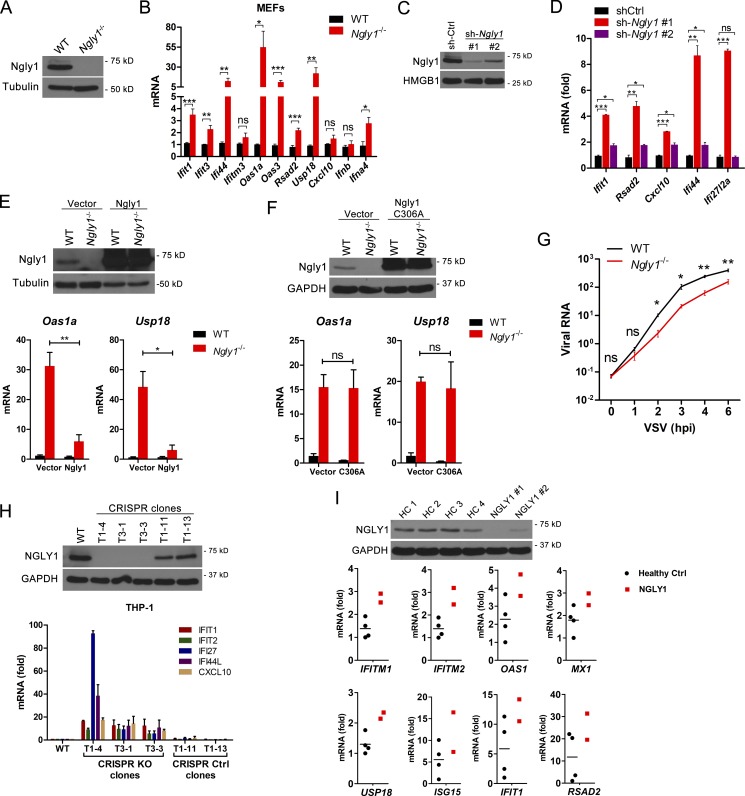
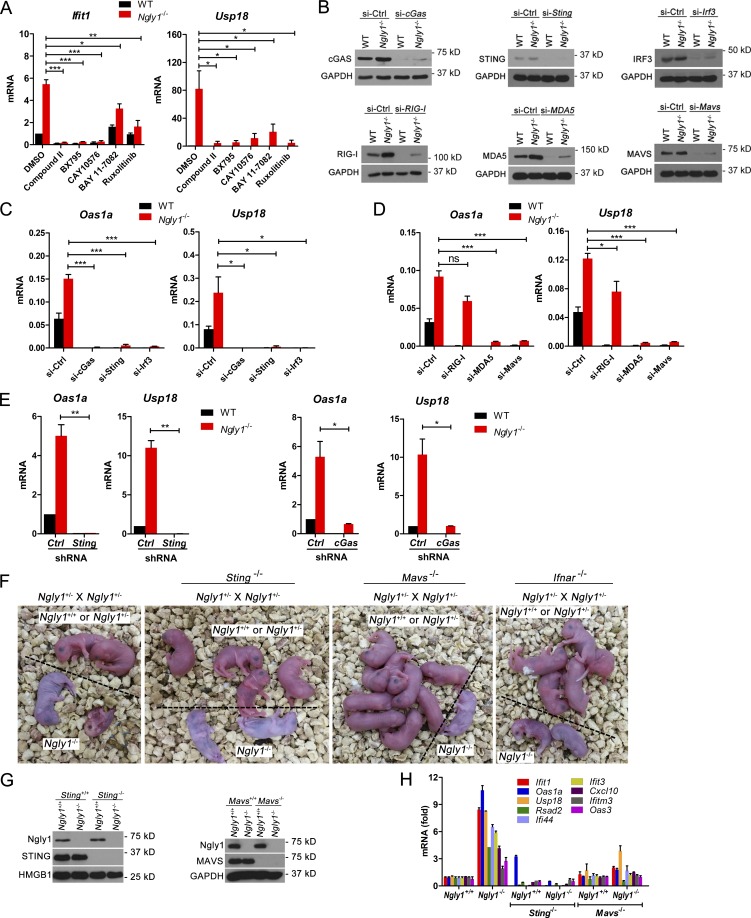
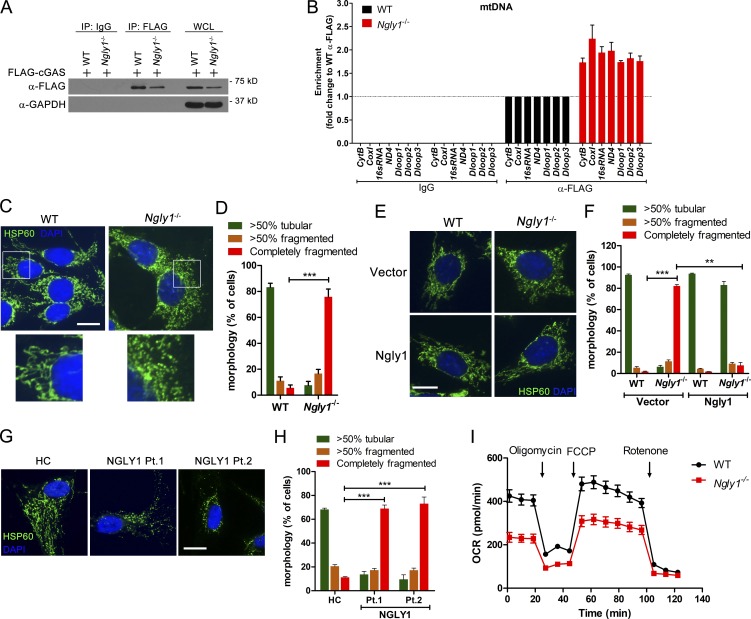
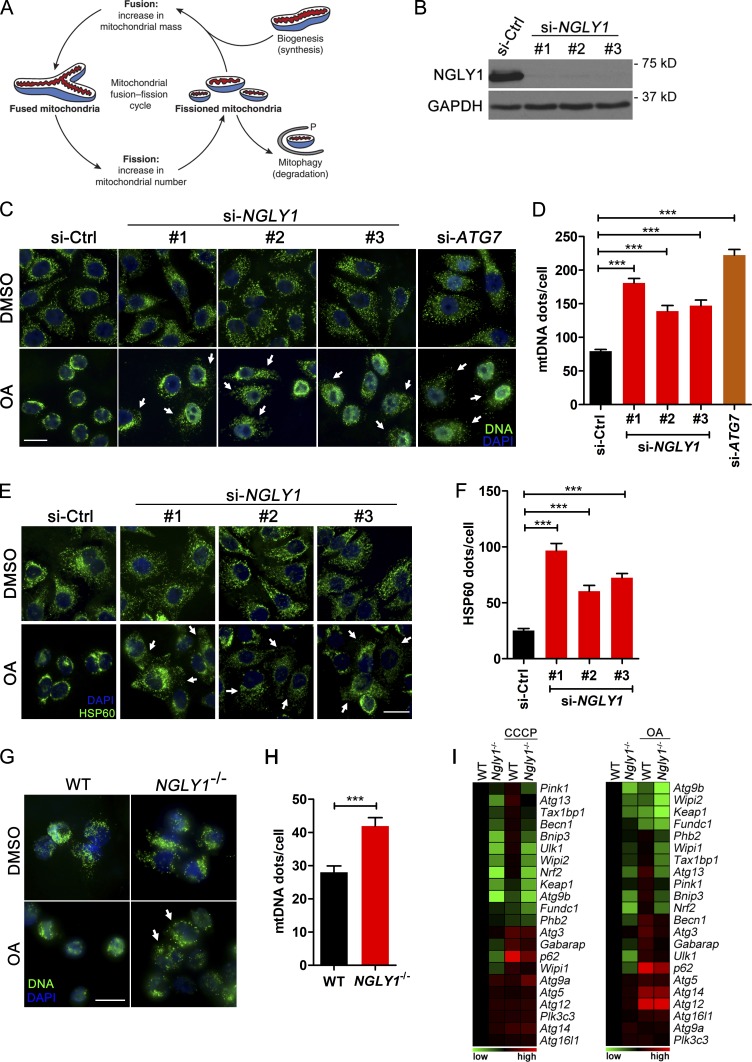
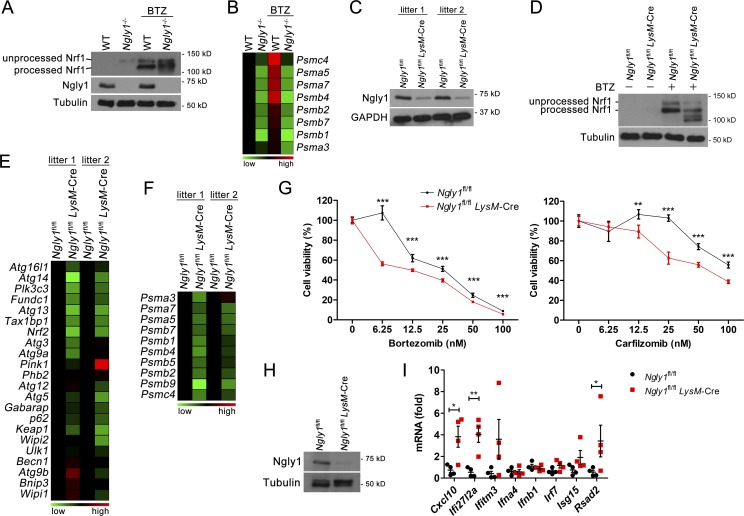
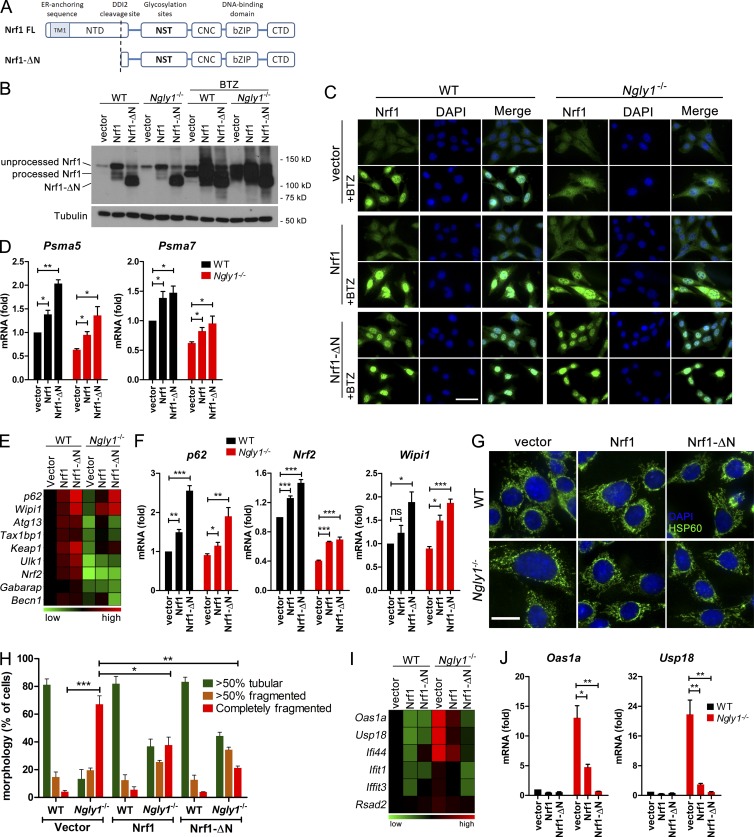
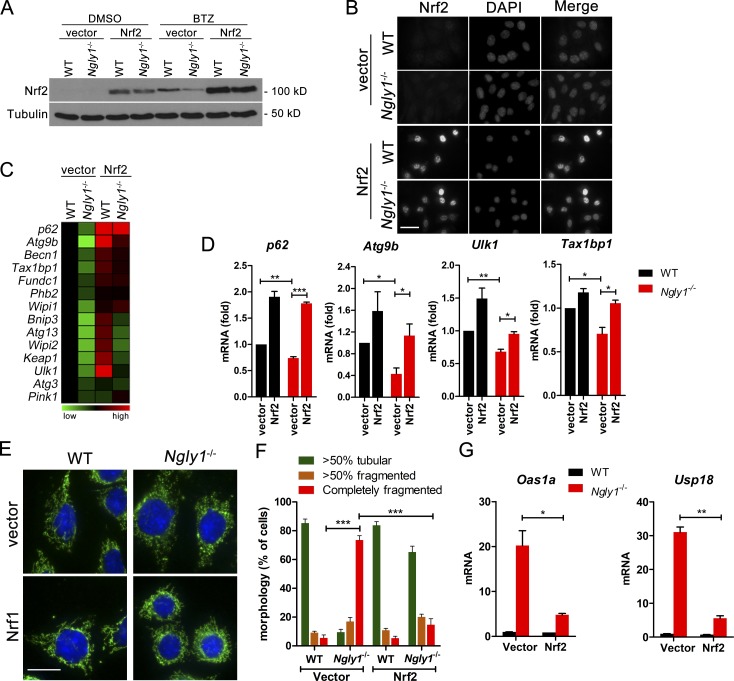
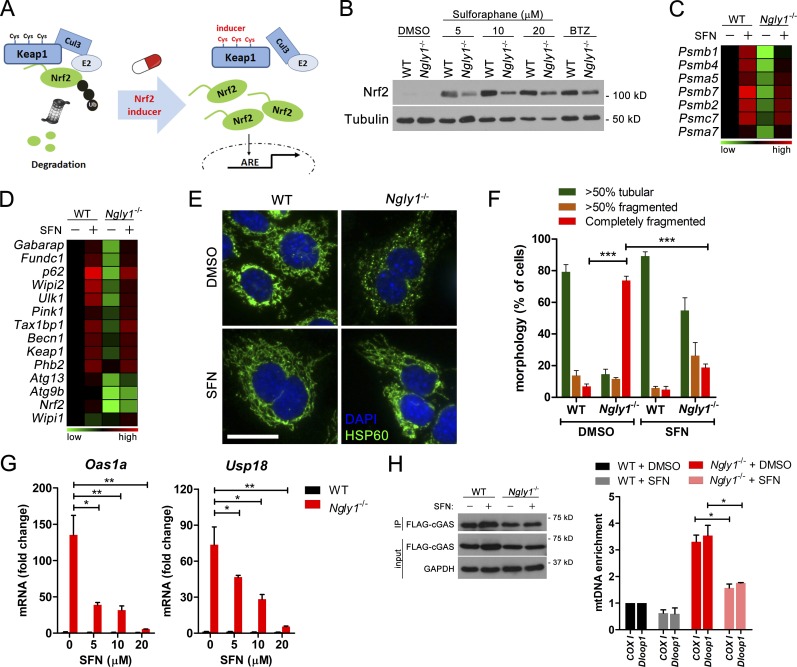
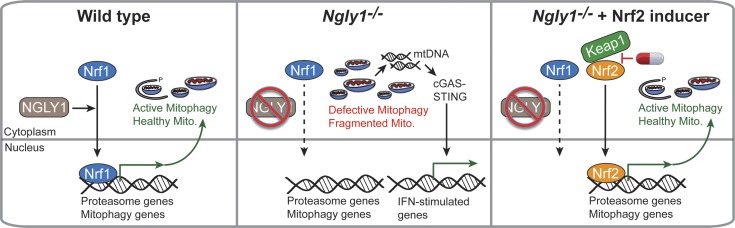
Mutations in the NGLY1 (N-glycanase 1) gene, encoding an evolutionarily conserved deglycosylation enzyme, are associated with a rare congenital disorder leading to global developmental delay and neurological abnormalities. The molecular mechanism of the NGLY1 disease and its function in tissue and immune homeostasis remain unknown. Here, we find that NGLY1-deficient human and mouse cells chronically activate cytosolic nucleic acid-sensing pathways, leading to elevated interferon gene signature. We also find that cellular clearance of damaged mitochondria by mitophagy is impaired in the absence of NGLY1, resulting in severely fragmented mitochondria and activation of cGAS-STING as well as MDA5-MAVS pathways. Furthermore, we show that NGLY1 regulates mitochondrial homeostasis through transcriptional factor NRF1. Remarkably, pharmacological activation of a homologous but nonglycosylated transcriptional factor NRF2 restores mitochondrial homeostasis and suppresses immune gene activation in NGLY1-deficient cells. Together, our findings reveal novel functions of the NGLY1-NRF1 pathway in mitochondrial homeostasis and inflammation and uncover an unexpected therapeutic strategy using pharmacological activators of NRF2 for treating mitochondrial and immune dysregulation.


Figures

Figure 1.
Figure 1.
NGLY1-deficient cells show increased expression in ISGs. (A) Western blot analysis of Ngly1 in WT and Ngly1−/− MEFs. Tubulin was used as a loading control. (B) PCR array of ISGs expression in WT and Ngly1−/− MEFs. Gene expression was normalized to the housekeeping gene Gapdh (same throughout). Data are representative of at least three independent experiments. Unpaired Student’s t test. (C) Western blot analysis of Ngly1 in MEFs transduced with indicated shRNA lentiviruses. (D) Quantitative RT-PCR analysis of ISGs in MEFs transduced with indicated shRNA lentivirus. Data are representative of at least two independent experiments. (E and F) Western blot analysis (upper panels) of Ngly1 in WT and Ngly1−/− MEFs retrovirally transduced with WT or enzymatically inactive C306A mutant Ngly1. Quantitative RT-PCR analysis of ISGs (lower panels) in WT and Ngly1−/− MEFs transduced with indicated Ngly1. Data are representative of at least three independent experiments. Student’s t test. (G) Quantitative RT-PCR analysis of VSV viral RNA in WT and Ngly1−/− MEFs infected with VSV for indicated time. Viral RNA level was calculated as compared with the housekeeping gene Gapdh. Student’s t test. (H) Western blot analysis of NGLY1 (upper panel) and quantitative RT-PCR analysis of ISGs (lower panel) in WT and NGLY1-CRISPR knockout THP-1 clones. Gene expression was normalized to the housekeeping gene GAPDH. Error bars, SEM. Data are representative of at least three independent experiments. (I) Western blot of NGLY1 (upper panel) and quantitative RT-PCR analysis of ISGs (lower panel) in healthy controls (n = 4) and NGLY1 patients (n = 2). Gene expression was normalized to the housekeeping gene GAPDH. ISG expression of one healthy control was arbitrarily set as 1 and fold change of gene expression was calculated in other individuals. *, P < 0.05; **, P < 0.01; ***, P < 0.001; ns indicates not significant. Error bars, SEM.
Figure 2.
Figure 2.
Innate immune nucleic acid–sensing pathways are activated in NGLY1-deficient cells. (A) Quantitative RT-PCR of Ifit1 and Usp18 in WT and Ngly1−/− MEFs treated with indicated inhibitors for 6 h. Gene expression was normalized to the housekeeping gene Gapdh (same throughout). Data are representative of at least three independent experiments. Student’s t test. (B) Western blot of indicated protein in WT and Ngly1−/− MEFs transfected with corresponding siRNA for 48 h. GAPDH was used as a loading control. (C and D) Quantitative RT-PCR of Oas1a and Usp18 in WT and Ngly1−/− MEFs transfected with indicated siRNA for 48 h. Data are representative of at least three independent experiments. Student’s t test. (E) Quantitative RT-PCR of Oas1a and Usp18 in WT and Ngly1−/− MEFs transduced with shRNA targeting Sting or cGas. Data are representative of at least two independent experiments. (F) Representative images of neonates on indicated genetic breeding backgrounds. (G) Western blot analysis of STING, MAVS, and Ngly1 in primary MEFs of indicated genetic backgrounds. (H) Quantitative RT-PCR analysis of indicated ISGs mRNA expression in primary MEFs of indicated genetic backgrounds. Data are representative of at least three independent experiments. Error bars, SEM. *, P < 0.05; **, P < 0.01; ***, P < 0.001; ns indicates not significant.
Figure 3.
Figure 3.
NGLY1-deficient cells exhibit fragmented mitochondria and mtDNA release into the cytosol. (A) IP of ectopically expressed FLAG-cGAS in WT and Ngly1−/− MEFs. (B) Quantitative PCR analysis of mtDNA in FLAG-cGAS IP of WT and Ngly1−/− MEFs. Enrichment of mitochondrial genes in Ngly1−/− MEFs was calculated as compared with that in anti-FLAG IP of WT cells (set as 1) and normalized to FLAG-cGAS protein level shown in A. Error bars, SEM. Data are representative of three independent experiments. (C and D) Representative immunofluorescence images of HSP60 (mitochondrial marker; C) and quantitation of mitochondrial morphology (D) in WT and Ngly1−/− MEFs. Scale bar, 10 µm. ≥120 cells were enumerated for quantitation. Data were shown as mean ± SEM of three independent experiments. Student’s t test. (E and F) Representative images of HSP60 immunofluorescence staining (E) and quantitation of mitochondrial morphology (F) in WT and Ngly1−/− MEFs retrovirally transduced with Ngly1 or empty vector. Data were shown as mean ± SEM of three independent experiments. Student’s t test. (G and H) Representative images of HSP60 immunofluorescence staining (G) and quantitation of mitochondrial morphology (H) in human fibroblast from healthy control and NGLY1 patients. Data were shown as mean ± SEM of three independent experiments. ***P < 0.001 by Student’s t test. (I) Real-time changes in the OCR of WT and Ngly1−/− MEFs during subsequent sequential treatment with oligomycin (inhibitor of ATP synthase), FCCP (carbonyl cyanide 4-(trifluoromethoxy) phenylhydrazone), and rotenone (inhibitors of the electron-transport chain). Error bars, SEM. Data are representative of at least two independent experiments. *, P < 0.05; **, P < 0.01; ***, P < 0.001. Bars, 10 µm.
Figure 4.
Figure 4.
Impaired mitophagy in NGLY1-deficient cells. (A) Schematic diagram of mitochondrial dynamics and mitophagy. (B) Western blot analysis of NGLY1 in HeLa/Parkin cells transfected with indicated siRNA. (C) Representative images of DNA immunofluorescence staining of HeLa/Parkin cells transfected with indicated siRNA followed by either DMSO or OA (oligomycin, 2.5 µM plus antimycin, 250 nM) treatment for 16 h. White arrows denote cells with remaining mitochondria. (D) Quantitation of cytoplasmic DNA puncta (as shown in C) in cells transfected with indicated siRNA followed by either DMSO or OA treatment. >150 cells were analyzed per condition. Data were shown as mean ± SEM of three independent experiments. Student’s t test. (E) Representative images of HSP60 immunofluorescence staining of HeLa/Parkin cells transfected with indicated siRNA followed by either DMSO or OA treatment for 16 h. White arrows denote cells with remaining mitochondria. (F) Quantitation of cytoplasmic HSP60 puncta (as shown in E) in cells transfected with indicated siRNA followed by either DMSO or OA treatment. Data were shown as mean ± SEM of three independent experiments. Student’s t test. (G) Representative images of immunofluorescence DNA staining of WT and NGLY1−/− THP-1 cells treated with either DMSO or OA for 16 h. White arrows denote cells with remaining mitochondria. (H) Quantitation of cytoplasmic DNA puncta (as shown in G) in WT and NGLY1−/− THP-1 cells treated either DMSO or OA. Data were shown as mean ± SEM of three independent experiments. Student’s t test. (I) Heat map of autophagy and mitophagy related gene expression measured by quantitative RT-PCR in WT and Ngly1−/− MEFs treated with either CCCP (10 µM) or OA for 8 h. ***, P < 0.001. Bars, 20 µm.
Figure 5.
Figure 5.
NGLY1 deficiency causes Nrf1 misprocessing, impairs both proteasome and mitophagy transcriptional program and activates immune signaling in mice. (A) Western blot analysis of Nrf1 in WT and Ngly1−/− MEFs with or without proteasome inhibitor bortezomib (BTZ, 20 nM) treatment for 6 h. (B) Heat map of proteasome subunit gene expression measured by quantitative RT-PCR in WT and Ngly1−/− MEFs with or without bortezomib (BTZ, 20 nM) treatment for 6 h. (C) Western blot of Ngly1 in BMDMs from two pairs of Ngly1fl/fl and Ngly1fl/fl LysM-Cre littermate mice. (D) Western blot of Nrf1 in Ngly1fl/fl and Ngly1fl/fl LysM-Cre BMDMs with or without Bortezomib (BTZ, 20 nM) treatment for 6 h. (E and F) Heat map of proteasome subunit genes and mitophagy-related gene expression measured by quantitative RT-PCR in BMDMs from two pairs of Ngly1fl/fl and Ngly1fl/fl LysM-Cre littermate mice. (G) Cell viability of Ngly1fl/fl and Ngly1fl/fl LysM-Cre BMDMs treated with increasing dose of proteasome inhibitor bortezomib or carfilzomib. Error bars, SEM. Student’s t test. (H) Western blot of Ngly1 in primary peritoneal macrophages from Ngly1fl/fl LysM-Cre and littermate Ngly1fl/fl mice. (I) Quantitative RT-PCR analysis of ISGs in primary peritoneal macrophages from Ngly1fl/fl LysM-Cre and littermate Ngly1fl/fl mice (n = 4 mice per genotype). Error bars, SEM. Unpaired Student’s t test. *, P < 0.05; **, P < 0.01.
Figure 6.
Figure 6.
NGLY1 regulates mitophagy and mitochondrial homeostasis through transcription factor Nrf1. (A) Schematic diagram of full-length Nrf1 and N-terminal deleted mutant (Nrf1-ΔN). TM1, transmembrane 1. NTD, N-terminal domain. NST, Asn/Ser/Thr-rich domain. CNC, cap 'N' collar domain. bZIP, basic-leucine zipper. CTD, C-terminal domain. (B) Western blot analysis of Nrf1 in WT and Ngly1−/− MEFs transduced with Nrf1 or Nrf1-ΔN in presence or absence of bortezomib (20 nM, 6 h). (C) Representative immunofluorescence images of Nrf1 staining of WT and Ngly1−/− MEFs transduced with Nrf1 or Nrf1-ΔN in presence or absence of bortezomib. (D) Quantitative RT-PCR analysis of Psma5 and Psma7 in WT and Ngly1−/− MEFs transduced with Nrf1 or Nrf1-ΔN. Data were shown as mean ± SEM of three independent experiments. (E) Heat map of mitophagy-related gene expression measured by quantitative RT-PCR in WT and Ngly1−/− MEFs transduced with Nrf1 or Nrf1-ΔN. (F) Quantitative RT-PCR analysis of p62, Nrf2, and Wipi1 in WT and Ngly1−/− MEFs transduced with Nrf1 or Nrf1-ΔN. Data were shown as mean ± SEM of three independent experiments. (G and H) Representative immunofluorescence images of HSP60 (mitochondrial marker) staining (G) and quantitation of mitochondrial morphology (H) in WT and Ngly1−/− MEFs transduced with Nrf1 or Nrf1-ΔN. Data were shown as mean ± SEM of three independent experiments. (I) Heat map of ISGs expression measured by quantitative RT-PCR in WT and Ngly1−/− MEFs transduced with Nrf1 or Nrf1-ΔN. (J) Quantitative RT-PCR analysis of Oas1a and Usp18 in WT and Ngly1−/− MEFs transduced with Nrf1 or Nrf1-ΔN. Data were shown as mean ± SEM of three independent experiments. *, P < 0.05; **, P < 0.01; ***, P < 0.001 by Student’s t test. Bars: 50 µm (C); 20 µm (G).
Figure 7.
Figure 7.
Enhancing Nrf2 expression activates transcriptional program of mitophagy and restores mitochondrial homeostasis in Ngly1−/− cells. (A) Western blot analysis of Nrf2 in WT and Ngly1−/− MEFs transduced with vector or Nrf2 in presence or absence of proteasome inhibitor Bortezomib (BTZ, 20 nM). (B) Representative immunofluorescence images of Nrf2 staining of WT and Ngly1−/− MEFs transduced with vector or Nrf2. (C) Heat map of autophagy and mitophagy related gene expression measured by quantitative RT-PCR in WT and Ngly1−/− MEFs transduced with vector or Nrf2. (D) Quantitative RT-PCR analysis of p62, Atg9b, Ulk1, and Tax1bp1 in WT and Ngly1−/− MEFs transduced with vector or Nrf2. Data were shown as mean ± SEM of three independent experiments. (E and F) Representative immunofluorescence images of HSP60 (mitochondrial marker) staining (E) and quantitation of mitochondrial morphology (F) in WT and Ngly1−/− MEFs transduced with vector or Nrf2. Data were shown as mean ± SEM of three independent experiments. Student’s t test. (G) Quantitative RT-PCR analysis of Oas1a and Usp18 in WT and Ngly1−/− MEFs transduced with vector or Nrf2. Data were shown as mean ± SEM of three independent experiments. *, P < 0.05; **, P < 0.01; ***, P < 0.001 by Student’s t test. Bars: 50 µm (B); 20 µm (E).
Figure 8.
Figure 8.
Pharmacologically induction of Nrf2 promotes mitophagy and ameliorates mitochondrial defect in Ngly1−/− cells. (A) Schematic diagram of pharmacological activation of Nrf2 by targeting Keap1. (B) Western blot analysis of Nrf2 in WT and Ngly1−/− treated with increasing dose of sulforaphane or proteasome inhibitor bortezomib (BTZ, 20 nM). (C and D) Heat map of proteasome subunit genes and mitophagy-related gene expression measured by quantitative RT-PCR in WT and Ngly1−/− MEFs treated with sulforaphane (SFN, 10 µM). (E and F) Representative immunofluorescence images of HSP60 (mitochondrial marker) staining (E) and quantitation of mitochondrial morphology (F) in WT and Ngly1−/− MEFs treated with sulforaphane (SFN; 10 µM) or vehicle control (DMSO). Bar, 20 µm. Data were shown as mean ± SEM of three independent experiments. Student’s t test. (G) Quantitative RT-PCR analysis of Oas1a and Usp18 mRNA in WT and Ngly1−/− MEFs treated with sulforaphane (SFN) at indicated concentration. Data were shown as mean ± SEM of three independent experiments. Student’s t test. (H) Immunoprecipitation of ectopically expressed FLAG-cGAS (left panel) and quantitative PCR analysis of mtDNA in FLAG-cGAS IP (right panel) in WT and Ngly1−/− MEFs treated with sulforaphane (SFN) or vehicle control (DMSO). Enrichment of mitochondrial genes in each condition was calculated as compared with that in WT cells treated with DMSO (set as 1). Data were shown as mean ± SEM of two independent experiments. *, P < 0.05; **, P < 0.01; ***, P < 0.001.
Figure 9.
Figure 9.
A schematic model of molecular defects of NGLY1−/− cells and potential therapeutic strategy for treating NGLY1 disease.

Similar articles

Cited by

References

    1. Aguirre S., Luthra P., Sanchez-Aparicio M.T., Maestre A.M., Patel J., Lamothe F., Fredericks A.C., Tripathi S., Zhu T., Pintado-Silva J., et al. . 2017. Dengue virus NS2B protein targets cGAS for degradation and prevents mitochondrial DNA sensing during infection. Nat. Microbiol. 2:17037 10.1038/nmicrobiol.2017.37 - DOI - PMC - PubMed
    1. Ahn J., Ruiz P., and Barber G.N.. 2014. Intrinsic self-DNA triggers inflammatory disease dependent on STING. J. Immunol. 193:4634–4642. 10.4049/jimmunol.1401337 - DOI - PMC - PubMed
    1. Bartelt A., Widenmaier S.B., Schlein C., Johann K., Goncalves R.L.S., Eguchi K., Fischer A.W., Parlakgül G., Snyder N.A., Nguyen T.B., et al. . 2018. Brown adipose tissue thermogenic adaptation requires Nrf1-mediated proteasomal activity. Nat. Med. 24:292–303. 10.1038/nm.4481 - DOI - PMC - PubMed
    1. Bialas A.R., Presumey J., Das A., van der Poel C.E., Lapchak P.H., Mesin L., Victora G., Tsokos G.C., Mawrin C., Herbst R., and Carroll M.C.. 2017. Microglia-dependent synapse loss in type I interferon-mediated lupus. Nature. 546:539–543. - PubMed
    1. Chen H., Detmer S.A., Ewald A.J., Griffin E.E., Fraser S.E., and Chan D.C.. 2003. Mitofusins Mfn1 and Mfn2 coordinately regulate mitochondrial fusion and are essential for embryonic development. J. Cell Biol. 160:189–200. 10.1083/jcb.200211046 - DOI - PMC - PubMed

Publication types

MeSH terms

Substances

Supplementary concepts