

TMEM41B is a novel regulator of autophagy and lipid mobilization
- PMID: 30126924
- PMCID: PMC6123663
- DOI: 10.15252/embr.201845889
TMEM41B is a novel regulator of autophagy and lipid mobilization
Abstract
Autophagy maintains cellular homeostasis by targeting damaged organelles, pathogens, or misfolded protein aggregates for lysosomal degradation. The autophagic process is initiated by the formation of autophagosomes, which can selectively enclose cargo via autophagy cargo receptors. A machinery of well-characterized autophagy-related proteins orchestrates the biogenesis of autophagosomes; however, the origin of the required membranes is incompletely understood. Here, we have applied sensitized pooled CRISPR screens and identify the uncharacterized transmembrane protein TMEM41B as a novel regulator of autophagy. In the absence of TMEM41B, autophagosome biogenesis is stalled, LC3 accumulates at WIPI2- and DFCP1-positive isolation membranes, and lysosomal flux of autophagy cargo receptors and intracellular bacteria is impaired. In addition to defective autophagy, TMEM41B knockout cells display significantly enlarged lipid droplets and reduced mobilization and β-oxidation of fatty acids. Immunostaining and interaction proteomics data suggest that TMEM41B localizes to the endoplasmic reticulum (ER). Taken together, we propose that TMEM41B is a novel ER-localized regulator of autophagosome biogenesis and lipid mobilization.
Keywords: CRISPR; TMEM41B; autophagy; endoplasmic reticulum; lipid droplets.
© 2018 Novartis Institute for Biomedical Research.
Figures
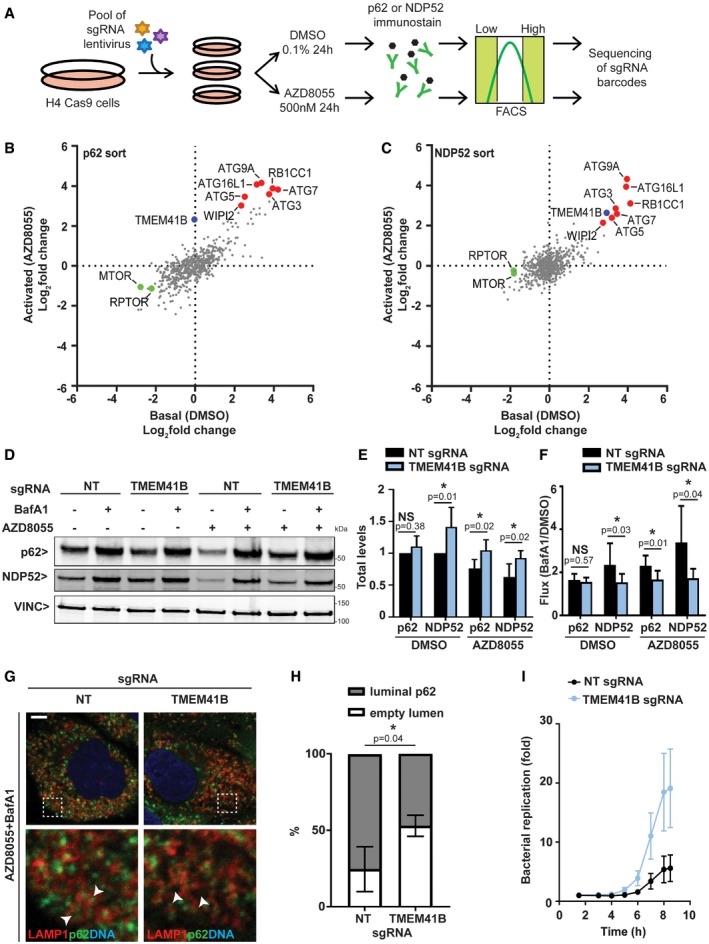
- A
Schematic representation of pooled CRISPR screening workflow. H4 cells stably expressing Cas9 were transduced with a lentiviral sgRNA mini‐pool library, selected for stable integration, expanded, and treated for 24 h with the mTOR inhibitor AZD8055 (activated autophagy) or DMSO as vehicle control (basal autophagy). Endogenous p62 or NDP52 was visualized by immunostaining and cells separated by FACS into populations with high or low signal. Abundance of sgRNAs was quantified in cell populations by next‐generation sequencing.
- B, C
Relative abundance of sgRNAs in cell populations with high versus low signal was visualized as log2 fold chances for basal as well as activated autophagy conditions for (B) p62 or (C) NDP52. Entire data are reported in Dataset EV1.
- D–F
Validation of TMEM41B. H4 Cas9 cells were infected with sgRNAs targeting TMEM41B or a non‐targeting (NT) control, treated with 500 nM AZD8055, 50 nM Bafilomycin A1 (BafA1) or DMSO vehicle control for 24 h, and analyzed by immunoblotting. (E, F) p62 and NDP52 band intensities are depicted as total levels relative to vehicle control in H4 Cas9 NT cells (E), or as flux by calculating the ratio in BafA1‐treated cells versus vehicle control (F). Data are presented as mean ± SD (n = 6 independent experiments) with paired t‐test values.
- G
LAMP1 and p62 were co‐stained and imaged using an LSM700 confocal microscope. Arrowheads point at p62‐filled and empty LAMP1‐positive organelles. Scale bar: 5 μm.
- H
LAMP1‐positive organelles were manually quantified for containing a p62‐filled or empty lumen. A total of 50–60 LAMP1‐positive organelles were analyzed in each experiment. Data are presented as mean ± SD (n = 3 independent experiments) with paired t‐test values.
- I
HeLa cells were transduced with Cas9 and TMEM41B or NT sgRNAs followed by infection with luciferase‐expressing Salmonella typhimurium. Luciferase readings were taken up to 8.5 h post‐infection. Results from one representative experiment are presented as mean ± SD (n = 8 technical replicates).
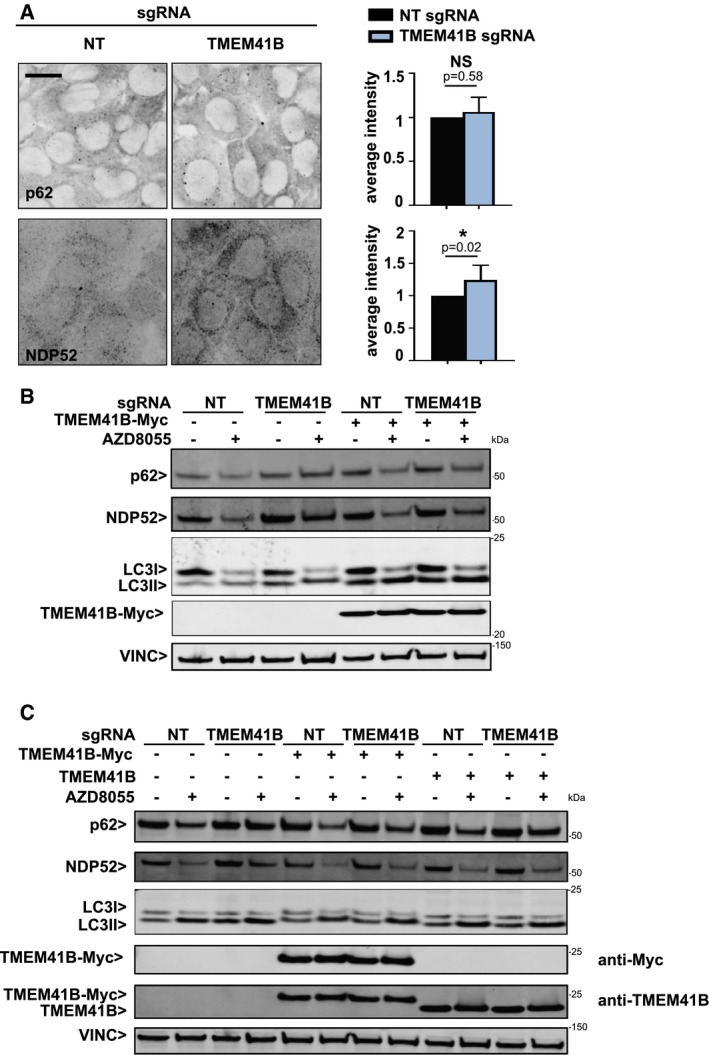
H4 Cas9 TMEM41B KO and NT control cells were probed for p62 and NDP52 by immunostaining and imaged with an automated CV7000 confocal microscope. Scale bar: 20 μm. Staining intensity was quantified with ImageJ and depicted as mean ± SD (n = 4 independent experiments) with paired t‐test values.
HeLa Cas9 cells were infected with sgRNAs targeting TMEM41B or NT control alongside lentiviruses expressing sgRNA‐resistant Myc‐tagged TMEM41B, treated with 500 nM AZD8055 or vehicle control for 24 h, and analyzed by immunoblotting 7 days post‐infection.
H4 Cas9 cells were infected with sgRNAs targeting TMEM41B or NT control alongside lentiviruses expressing sgRNA‐resistant untagged or Myc‐tagged TMEM41B, treated with 500 nM AZD8055 or vehicle control for 24 h, and analyzed by immunoblotting 7 days post‐infection.
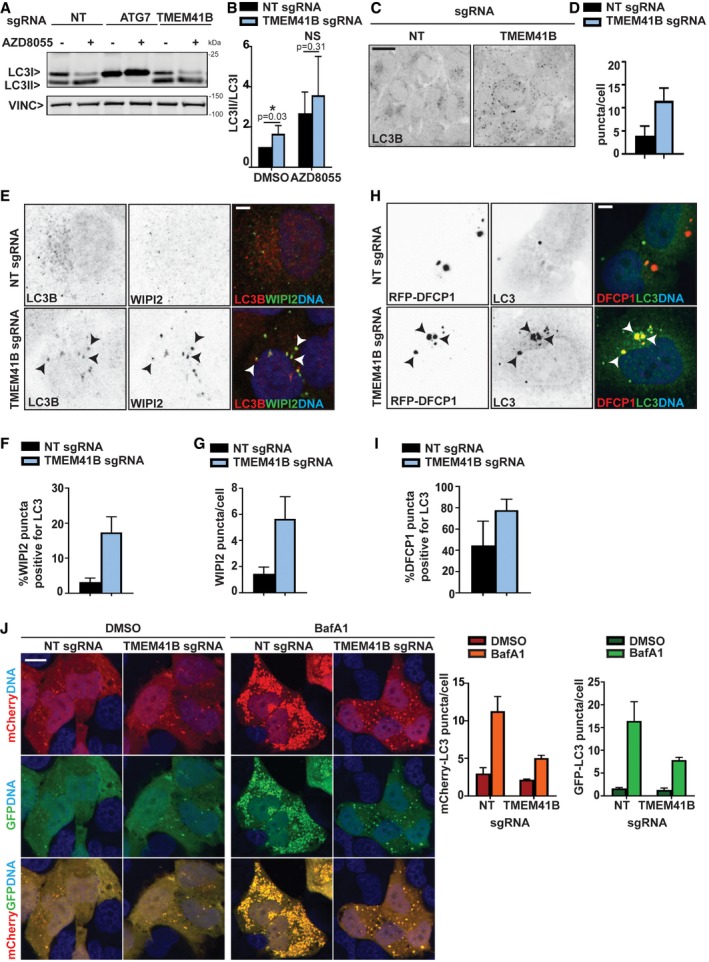
H4 Cas9 cells were infected with sgRNAs targeting ATG7, TMEM41B or NT control, treated with 500 nM AZD8055 or vehicle control for 24 h, and analyzed by immunoblotting.
Ratio of LC3‐II to LC3‐I band intensities is depicted as mean ± SD (n = 6 independent experiments) with Wilcoxon test values.
H4 Cas9 TMEM41B and NT control cells were probed by LC3B immunostaining and imaged with an automated CV7000 confocal microscope. Scale bar: 20 μm.
The number of LC3 puncta per cell was quantified using Yokogawa Analysis Software (YAS) and depicted as mean ± SD (n = 3 technical replicates).
LC3 and WIPI2 were co‐stained and imaged using an LSM700 confocal microscope. Arrowheads point at co‐localized LC3 and WIPI2 puncta. Scale bar: 5 μm.
The number of WIPI2 puncta positive for LC3 was quantified using ImageJ and depicted as mean ± SD (n = 5 technical replicates).
The total number of WIPI2 puncta per cell was quantified using the Harmony software on images acquired with an automated Operetta microscope. Data are depicted as mean ± SD (n = 3 technical replicates).
H4 Cas9 TMEM41B and NT control cells were infected with a RFP‐DFCP1 expression construct for 72 h, fixed, stained with LC3 antibodies, and imaged with an automated CV7000 confocal microscope. Arrowheads point at co‐localized LC3 and RFP‐DFCP1 puncta. Scale bar: 5 μm.
The number of RFP‐DFCP1 puncta positive for LC3 was quantified using ImageJ and depicted as mean ± SD (n = 10 technical replicates).
mCherry‐GFP‐LC3 was expressed in H4 Cas9 TMEM41B KO and NT control cells which were treated with 50 nM BafA1 or vehicle control for 24 h, fixed and imaged. Scale bar: 20 μm. The number of mCherry‐ and GFP‐positive puncta per cell was quantified using YAS and is depicted as mean ± SD (n = 3 technical replicates).
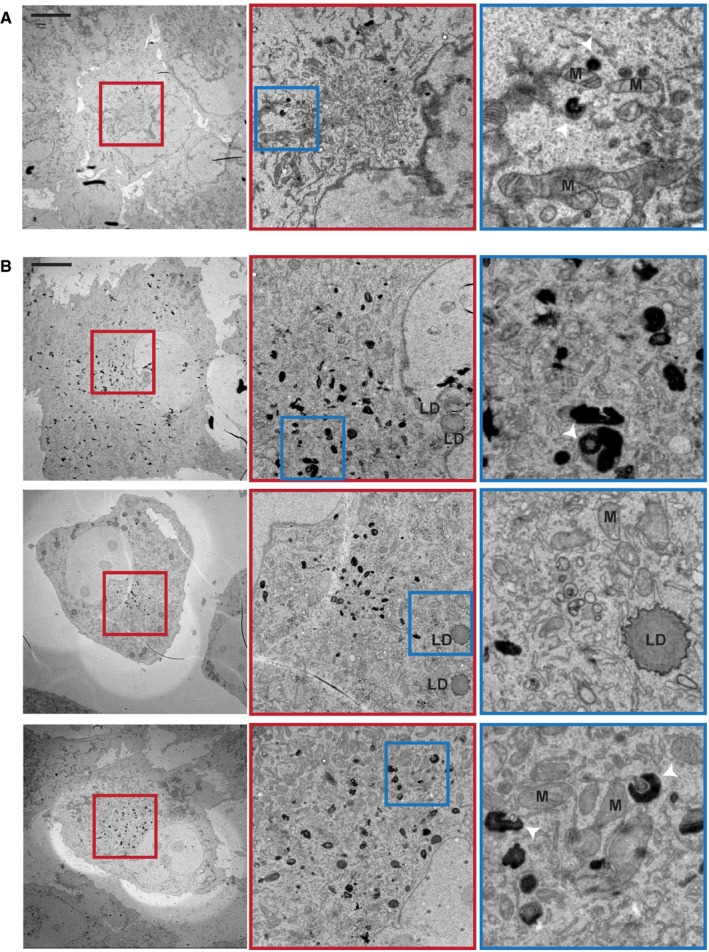
- A, B
H4 Cas9 (A) and H4 Cas9 TMEM41B KO clone 6 (B) cells were analyzed by transmission electron microscopy. Representative images are shown at the level of the entire cell, the juxtanuclear space as well as an inlet thereof. Mitochondria (M), lipid droplets (LD), and electron‐dense structures (white arrowheads) are indicated. Scale bar: 10 μm.
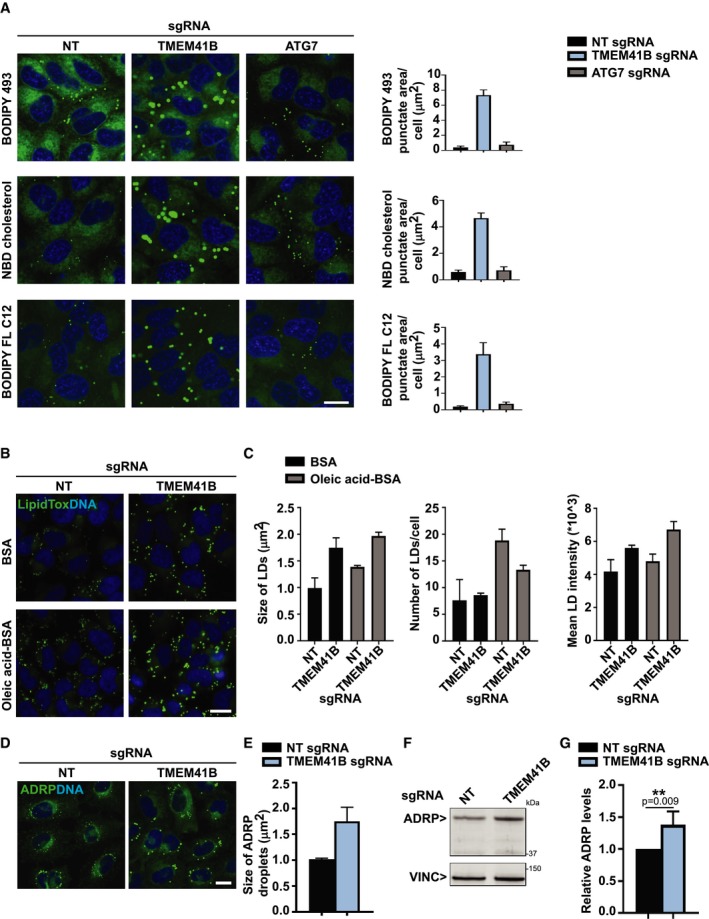
H4 Cas9 cells stably expressing NT, TMEM41B, or ATG7 sgRNAs were stained with BODIPY 493, NBD cholesterol, or BODIPY FL C12 probes for 2 h at 37°C and imaged live with an automated CV7000 confocal microscope. Puncta area per cell was quantified using YAS and depicted as mean ± SD (n = 4 technical replicates). Scale bar: 20 μm.
H4 Cas9 TMEM41B KO and NT control cells were treated overnight with 400 μM BSA‐conjugated oleic acid or 0.1% BSA as vehicle control, stained for 2 h with HCS LipidTox Green Neutral Lipid Stain, and imaged with an automated Operetta microscope. Scale bar: 20 μm.
Lipid droplet size, number, and mean fluorescence intensity were quantified using Harmony software. Data are presented as mean ± SD (n = 3 technical replicates). An average of 1,500 cells was analyzed per replicate.
H4 Cas9 TMEM41B KO and NT control cells were probed by ADRP immunostaining and imaged with an automated CV7000 confocal microscope. Scale bar: 20 μm.
Size of ADRP droplets was quantified with YAS and depicted as mean ± SD (n = 3 technical replicates).
Protein level of ADRP was probed by immunoblotting in H4 Cas9 TMEM41B KO and NT control cells.
ADRP band intensities were quantified and depicted as mean ± SD (n = 4 independent experiments) with paired t‐test values.
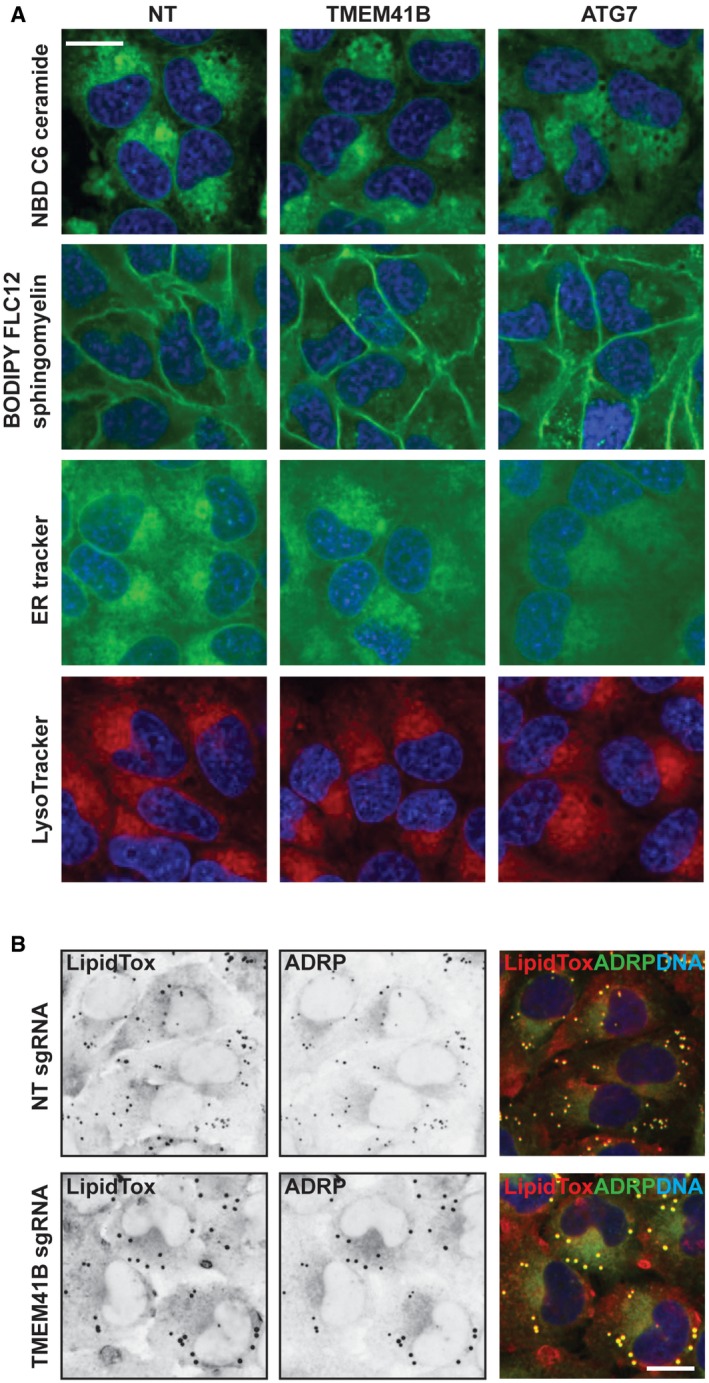
H4 Cas9 TMEM41B KO, ATG7 KO, and NT control cells were stained with NBD C6 ceramide, BODIPY FL C12 sphingomyelin, ER‐Tracker, or LysoTracker probes. After 2 h incubation at 37°C, cells were imaged live with an automated CV7000 confocal microscope using a 60× objective. Representative images are shown, and scale bar represents 20 μm.
H4 Cas9 TMEM41B KO and NT control cells were stained with ADRP antibodies and HCS LipidTox Deep Red Neutral Lipid Stain and imaged with an automated CV7000 confocal microscope. Representative images are shown, and scale bar represents 20 μm.
- A
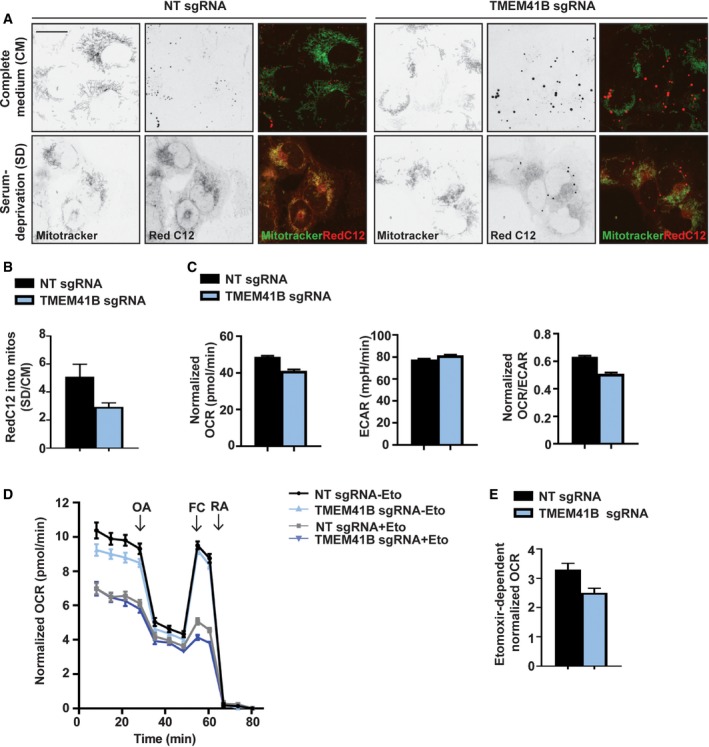
H4 Cas9 TMEM41B KO and NT control cells were pulsed with the fatty acid analog Red C12, chased in complete medium or upon serum deprivation, and stained with MitoTracker. Cells were imaged live with an automated CV7000 confocal microscope. Scale bar: 20 μm.
- B
Fatty acid Red C12 intensity was measured within MitoTracker signal, and ratio between SD and CM conditions was calculated. Data are presented as mean ± SD (n = 3 technical replicates).
- C–E
H4 Cas9 TMEM41B KO and NT control cells were plated in XF96 plates and analyzed using a Seahorse Bioscience XF96. (C) Basal oxygen consumption rates (OCR) and extracellular acidification rates (ECAR) were measured in cells grown in complete medium. OCR/ECAR ratio is also reported. Data are presented as mean ± SEM (n = 30–32 technical replicates) from one representative experiment. (D) OCR was measured in cells grown in substrate‐limited medium and treated in the absence or presence of Etomoxir (Eto). Oligomycin (OA), FCCP (FC), and a mixture of rotenone and antimycin A (RA) were added as indicated. Data are shown as mean ± SEM (n = 69 technical replicates). (E) Endogenous FA utilization was calculated by subtracting basal normalized OCR values of Eto‐treated cells from untreated cells. Data are shown as mean ± SEM (n = 69 technical replicates).
- A
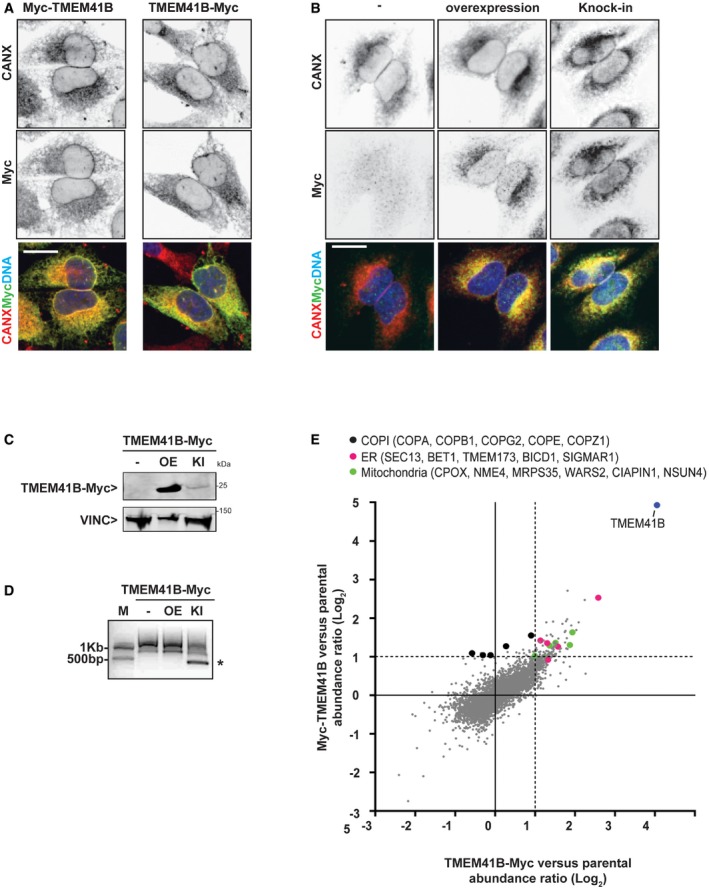
H4 Cas9 cells stably expressing N‐terminally (Myc‐TMEM41B) or C‐terminally Myc‐tagged TMEM41B (TMEM41B‐Myc) were probed by calnexin (CANX) and Myc tag immunostaining and imaged with an automated CV7000 confocal microscope. Scale bar: 20 μm.
- B–D
Endogenous TMEM41B locus was tagged with C‐terminal Myc using CRISPR‐directed homologous recombination in HeLa cells. HeLa knock‐in (KI) cells were compared to parental HeLa (−) and HeLa cells stably transduced with a TMEM41B‐Myc overexpression (OE) construct. (B) Confocal micrographs of cells stained with antibodies against CANX and Myc confirming ER localization of both KI and OE TMEM41B‐Myc. Scale bar represents 20 μm. (C) Immunoblot analysis confirming expression of both KI and OE TMEM41B‐Myc. (D) PCR analysis with primers binding to TMEM41B last intron and to Myc tag confirming successful targeting of the endogenous TMEM41B locus with Myc (band labeled with asterisk). M = size marker.
- E
H4 Cas9 cells and H4 Cas9 cells stably expressing Myc‐TMEM41B or TMEM41B‐Myc were lysed and subjected to anti‐Myc IP. Eluates were analyzed by mass spectrometry. Enrichment of proteins in IPs from Myc‐TMEM41B or TMEM41B‐Myc cells versus H4 Cas9 cells is depicted as log2 fold changes. Entire data are reported in Dataset EV2.
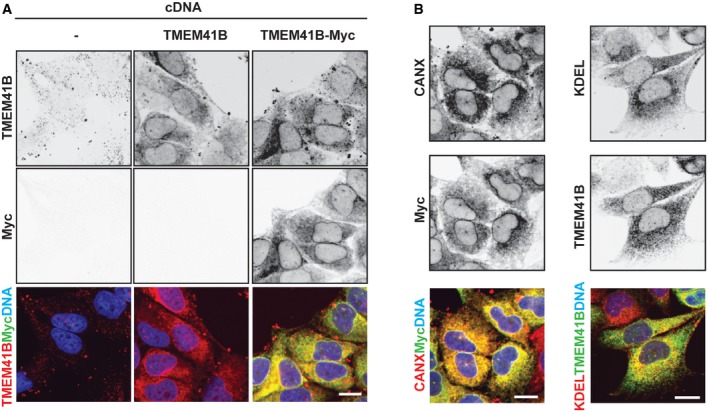
H4 Cas9 cells were transduced with untagged or Myc‐tagged TMEM41B expression constructs, and stable cell populations were selected by antibiotics treatment. Cells were plated into a 96‐well plate, fixed, stained with antibodies directed against Myc epitope or TMEM41B, and imaged with an automated CV7000 confocal microscope. Note that the Myc signal appears virtually absent in untransduced cells (−) and for untagged TMEM41B as exposure settings were kept constant for all conditions. Scale bar: 20 μm.
H4 Cas9 cells expressing C‐terminally Myc‐tagged TMEM41B were probed for Myc epitope, CANX, or KDEL and imaged with an automated CV7000 confocal microscope. Scale bar: 20 μm.
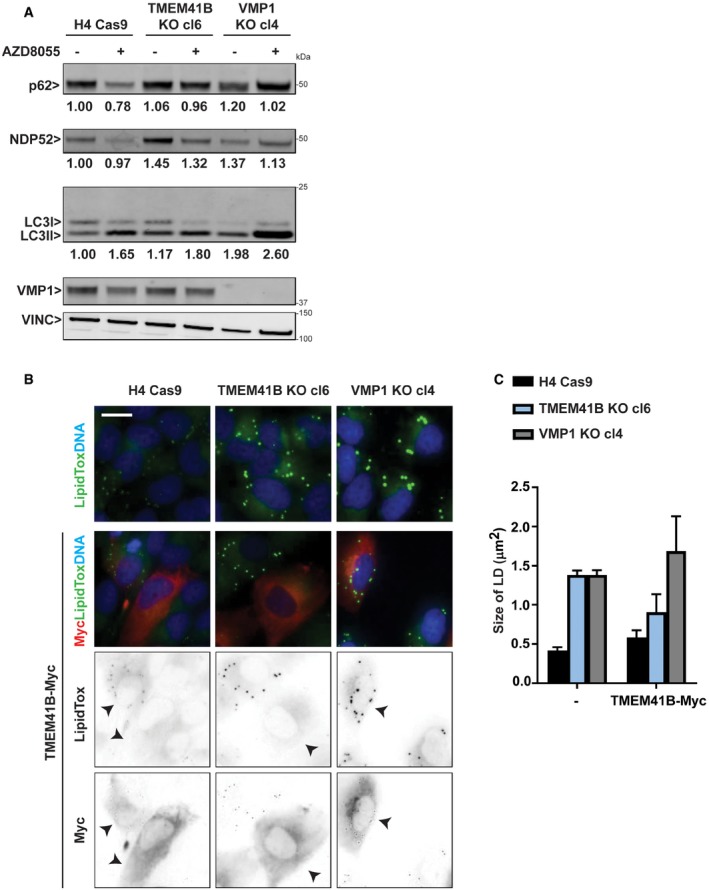
H4 Cas9, H4 Cas9 TMEM41B KO clone 6, and H4 Cas9 VMP1 KO clone 4 cells were treated overnight with 500 nM AZD8055 or vehicle control and analyzed by immunoblot. Band intensities were quantified by ImageJ, and values from one experiment are depicted for p62, NDP52, and LC3‐II:I ratio.
H4 Cas9, H4 Cas9 TMEM41B KO clone 6, and H4 Cas9 VMP1 KO clone 4 cells were infected with TMEM41B‐Myc lentivirus as indicated, fixed 72 h post‐infection, and stained with HCS LipidTox Green Neutral Lipid Stain and anti‐Myc antibodies. Cells were imaged on an automated Operetta microscope. Representative images are shown, and scale bar represents 20 μm. Arrowheads indicate Myc‐positive cells.
Lipid droplet size was quantified using Harmony software. For infected condition, only Myc‐positive cells were included in the analysis. Data are depicted as mean ± SD (n = 3 technical replicates).
Comment in
-
A novel regulator of autophagosome biogenesis and lipid droplet dynamics.EMBO Rep. 2018 Sep;19(9):e46858. doi: 10.15252/embr.201846858. Epub 2018 Aug 21. EMBO Rep. 2018. PMID: 30131347 Free PMC article.
Similar articles
-
Regulation of ER-derived membrane dynamics by the DedA domain-containing proteins VMP1 and TMEM41B.EMBO Rep. 2022 Feb 3;23(2):e53894. doi: 10.15252/embr.202153894. Epub 2022 Jan 19. EMBO Rep. 2022. PMID: 35044051 Free PMC article. Review.
-
Genome-wide CRISPR screen identifies TMEM41B as a gene required for autophagosome formation.J Cell Biol. 2018 Nov 5;217(11):3817-3828. doi: 10.1083/jcb.201804132. Epub 2018 Aug 9. J Cell Biol. 2018. PMID: 30093494 Free PMC article.
-
The autophagy protein ATG9A enables lipid mobilization from lipid droplets.Nat Commun. 2021 Nov 19;12(1):6750. doi: 10.1038/s41467-021-26999-x. Nat Commun. 2021. PMID: 34799570 Free PMC article.
-
TMEM41B and VMP1 are scramblases and regulate the distribution of cholesterol and phosphatidylserine.J Cell Biol. 2021 Jun 7;220(6):e202103105. doi: 10.1083/jcb.202103105. J Cell Biol. 2021. PMID: 33929485 Free PMC article.
-
Autophagosome formation in relation to the endoplasmic reticulum.J Biomed Sci. 2020 Oct 22;27(1):97. doi: 10.1186/s12929-020-00691-6. J Biomed Sci. 2020. PMID: 33087127 Free PMC article. Review.
Cited by
-
Targeting autophagy can synergize the efficacy of immune checkpoint inhibitors against therapeutic resistance: New promising strategy to reinvigorate cancer therapy.Heliyon. 2024 Sep 3;10(18):e37376. doi: 10.1016/j.heliyon.2024.e37376. eCollection 2024 Sep 30. Heliyon. 2024. PMID: 39309904 Free PMC article. Review.
-
Scramblases as Regulators of Autophagy and Lipid Homeostasis: Implications for NAFLD.Autophagy Rep. 2022;1(1):143-160. doi: 10.1080/27694127.2022.2055724. Epub 2022 Apr 7. Autophagy Rep. 2022. PMID: 35509327 Free PMC article.
-
Regulation of ER-derived membrane dynamics by the DedA domain-containing proteins VMP1 and TMEM41B.EMBO Rep. 2022 Feb 3;23(2):e53894. doi: 10.15252/embr.202153894. Epub 2022 Jan 19. EMBO Rep. 2022. PMID: 35044051 Free PMC article. Review.
-
CRISPR-Cas system to discover host-virus interactions in Flaviviridae.Virol J. 2023 Oct 27;20(1):247. doi: 10.1186/s12985-023-02216-7. Virol J. 2023. PMID: 37891676 Free PMC article. Review.
-
The Emerging Roles of Autophagy in Human Diseases.Biomedicines. 2021 Nov 9;9(11):1651. doi: 10.3390/biomedicines9111651. Biomedicines. 2021. PMID: 34829881 Free PMC article. Review.
References
-
- Polson HE, de Lartigue J, Rigden DJ, Reedijk M, Urbe S, Clague MJ, Tooze SA (2010) Mammalian Atg18 (WIPI2) localizes to omegasome‐anchored phagophores and positively regulates LC3 lipidation. Autophagy 6: 506–522 - PubMed
Publication types
MeSH terms
Substances
Grants and funding
LinkOut - more resources
Full Text Sources
Other Literature Sources
Molecular Biology Databases
