

A Universal Scaling Relation for Defining Power Spectral Bands in Mammalian Heart Rate Variability Analysis
- PMID: 30116198
- PMCID: PMC6083004
- DOI: 10.3389/fphys.2018.01001
A Universal Scaling Relation for Defining Power Spectral Bands in Mammalian Heart Rate Variability Analysis
Abstract
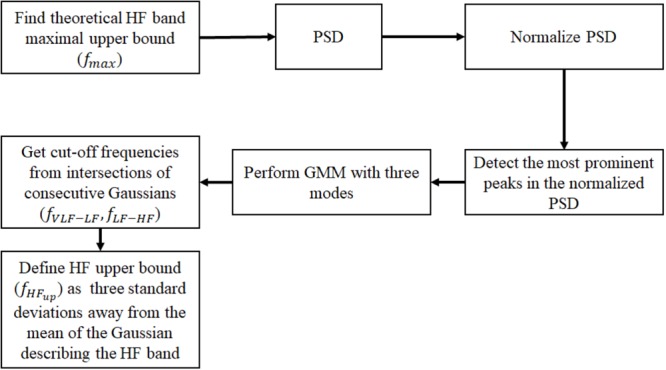
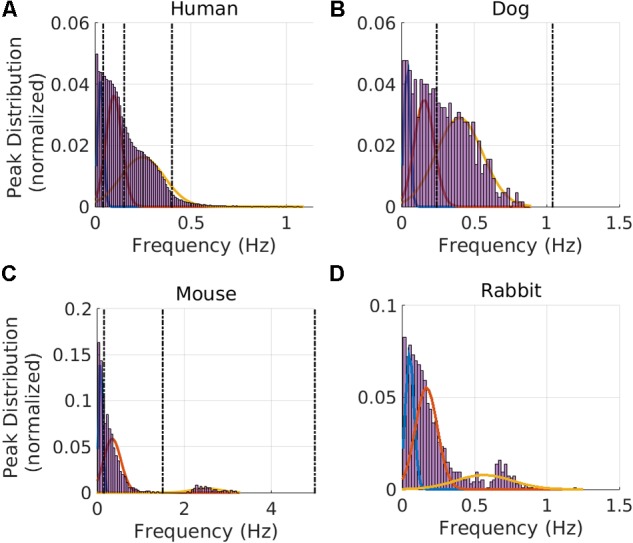
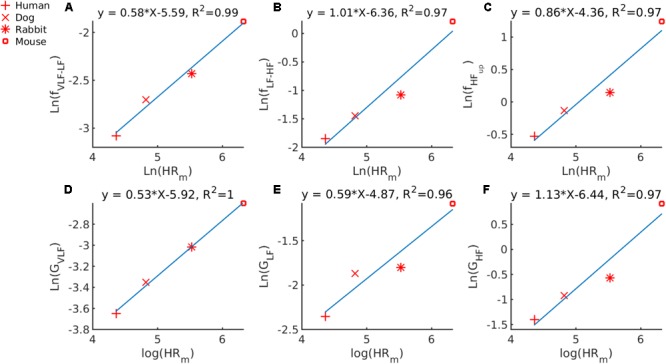
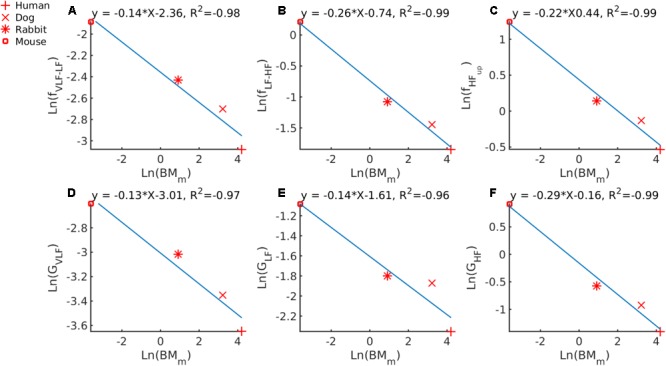
Background: Power spectral density (PSD) analysis of the heartbeat intervals in the three main frequency bands [very low frequency (VLF), low frequency (LF), and high frequency (HF)] provides a quantitative non-invasive tool for assessing the function of the cardiovascular control system. In humans, these frequency bands were standardized following years of empirical evidence. However, no quantitative approach has justified the frequency cutoffs of these bands and how they might be adapted to other mammals. Defining mammal-specific frequency bands is necessary if the PSD analysis of the HR is to be used as a proxy for measuring the autonomic nervous system activity in animal models. Methods: We first describe the distribution of prominent frequency peaks found in the normalized PSD of mammalian data using a Gaussian mixture model while assuming three components corresponding to the traditional VLF, LF and HF bands. We trained the algorithm on a database of human electrocardiogram recordings (n = 18) and validated it on databases of dogs (n = 17) and mice (n = 8). Finally, we tested it to predict the bands for rabbits (n = 4) for the first time. Results: Double-logarithmic analysis demonstrates a scaling law between the GMM-identified cutoff frequencies and the typical heart rate (HRm): fVLF-LF = 0.0037⋅ , fLF-HF = 0.0017⋅ and fHFup = 0.0128⋅ . We found that the band cutoff frequencies and Gaussian mean scale with a power law of 1/4 or 1/8 of the typical body mass (BMm), thus revealing allometric power laws. Conclusion: Our automated data-driven approach allowed us to define the frequency bands in PSD analysis of beat-to-beat time series from different mammals. The scaling law between the band frequency cutoffs and the HRm can be used to approximate the PSD bands in other mammals.
Keywords: animal models; heart rate variability; mammals; power allometric law; power spectral analysis.
Figures
Similar articles
-
Spectral Power Distribution of Heart Rate Variability in Contiguous Short-Term Intervals.Cureus. 2024 Aug 19;16(8):e67221. doi: 10.7759/cureus.67221. eCollection 2024 Aug. Cureus. 2024. PMID: 39295664 Free PMC article.
-
Beat-to-beat blood pressure variability and heart rate variability in relation to autonomic dysregulation in patients with acute mild-moderate ischemic stroke.J Clin Neurosci. 2019 Jun;64:187-193. doi: 10.1016/j.jocn.2019.03.003. Epub 2019 Mar 12. J Clin Neurosci. 2019. PMID: 30876936
-
Heart rate variability in passive tilt test: comparative evaluation of autoregressive and FFT spectral analyses.Pacing Clin Electrophysiol. 1998 May;21(5):1122-32. doi: 10.1111/j.1540-8159.1998.tb00159.x. Pacing Clin Electrophysiol. 1998. PMID: 9604245
-
[The effect of orthostatic provocation on the spectral pattern of heart rate variability in healthy subjects].Przegl Lek. 1996;53(7):534-9. Przegl Lek. 1996. PMID: 8975288 Clinical Trial. Polish.
-
Heart rate variability. Frequency domain analysis.Cardiol Clin. 1992 Aug;10(3):499-537. Cardiol Clin. 1992. PMID: 1504981 Review.
Cited by
-
Increased fibroblast growth factor-21 in chronic kidney disease is a trade-off between survival benefit and blood pressure dysregulation.Sci Rep. 2019 Dec 17;9(1):19247. doi: 10.1038/s41598-019-55643-4. Sci Rep. 2019. PMID: 31848393 Free PMC article.
-
A fully implantable wireless bidirectional neuromodulation system for mice.Biosens Bioelectron. 2022 Mar 15;200:113886. doi: 10.1016/j.bios.2021.113886. Epub 2021 Dec 11. Biosens Bioelectron. 2022. PMID: 34995836 Free PMC article.
-
PhysioZoo: A Novel Open Access Platform for Heart Rate Variability Analysis of Mammalian Electrocardiographic Data.Front Physiol. 2018 Oct 4;9:1390. doi: 10.3389/fphys.2018.01390. eCollection 2018. Front Physiol. 2018. PMID: 30337883 Free PMC article.
-
Revisiting the Sequence Method for Baroreflex Analysis.Front Neurosci. 2019 Jan 23;13:17. doi: 10.3389/fnins.2019.00017. eCollection 2019. Front Neurosci. 2019. PMID: 30728765 Free PMC article.
-
Revealing alterations in heart rate fluctuations during the progression of Chagas disease.Front Med (Lausanne). 2024 Sep 10;11:1438077. doi: 10.3389/fmed.2024.1438077. eCollection 2024. Front Med (Lausanne). 2024. PMID: 39318596 Free PMC article.
References
-
- Adachi Y., Nakajima Y., Satomoto M., Morita K., Doi M., Sato S. (2006). The heart rate variability in mice: telemetric evaluation of endotoxin shock. Masui 55 436–440. - PubMed
-
- Ahmed A. K., Harness J. B., Mearns A. J. (1982). Respiratory control of heart rate. Eur. J. Appl. Physiol. Occup. Physiol. 50 95–104. 10.1007/BF00952248 - DOI
Grants and funding
LinkOut - more resources
Full Text Sources
Other Literature Sources
Research Materials
Miscellaneous