. 2018 Aug 7;9(4):e01408-18.
doi: 10.1128/mBio.01408-18.

Heterosubtypic Protections against Human-Infecting Avian Influenza Viruses Correlate to Biased Cross-T-Cell Responses

Affiliations

Heterosubtypic Protections against Human-Infecting Avian Influenza Viruses Correlate to Biased Cross-T-Cell Responses

Min Zhao et al. mBio. .

Abstract

Against a backdrop of seasonal influenza virus epidemics, emerging avian influenza viruses (AIVs) occasionally jump from birds to humans, posing a public health risk, especially with the recent sharp increase in H7N9 infections. Evaluations of cross-reactive T-cell immunity to seasonal influenza viruses and human-infecting AIVs have been reported previously. However, the roles of influenza A virus-derived epitopes in the cross-reactive T-cell responses and heterosubtypic protections are not well understood; understanding those roles is important for preventing and controlling new emerging AIVs. Here, among the members of a healthy population presumed to have previously been infected by pandemic H1N1 (pH1N1), we found that pH1N1-specific T cells showed cross- but biased reactivity to human-infecting AIVs, i.e., H5N1, H6N1, H7N9, and H9N2, which correlates with distinct protections. Through a T-cell epitope-based phylogenetic analysis, the cellular immunogenic clustering expanded the relevant conclusions to a broader range of virus strains. We defined the potential key conserved epitopes required for cross-protection and revealed the molecular basis for the immunogenic variations. Our study elucidated an overall profile of cross-reactivity to AIVs and provided useful recommendations for broad-spectrum vaccine development.IMPORTANCE We revealed preexisting but biased T-cell reactivity of pH1N1 influenza virus to human-infecting AIVs, which provided distinct protections. The cross-reactive T-cell recognition had a regular pattern that depended on the T-cell epitope matrix revealed via bioinformatics analysis. Our study elucidated an overall profile of cross-reactivity to AIVs and provided useful recommendations for broad-spectrum vaccine development.

Keywords: T-cell responses; avian influenza viruses; cross-reactivity; heterosubtypic protection.


Figures

FIG 1
FIG 1
Humoral immune responses to pH1N1 and AIVs. (A and B) Humoral responses of healthy donors (n = 35) were detected by HAI assays (A) and MN assays (B) with A(H1N1)/California/4/2009, A(H5N1)/Vietnam/1194/2004, A(H6N1)/Taiwan/2/2013, A(H7N9)/Anhui/1/2013, or A(H9N2)/Hong Kong/1073/99. Dashed lines indicate the following cutoff values: 40 for the HAI assays and 80 for the MN assays. (C) Locations of the major antigenic sites for antibody binding of the HA protein are marked based on the structures of the pH1N1 HA protein (PDB code 4JTV), H5N1 HA (PDB code 3ZNK), H6N1 HA (PDB code 4YY9), H7N9 HA (PDB code 4KO1), and H9N2 HA (PDB code 1JSD). The mutant sites in the HA protein of each subtype in B-cell epitopes compared to pH1N1 HA protein are marked with different colors (H5N1 as red, H6N1 as green, H7N9 as blue, and H9N2 as dark gray). (D) Sequences of B cell epitopes are shown in the table. (E) The phylogenetic relationship of the representative human-infecting AIV strains and pH1N1 were analyzed by the maximum-likelihood method with MEGA 6. The names of the viruses we used in HAI and MN assays are denoted with black characters. HAI, HA inhibition; MN, microneutralization.
FIG 2
FIG 2
Cross-reactive cellular immune responses to avian influenza viruses. (A) Cellular immune responses of pH1N1 antibody-positive healthy donors to pH1N1, H5N1, H6N1, H7N9, and H9N2. T-cell responses were investigated using freshly isolated PBMCs from individuals (n = 11) through IFN-γ ELISPOT assays with live viruses. (B) pH1N1-specific T cells in PBMCs from individuals (n = 20) were expanded by stimulation with the pH1N1 M1 peptide pool for 9 days, and the T-cell responses were determined through IFN-γ ELISPOT assays using pools of overlapping peptides derived from influenza virus M1 protein. (C and D) The ratios of influenza virus-specific IFN-γ-secreting cells in CD8+ (C) and CD4+ (D) T-cell levels were determined using ICS and flow cytometry. The frequencies of virus-specific T-cell responses to AIVs were compared with the frequencies of responses to the pH1N1 M1 pool (n = 8). (E and F) Representatives of virus-specific T cells in CD8+ (E) and CD4+ (F) T cells are shown. (G to J) T-cell responses to the M1 antigen and NP antigen of pH1N1 and H7N9 before and after culturing with M1 pools or NP pools of pH1N1 and H7N9 were compared through IFN-γ ELISPOT and ICS assays. (I) The T-cell responses of freshly isolated PBMCs from the healthy donors to the pH1N1 NP pool and H7N9 NP pool were compared using IFN-γ ELISPOT assays. (J) PBMCs were cultured with the pH1N1 NP pool and tested on the ninth day using IFN-γ ELISPOT assays. The T-cell responses to M1 pools of these two viruses were tested at the same time as the control (G, fresh PBMCs; H, PBMCs cultured in vitro with M1). (K and L) NP-specific T-cell responses to pH1N1 and H7N9 tested in ICS assays using PBMCs cultured in vitro with the pH1N1 NP pool for 9 days. Data in panels A, B, and G to J are shown as means + SEM (standard errors of the means), and data in panels C and D are shown as medians. The differences among multiple groups were compared using ANOVA (A to D), and differences between two groups were compared using Student’s t test (E to H). *, P < 0.05; **, P < 0.001; ***, P < 0.0001.
FIG 3
FIG 3
Phenotype and functional characterization of influenza virus-specific T cells. (A) Frequencies of influenza virus-specific T cells were determined via IFN-γ staining using ICS assays. (B) The memory phenotype of influenza virus-specific T cells was determined by the use of CD62L and CD45RA after stimulation with pH1N1 live virus, the M1 peptide pool, and the NP peptide pool of pH1N1. Characteristics of the virus-specific CD8+ T cells are shown on the first row in panel B, and those of virus-specific CD4+ T cells are shown on the second row in panel B. The cross-quadrant gate on the virus-specific T cells was determined by the gate of the PBMCs, shown on the third row in panel B. (C and D) The median ratios of each phenotype of the IFN-γ-secreting CD8+ T cells (C) and CD4+ T cells (D) from six individuals are shown in the pie graphs.
FIG 4
FIG 4
Immunoinformatic analysis of cellular antigenicities. Phylogenetic analyses based on protein sequence (A, C, and E) and CTL epitopes (B, D, and F) of the T-cell antigens M1, NP, and PB1 were performed using MEGA6. The human-infecting AIVs (H5N1, H6N1, H7N9, and H9N2) together with the H1N1 strains (including pH1N1 strains and seasonal H1N1 strains from before 2009 and also 1918 H1N1) are represented with different colors. The clusters of pH1N1 strains are denoted with purple dotted squares. The clusters of human-infecting H5N1 strains are presented as brown dotted squares. The black triangles indicate the five virus strains A (H1N1)/California/4/2009, A(H5N1)/Vietnam/1194/2004, A(H6N1)/Taiwan/2/2013, A(H7N9)/Anhui/1/2013, and A(H9N2)/Hong Kong/1073/99 used in this study. (G) Bioinformatics analysis of the potential cellular antigenicities of different AIVs based on the previously determined T-cell epitopes available in the Immune Epitope Data Base (IEDB) on the heat map. Peptides within different viruses were extracted as predicted T-cell epitopes of the representative sequences. We counted the number of residues of each predicted T-cell epitope using A/California/04/2009 as a reference. The maximum-likelihood phylogenetic trees for T-cell epitope sequences were constructed using Molecular Evolutionary Genetics Analysis MEGA6 software with the JTT model and 1,000 bootstrap replicates. The virus and peptide information used for analysis of the data presented in panel G is presented in Table S6 and S7. Eleven epitopes that are conserved in H5N1 and pH1N1 strains but that different from those in other AIVs are framed with a black rectangle. (H) The sequences of each strain were compared to the sequence of A(H1N1)/California/04/2009 virus, and mutant sites are highlighted in red (potential TCR docking sites) or yellow (anchor residue sites). Peptide M1 (99–109; underlined) indicates peptide H1-P25. The sequence information from the 11 peptides is presented in Table S3. pH1N1, 2009 pandemic influenza virus cluster; sH1N1, seasonal H1N1 strains before 2009 (but the data also include the 1918 H1N1 strain).
FIG 5
FIG 5
Molecular bases of the biased cross-T-cell reactivities. (A) An individual CD8+ T-cell epitope that has antigenic variation between pH1N1 (H1-P25, similar peptide in H5N1) and H7N9 (H7-P25) was determined among different donors with HLA-A*2402 restrictions. PBMCs from different donors were tested via the IFN-γ ELISPOT assay by stimulation with individual H1-P25 and H7-P25 peptides. Abbreviation: SFC, spot-forming cell. (B) Tetramers of HLA-A*2402 complexed to H1-P25 or H7-P25 were prepared and utilized to stain influenza virus-specific T cells. (C) Binding of peptides H1-P25 and H7-P25 to HLA-A*2402 was elucidated by in vitro refolding. Peptides with the ability to bind to HLA-A*2402 help the HLA-A*2402 H chain to refold in vitro in the presence of β2m. After properly refolding, the high absorbance peaks of HLA-A*2402 with the expected molecular mass of 45-kDa eluted at the estimated volume of 16 ml on a Superdex 200 10/300 GL column. The profile is marked with the approximate positions of the molecular mass standards of 67.0, 35.0, and 14.0 kDa. (D) Thermostability of HLA-A*2402/H1-P25 and HLA-A*2402/H7-P25 complexes as revealed by CD spectroscopy. The Tms of different peptides are indicated by the gray dashed line at the 50% unfolded fraction. (E) The conformational superposition of H1-P25 (orange) and H7-P25 (blue; based on data set 1 of HLA-A*2402/H7-P25) presented by HLA-A*2402 observed by a side view. The residues are denoted with a single-letter name together with a position number. The I9M substitution and changed-conformation residue K4 of H1-P25 (orange) and H7-P25 (blue; based on data set 1 of HLA-A*2402/H7-P25) are labeled with different colors. (F) The conformational superposition of H1-P25 (orange) and H7-P25 (blue) presented by HLA-A*2402 through a top view. (G) The binding of peptide H1-P25 to HLA-A*2402. Residue I9 inserts its side chain into hydrophobic pocket E. Residue K4 forms a hydrogen bond with E8. The peptide binding groove is shown by the vacuum electrostatic surface potential of HLA-A*2402 H chain. (H) The location of peptide H7-P25 within the HLA-A*2402 groove based on data set 1 of HLA-A*2402/H7-P25. The side chain of the substituted residue M9 protrudes from pocket E. Residue K4 is also solvent exposed and is ready for TCR docking.
FIG 6
FIG 6
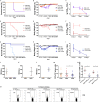
Different cross-protection efficacies against H5N1 and H7N9 provided by pH1N1-specific T cells. Mice were preinfected with pH1N1 virus (103.8 TCID50) and, 28 days later, challenged with a lethal dose of A(H1N1)/California/4/2009 (105.8 TCID50) (A to C), A(H5N1)/Vietnam/1194/2004 (105.2 TCID50) (D to F), or A/Anhui/1/2013 (H7N9) (105.6 TCID50) (G to I), as well as with PBS as a control. Survival status, body weight, and viral titration of lung homogenates were determined (A to I). The numbers of mice used for survival and weight analyses were as follows: n = 9 for PBS-PBS, n = 10 for PBS-H1N1, n = 10 for PBS-H5N1, n = 7 for PBS-H7N9, n = 10 for H1N1-PBS, n = 10 for H1N1-H1N1, n = 10 for H1N1-H5N1, and n = 9 for H1N1 to H7N9. (A, D, and G) Survival was recorded following the second virus infection. (B, E, and H) Body weight losses are presented as mean percentages of the weight differences of the animals relative to their weight on the day prior to inoculation. (C, F, and I) Lung homogenate samples were collected at 3, 7, and 14 days postinfection. Data are shown with the mean ± SEM virus titers of three mice per time point. (J) Levels of antibodies to pH1N1, H5N1, and H7N9 of H1N1-positive serum samples were tested by MN assay. (K and L) Levels of antibodies to pH1N1 and H5N1 in H5N1-positive serum samples (K) and levels of antibodies to pH1N1 and H7N9 of H7N9-positive serum samples (L) were also tested. (M) Cross-reactive T-cell responses to H5N1 and H7N9 of spleen cells isolated from mice infected with pH1N1 for 2 weeks were determined by IFN-γ ELISPOT assays. (N and O) pH1N1-specific CD8+ T cells of pH1N1-primed mice were stained with tetramers H1-NP366−374 (complex between H-2Db and peptide from H1N1), H5/H7-NP366−374 (complex between H-2Db and peptide from H5N1/H7N9), H1-PA224−233 (complex between H-2Db and peptide from H1N1), and H1-PA224−233 (complex between H-2Db and peptide from H5N1/H7N9). CD8+ T cells were subsequently selected for the analysis of tetramers (n = 4). Differences between two groups were compared using Student’s t test (J to L and N), and differences among multiple groups were compared using ANOVA (M). *, P < 0.05.

Similar articles

Cited by

References

    1. Cheng VC, To KK, Tse H, Hung IF, Yuen KY. 2012. Two years after pandemic influenza A/2009/H1N1: what have we learned? Clin Microbiol Rev 25:223–263. doi:10.1128/CMR.05012-11. - DOI - PMC - PubMed
    1. Gaglani M, Pruszynski J, Murthy K, Clipper L, Robertson A, Reis M, Chung JR, Piedra PA, Avadhanula V, Nowalk MP, Zimmerman RK, Jackson ML, Jackson LA, Petrie JG, Ohmit SE, Monto AS, McLean HQ, Belongia EA, Fry AM, Flannery B. 2016. Influenza vaccine effectiveness against 2009 pandemic influenza A(H1N1) virus differed by vaccine type during 2013–2014 in the United States. J Infect Dis 213:1546–1556. doi:10.1093/infdis/jiv577. - DOI - PMC - PubMed
    1. Van Kerkhove MD, Hirve S, Koukounari A, Mounts AW; H1N1pdm serology working group. 2013. Estimating age-specific cumulative incidence for the 2009 influenza pandemic: a meta-analysis of A(H1N1)pdm09 serological studies from 19 countries. Influenza Other Respir Viruses 7:872–886. doi:10.1111/irv.12074. - DOI - PMC - PubMed
    1. Peiris M, Yuen KY, Leung CW, Chan KH, Ip PL, Lai RW, Orr WK, Shortridge KF. 1999. Human infection with influenza H9N2. Lancet 354:916–917. doi:10.1016/S0140-6736(99)03311-5. - DOI - PubMed
    1. Shi W, Li W, Li X, Haywood J, Ma J, Gao GF, Liu D. 2014. Phylogenetics of varied subtypes of avian influenza viruses in China: potential threat to humans. Protein Cell 5:253–257. doi:10.1007/s13238-014-0036-1. - DOI - PMC - PubMed

Publication types

LinkOut - more resources