. 2018 Sep;24(9):1430-1440.
doi: 10.1038/s41591-018-0130-7. Epub 2018 Aug 6.

Early antiretroviral therapy limits SIV reservoir establishment to delay or prevent post-treatment viral rebound

Affiliations

Early antiretroviral therapy limits SIV reservoir establishment to delay or prevent post-treatment viral rebound

Afam A Okoye et al. Nat Med. 2018 Sep.

Abstract

Prophylactic vaccination of rhesus macaques with rhesus cytomegalovirus (RhCMV) vectors expressing simian immunodeficiency virus (SIV) antigens (RhCMV/SIV) elicits immune responses that stringently control highly pathogenic SIV infection, with subsequent apparent clearance of the infection, in ~50% of vaccinees. In contrast, here, we show that therapeutic RhCMV/SIV vaccination of rhesus macaques previously infected with SIV and given continuous combination antiretroviral therapy (cART) beginning 4-9 d post-SIV infection does not mediate measurable SIV reservoir clearance during over 600 d of follow-up on cART relative to RhCMV/control vaccination. However, none of the six animals started on cART on day four or five, across both RhCMV/SIV- and RhCMV/control-vaccinated groups, those rhesus macaques with SIV reservoirs most closely resembling those of prophylactically RhCMV/SIV-vaccinated and protected animals early in their course, showed post-cART viral rebound with up to nine months of follow-up. Moreover, at necropsy, these rhesus macaques showed little to no evidence of replication-competent SIV. These results suggest that the early SIV reservoir is limited in durability and that effective blockade of viral replication and spread in this critical time window by either pharmacologic or immunologic suppression may result in reduction, and potentially loss, of rebound-competent virus over a period of ~two years.


Conflict of interest statement

COMPETING FINANCIAL INTERESTS: OHSU, L.J.P., and S.G.H. have a significant financial interest in Vir Biotechnology, Inc., a company that may have a commercial interest in the results of this research and technology. The potential individual and institutional conflicts of interest have been reviewed and managed by OHSU.

Figures

Figure 1:
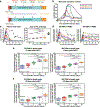
Figure 1:. Early cART limits virus dissemination.
(a) Schematic representation of the study protocol showing SIVmac239X infection, cART initiation 4–9 days post-infection (dpi), RhCMV/SIV or control vector vaccination at 91, 175 and 399 dpi, and cART withdrawal at 611 dpi. (b) The mean (+ SEM) frequencies of CD169 expression on CD14+ monocytes in blood of RM stratified by time of cART initiation i.e., 4–5 dpi (blue; n=6), 6 dpi (red; n=13), 7 dpi (green; n=10) or 8–9 dpi (purple; n=4). (c) Mean (+ SEM) plasma viral load (pvl) profiles (left panel) and pvl area under the curve (AUC) between 0–84 dpi (right panel) in RM stratified by time of cART initiation. Pvl profiles and AUC of unvaccinated, comparably SIVmac239-infected RM that initiated cART 12 dpi (orange; n=12) and 42 dpi (black; n=18) were included for comparison. Overall difference was determined by two-sided Kruskal-Wallis test (KW) and where that was significant (p-values ≤0.05), two-sided Wilcoxon rank-sum test (WRS) was used to determine the significance of pairwise differences in the AUC (WRS P values shown). Plots show jittered points with a box from 1st to 3rd quartiles and a line as the median, with whiskers extending to the farthest data point within 1.5*interquartile range (IQR) above and below the box, respectively. (d) Longitudinal quantification of SIV RNA (left) and DNA (right) in PBMC (mean+ SEM; copies per 106 cell equivalents) between 0–84 dpi in RM stratified by time of cART initiation. Threshold sensitivity varied as a function of the number of cells available for analysis; for graphing consistency values are plotted with a common nominal sensitivity threshold of 1 copy of SIV RNA or DNA per 108 cell equivalents, indicated by a dotted gray line. (e-f) Quantification of SIV RNA (left) and DNA (right) in LN (copies per 106 cell equivalents) at 3 and 70 days post-cART initiation. Each data point represents a single determination from an individual RM. (c-f) Sample sizes are as shown in (b), black (historical control) n=18 and orange (day 12) n=12. In c, e and f, the KW test was used to determine the significance of differences between day-of-cART initiation groups and when that test was significant (p-values ≤0.05), the WRS test was used to determine the significance of pairwise differences among the cART treatment groups (WRS P values shown). Plots show jittered points with a box from 1st to 3rd quartiles (IDR) and a line as the median, with whiskers extending to the farthest data point within 1.5*IQR above and below the box, respectively. The dotted gray line indicates threshold of 0.6 copies of SIV RNA or DNA per 106 cell equivalents. Days 7, 8, and 9 were pooled for these comparisons due to the small sample size at days 8 and 9 (n = 4 combined), with the overall n the same as in panels a and b. TDF, tenofovir disoproxil fumarate; FTC, emtricitabine (2’,3’-dideoxy-5-fluoro-3’-thiacytidine); DTG, dolutegravir.
Figure 2:
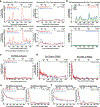
Figure 2:. RhCMV/SIV vector immunogenicity in cART-suppressed RM.
(a) Mean (+ SEM) frequencies of peripheral blood memory CD4+ (top panels) and CD8+ (bottom panels) T cells specific for SIV proteins (Gag, Rev/Tat/Nef, Env and Pol) expressed by RhCMV/SIV vectors, and for SIVvif (not included in the RhCMV/SIV vectors) in RhCMV/SIV-vaccinated RM (n=17) versus RhCMV/control vector-vaccinated RM (n=16). These response frequencies were determined by intracellular expression of TNF-α and/or IFN-γ after stimulation with mixes of consecutive, overlapping SIV 15mer peptides for each SIV protein (Gag, Env, Pol, Vif) or protein combination (Rev/Tat/Nef), as described in the Methods section, with the total response to the SIV proteins expressed by RhCMV/SIV vaccine reflecting the sum of the Gag, Rev/Tat/Nef, Env and Pol responses. RhCMV/SIV or RhCMV/control vaccine administration is indicated by arrows (b) Mean (+ SEM) frequencies of SIV Gag supertope responses [Gag53211–222 (AADWDLQHPQP, MHC-II-restricted); Gag69276–284 (RMYNPTNIL, MHC-E-restricted); Gag73290–301 (PKEPFQSYVDRF, MHC-II-restricted); Gag120482–490 (EKQRESREK, MHC-E-restricted,] within peripheral blood CD8+ memory T cell compartment of RhCMV/SIV vector-vaccinated RM (left panel; n=17) and control RhCMV vector-vaccinated RM (right panel; n=16). (c) Pvl (mean + SEM) profiles of RhCMV/SIV vector-vaccinated (n=17) and control RhCMV vector-vaccinated (n=16) RM on cART measured at a threshold of 30 RNA copies per ml from 0 – 175 dpi and 1 RNA copy per ml from 189 – 609 dpi (same groups as in a). AUC calculated based upon LOD=30 for all time points. (d-f) Longitudinal quantification of cell-associated SIV DNA (left) and SIV RNA (right) (mean + SEM; copies per 106 cell equivalents) in the designated tissues from RhCMV/SIV vector-vaccinated RM (n=17) versus the RhCMV/control (n=16) vector-vaccinated RM (RhCMV vaccination indicated by arrows). As described in Figure 1 legend, values are plotted with a common nominal sensitivity threshold of 1 copy of SIV RNA or DNA per 108 cell equivalents. In a and c-f, the two-sided WRS test was used to determine the significance of differences in the AUC (P values shown). CMV, cytomegalovirus; LOD, limit of detection.
Figure 3:
Figure 3:. Time of cART initiation affects virus rebound kinetics.
(a) Kaplan-Meier analysis of SIV rebound kinetics in RhCMV/SIV vector-vaccinated (n=17) and control RhCMV vector-vaccinated (n=16) RM post-cART cessation. The significance of the difference between groups was determined using a two-sided log-rank test (P value shown). (b) Pvl profiles after cART release stratified by vaccine group measured at a threshold of 1 RNA copy per ml. Early rebound (n=21; black) was defined as sustained rebound viremia occurring <40 days after cART release, late rebound (n=5; blue) defined as sustained viremia >40 days after cART release and no rebound (n=7; pink) defined as no sustained viremia through 180 days after cART release. (c) Pvl profiles after cART release of study RM stratified by time of cART initiation and measured at a threshold of 1 RNA copy per ml. (d) Kaplan-Meier analysis of SIV rebound kinetics by time of cART initiation. Significance of difference between groups was determined using a two-sided log-rank test (P values shown). (e) Spearman rank correlation between the AUC of pvl from 0–84 dpi versus time to virus rebound (two-sided rank correlation t test; P value shown). RM taken to necropsy after 205 dpi are plotted at the day of necropsy. In c-e, RM groups and sample sizes are the same as in Fig. 1b.
Figure 4:
Figure 4:. Analysis of residual replication-competent virus in post-cART non-rebounders.
(a) Effect of CD8+ lymphocyte depletion on absolute CD8+ T cell counts in blood (top panel) and pvl (bottom panel) in 3 RM with no viral rebound (red) vs a control group of 3 RM with post-cART rebound, but subsequent virologic control (black). RM received anti-CD8α M-T807R1 mAb at 10, 5, 5 and 5 mg per kg body weight on days 0, 3, 7 and 10. Note that CD8+ cell depletion increased plasma viremia by ~3-logs in the control group, but had no effect on pvl in the non-rebounders. (b) Assessment of residual replication-competent, cell-associated SIV by adoptive transfer of LN cells (6 x 106 to 1 x 108) from post-cART non-rebounders to SIV-naïve RM with the transfer of SIV infection to the recipient RM delineated by sustained, above threshold (15 RNA copies/ml) pvl. Cell transfers prior to 175 dpi resulted in rapid onset of SIV infection in the recipient RM, but no SIV infection was observed in RM receiving cells 720 dpi (109 days after cART cessation). (c) Assessment of residual replication-competent, cell-associated SIV by adoptive transfer of LN cells from two RM with post-cART rebound <180 days after cART release. Cell transfers from RM 27812 at 11 dpi resulted in rapid onset of SIV infection in the recipient RM, but no SIV infection was observed in RM receiving cells from either RM at 720 dpi. (d) Assessment of residual replication-competent, cell-associated SIV by adoptive transfer of LN cells from 720 dpi from a RM with post-cART rebound at necropsy (206 days post-cART cessation) to SIV-naive RM, showing no SIV infection in recipient RM, rhesus macaque.
Figure 5:
Figure 5:. Virological analysis of post-cART non-rebounders at necropsy.
(a-d) Quantification of cell-associated SIV DNA (blue) and SIV RNA (red) (copies per 106 cell equivalents) in the designated tissue samples of all 6 RM with no post-cART rebound viremia through necropsy, the RM with virus rebound at necropsy (pvl = 75,000 RNA copies/ml), a representative post-cART elite controller (pvl 270 RNA copies/ml), and a viremic progressor (pvl = 350,000 RNA copies/ml). Each symbol represents a single determination from a specimen of the designated tissue type (closed circles reflect DNA or RNA measurements above threshold; open circles DNA or RNA measurements below-the assay threshold (see Methods). Threshold values for individual samples varied as a function of the amount of tissue available and analyzed, and ranged from 0.7–18 copies/106 cell equivalents for DNA (mean 5.5 and median 2.8 copies per 106 cell equivalents, respectively) and from 0.6–148 copies/106 cell equivalents for RNA (mean 26 and median 4.1 copies/106 cell equivalents, respectively). Also shown in green are the frequencies of SIV+ cultures (2.5 × 10⁵ cells per culture) from the designated tissues after co-culture with CEMx174 for 17 days. (e) Detection of replication-competent SIV after 12 hr PMA/Ionomycin stimulation of sorted CD4+ T cells from LN or spleen (5 × 10⁵ sorted CD4+ cells per well co-cultured with CEMx174 for 21 days; the total number of cells analyzed from each RM is shown in the figure) from all 6 of the post-cART non-rebounders, the RM with virus rebound at necropsy, and a representative post-cART elite controller. (f) Assessment of residual replication-competent, cell-associated SIV in all 6 post-cART non-rebounders, and as a control, an elite controller by adoptive transfer of 1 x 108 hematolymphoid cells that were positive for SIV DNA at necropsy (including cells from LN, spleen and liver; see Table 1) to SIV-naïve RM. Cell transfer from the elite controller RM induced rapid onset of SIV infection in the recipient RM, but no SIV infection was observed in RM receiving cells from the 6 RM with no post-cART virus rebound. BM, bone marrow; LN, lymph node; GI, gastrointestinal; CNS, central nervous system; pos., positive; VOA, viral outgrowth assay.

Similar articles

Cited by

References

    1. Churchill MJ, et al. HIV reservoirs: what, where and how to target them. Nat Rev Microbiol 14, 55–60 (2016). - PubMed
    1. Del Prete GQ & Lifson JD Considerations in the development of nonhuman primate models of combination antiretroviral therapy for studies of AIDS virus suppression, residual virus, and curative strategies. Curr Opin HIV AIDS 8, 262–272 (2013). - PMC - PubMed
    1. Fukazawa Y, et al. B cell follicle sanctuary permits persistent productive simian immunodeficiency virus infection in elite controllers. Nat Med 21, 132–139 (2015). - PMC - PubMed
    1. Miles B & Connick E TFH in HIV latency and as sources of replication-competent virus. Trends Microbiol 24, 338–344 (2016). - PMC - PubMed
    1. Murray AJ, et al. The latent reservoir for HIV-1: how immunologic memory and clonal expansion contribute to HIV-1 persistence. J Immunol 197, 407–417 (2016). - PMC - PubMed

METHODS REFERENCES

    1. Loffredo JT, et al. Mamu-B*08-positive macaques control simian immunodeficiency virus replication. J Virol 81, 8827–8832 (2007). - PMC - PubMed
    1. Li H, et al. Envelope residue 375 substitutions in simian-human immunodeficiency viruses enhance CD4 binding and replication in rhesus macaques. Proc Natl Acad Sci U S A 113, E3413–3422 (2016). - PMC - PubMed
    1. Cline AN, et al. Highly sensitive SIV plasma viral load assay: practical considerations, realistic performance expectations, and application to reverse engineering of vaccines for AIDS. J Med Primatol 34, 303–312 (2005). - PubMed
    1. Venneti S, et al. Longitudinal in vivo positron emission tomography imaging of infected and activated brain macrophages in a macaque model of human immunodeficiency virus encephalitis correlates with central and peripheral markers of encephalitis and areas of synaptic degeneration. Am J Pathol 172, 1603–1616 (2008). - PMC - PubMed

Publication types

MeSH terms

LinkOut - more resources