. 2018 Aug 6;14(8):e1007206.
doi: 10.1371/journal.ppat.1007206. eCollection 2018 Aug.

The Epstein Barr virus circRNAome

Affiliations

The Epstein Barr virus circRNAome

Nathan Ungerleider et al. PLoS Pathog. .

Abstract

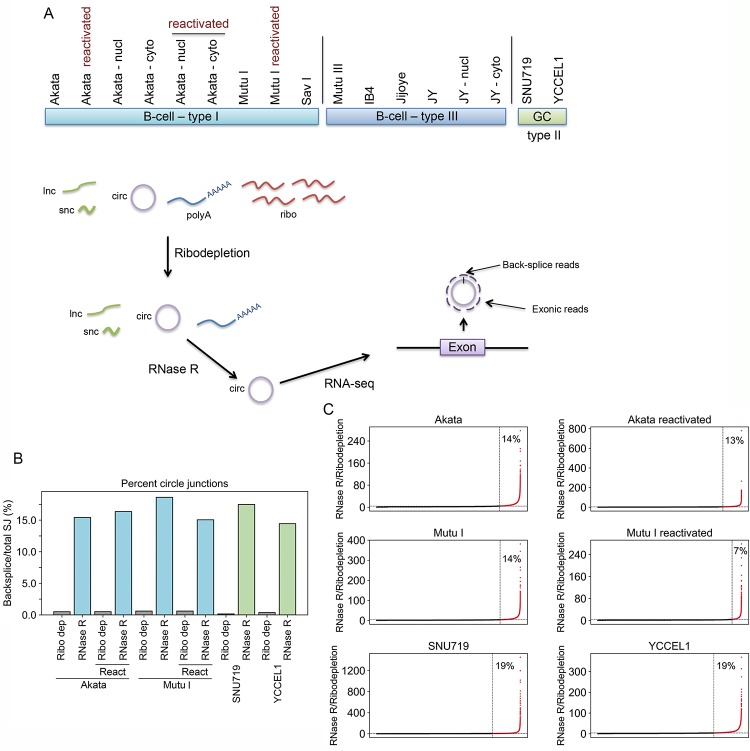
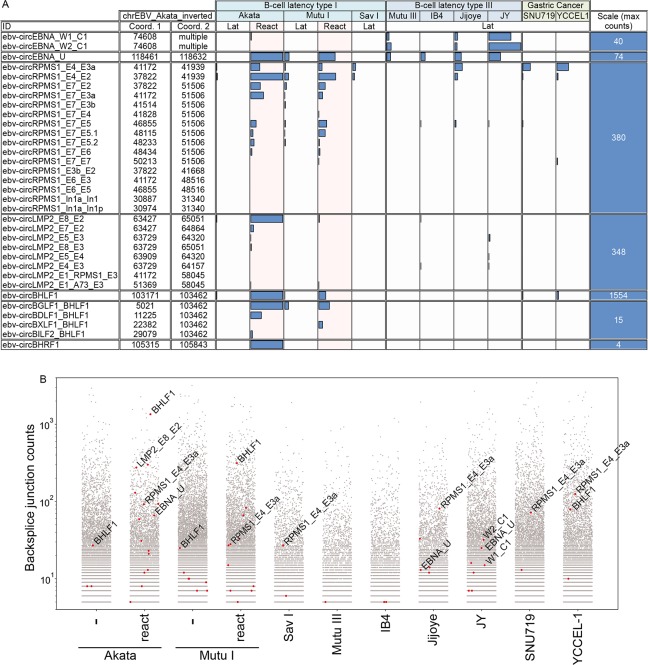
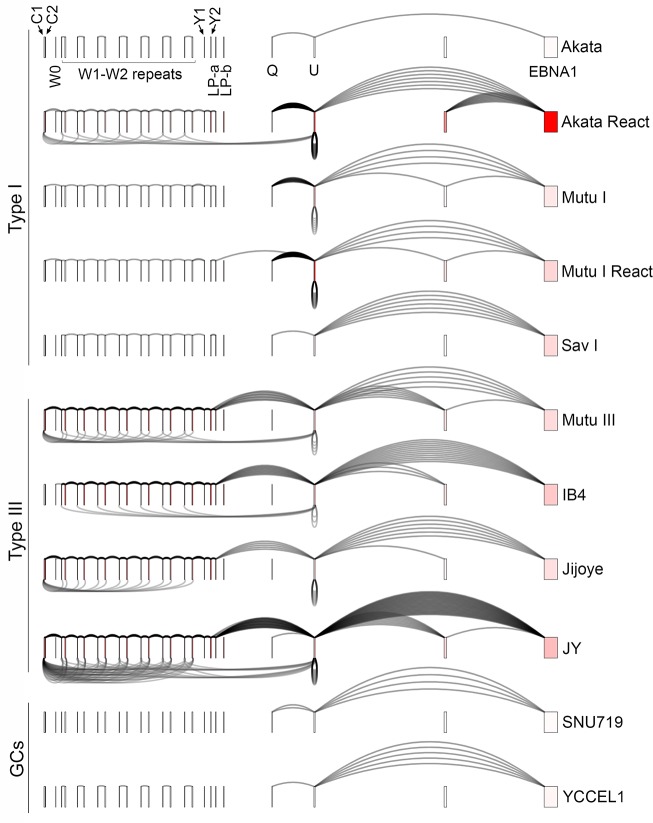
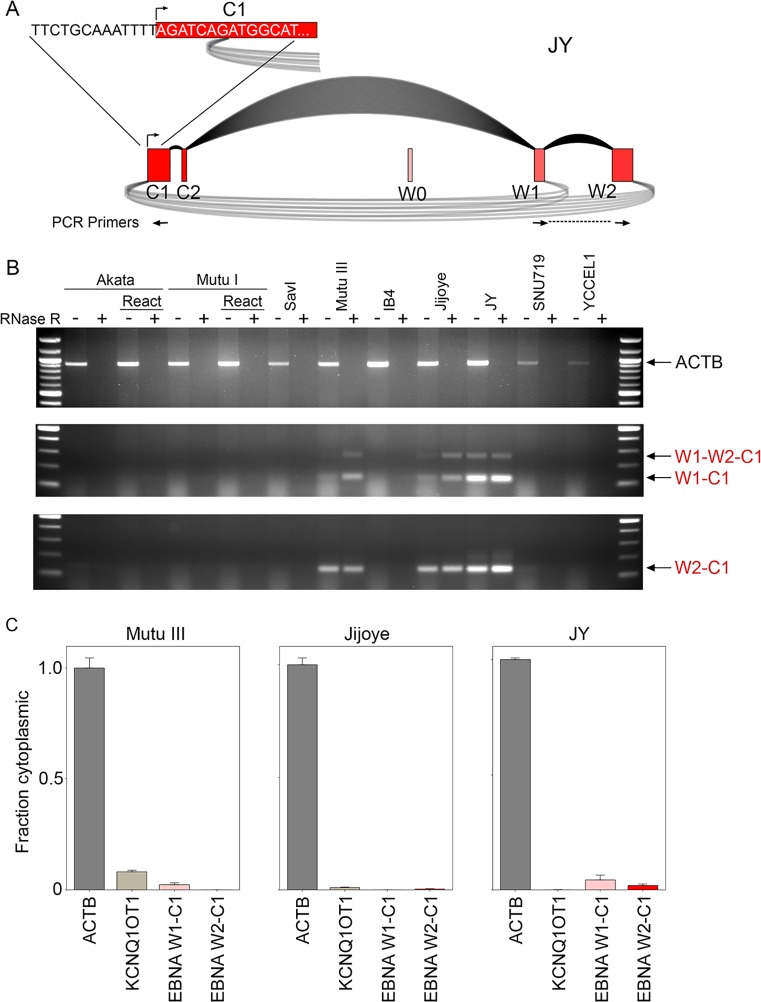
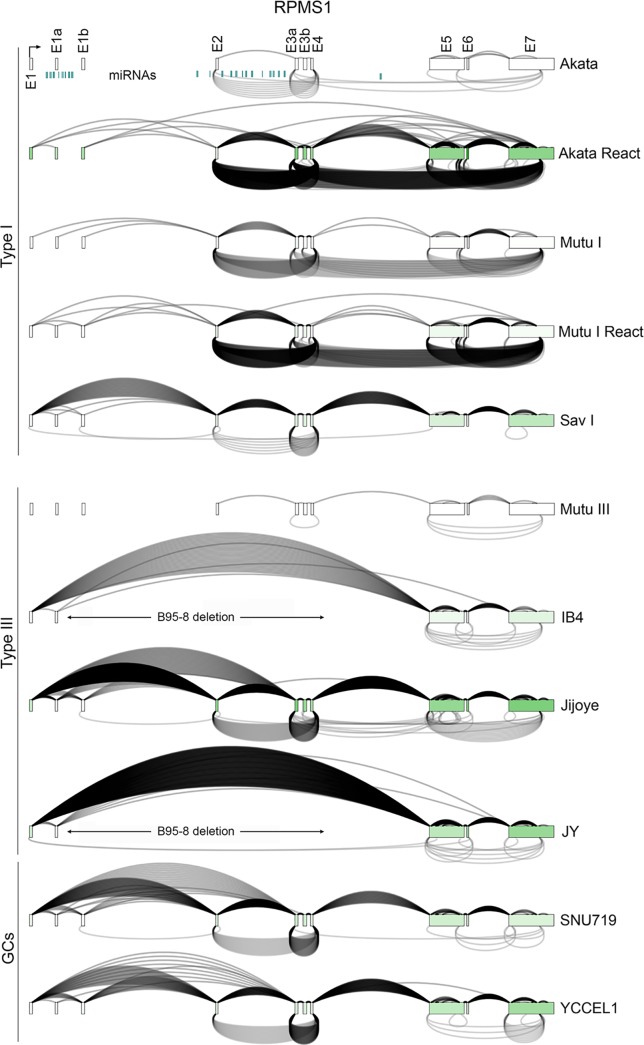
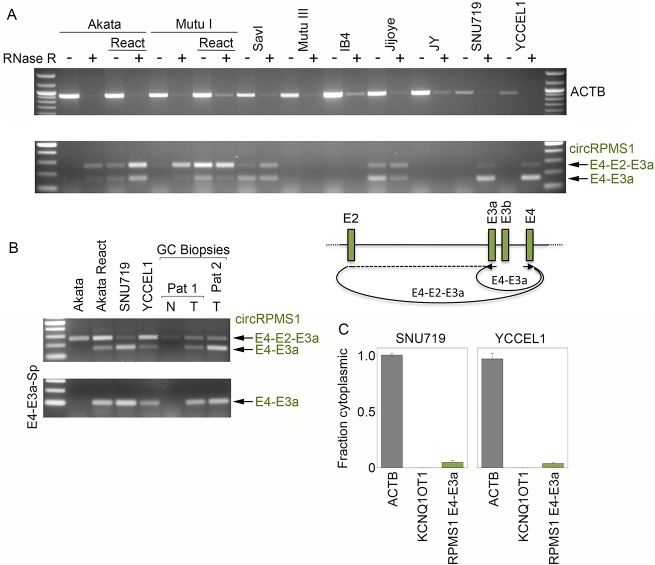
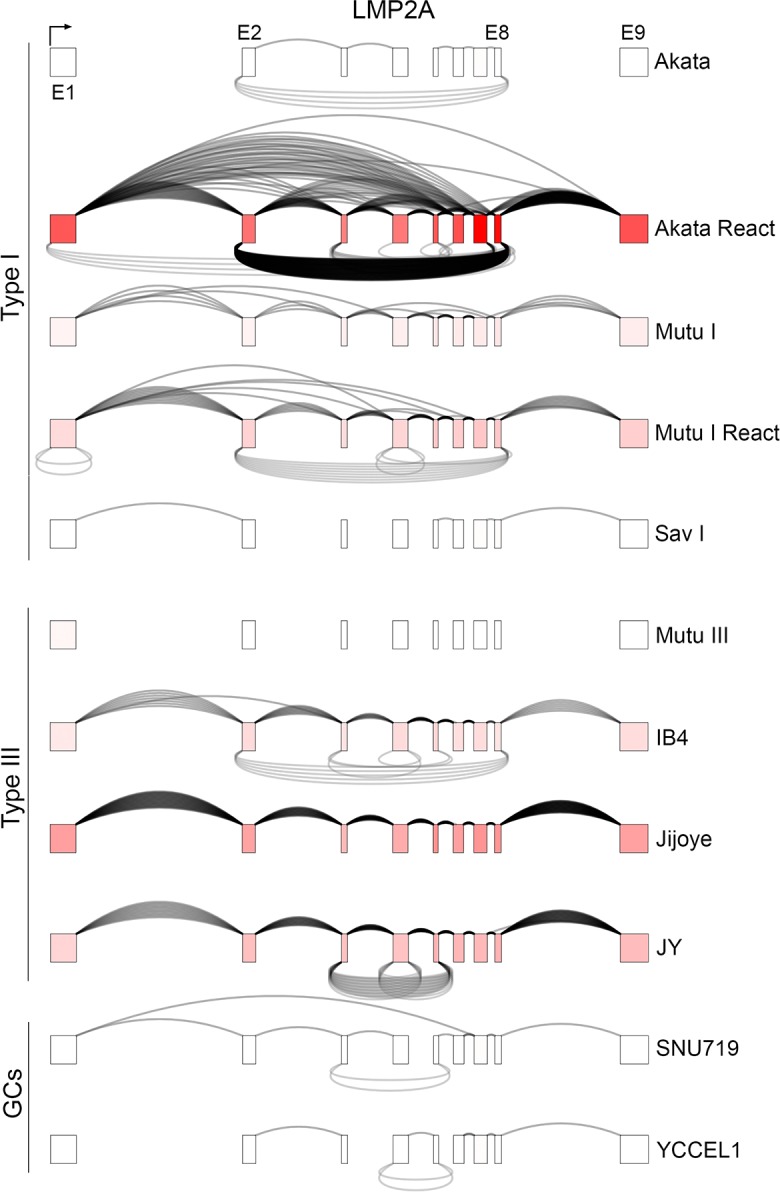
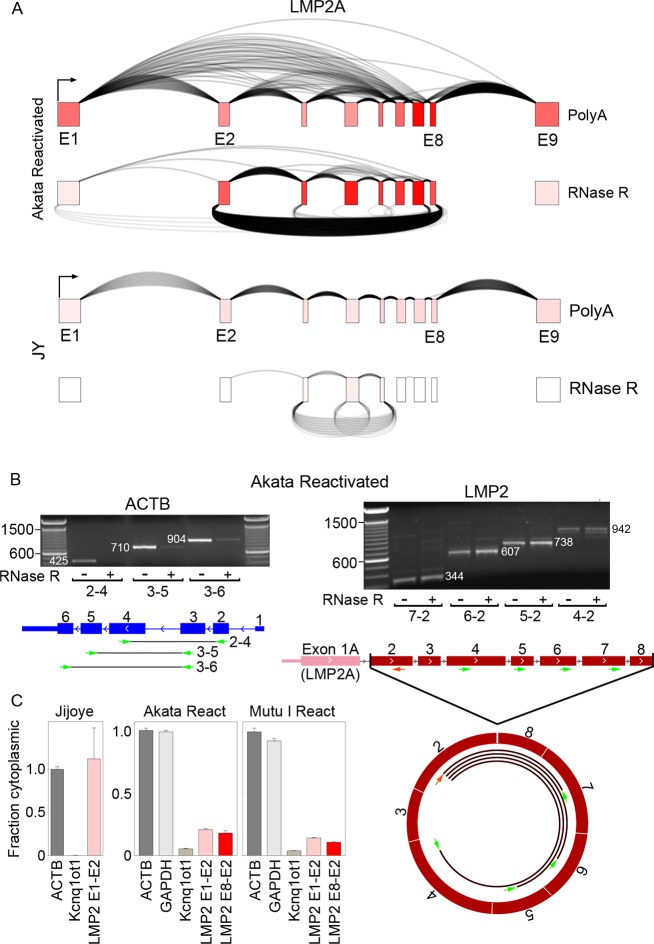
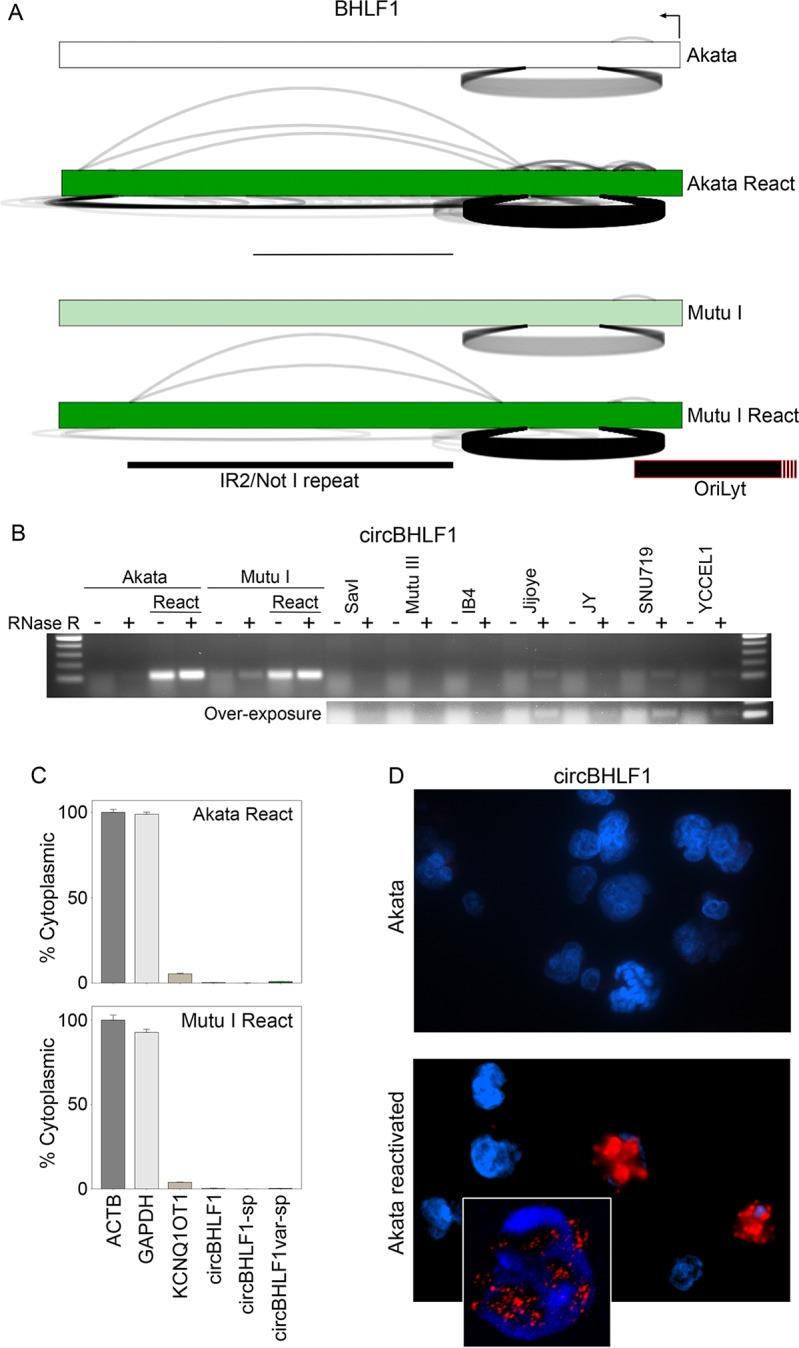
Our appreciation for the extent of Epstein Barr virus (EBV) transcriptome complexity continues to grow through findings of EBV encoded microRNAs, new long non-coding RNAs as well as the more recent discovery of over a hundred new polyadenylated lytic transcripts. Here we report an additional layer to the EBV transcriptome through the identification of a repertoire of latent and lytic viral circular RNAs. Utilizing RNase R-sequencing with cell models representing latency types I, II, and III, we identified EBV encoded circular RNAs expressed from the latency Cp promoter involving backsplicing from the W1 and W2 exons to the C1 exon, from the EBNA BamHI U fragment exon, and from the latency long non-coding RPMS1 locus. In addition, we identified circular RNAs expressed during reactivation including backsplicing from exon 8 to exon 2 of the LMP2 gene and a highly expressed circular RNA derived from intra-exonic backsplicing within the BHLF1 gene. While expression of most of these circular RNAs was found to depend on the EBV transcriptional program utilized and the transcription levels of the associated loci, expression of LMP2 exon 8 to exon 2 circular RNA was found to be cell model specific. Altogether we identified over 30 unique EBV circRNAs candidates and we validated and determined the structural features, expression profiles and nuclear/cytoplasmic distributions of several predominant and notable viral circRNAs. Further, we show that two of the EBV circular RNAs derived from the RPMS1 locus are detected in EBV positive clinical stomach cancer specimens. This study increases the known EBV latency and lytic transcriptome repertoires to include viral circular RNAs and it provides an essential foundation and resource for investigations into the functions and roles of this new class of EBV transcripts in EBV biology and diseases.


Conflict of interest statement

The authors, TL and MS, are currently under the employment of ReproCELL Incorporated. ReproCELL Incorporated provided funds, resources and equipment to conduct some of the studies and provided salary and benefits for TL and MS. This does not alter our adherence to all PLoS Pathogens policies on sharing data and materials.

Figures

Fig 1
Fig 1. RNase R-sequencing across EBV latency types and reactivation.
A) Cell models subjected to RNase R-seq and schematic of sequencing strategy. Nucl and cyto refer to nuclear and cytoplasmic fractions, respectively. B) Backsplice to total (backsplice plus forward splice) viral plus cellular read counts in ribodepletion-seq and RNase R-seq approaches. Note: similar backsplice to total SJ ratios were also observed in RNase R-seq analysis of all other cell lines/conditions shown in panel A. C) Scatter plots showing ratio of backsplice read counts (normalized to total spliced read counts) in RNase R vs ribodepletion sequencing for each junction detected in respective ribodepletion-seq datasets.
Fig 2
Fig 2
A) In silico validated EBV backsplice junctions. Bar graph displays junction spanning read counts (minimum 12 base overhang and 90% homology) derived from realignment to conjoined backsplice junctions. Note that some of the less abundant backsplices (e.g. several of the RPMS1 and the circBHRF1 backsplice junctions) met the 5 read minimum threshold in RNase R-seq of nuclear and/or cytoplasmic fractions but show less than 5 reads in any whole cell sequencing data displayed here. B) Scatter plot displaying viral backsplice read counts (red dots) in the context of cellular backsplice read counts (black dots) from find_circ analysis of RNase R-seq datasets.
Fig 3
Fig 3. Graphical presentation of splicing and exon specific coverage of the EBNA latency locus.
For context, backsplicing read counts (under arches) derived from RNase R-seq datasets are plotted with forward splicing (over arches) and coverage data (exon color intensity) derived from polyA-seq datasets. The number of arches (forward- and back-splicing) correspond to the number of junction spanning reads. Exon shading intensity reflects relative coverage levels across both exons and samples. Due to informatics issues associated with aligning to repeat sequences, we utilized a custom data processing method for analyzing the EBNA latency locus to more accurately assess coverage and splicing across the BamHI W repeat region.
Fig 4
Fig 4. RT-PCR analysis of circEBNA_W1_C1 and circEBNA_W2_C1 circular RNAs.
A) Detailed view of W1-to-C1 and W2-to-C1 backsplices and location of the novel C1 splice acceptor 8 bp downstream from the annotated Cp transcription initiation site. Positions of divergent W1 and C1 and W2 and C1 PCR primers are shown below respective exons. B) RNase R-resistance of circEBNA_W1_C1 and circEBNA_W2_C1 circular RNAs. Divergent C1 and W1 primers detect both W1-to-C1 backsplice junction and W1-to-W2-to-C1 splicing (middle panel–verified by sequencing). Divergent C1 and W2 primers detect the W2 to C1 backsplice junction (lower panel–verified by sequencing). These experiments were repeated with similar results. C) RT-qPCR of nuclear and cytoplasmic fractions using W1-to-C1 and W2-to-C1 divergent primers shows primarily nuclear localization for both circEBNA_W1_C1 and circEBNA_W2_C1 circular RNAs. Cytoplasmically localized ACTB and nuclear localized KCNQ1OT1 are shown for comparison. Fraction cytoplasmic is relative to ACTB (cytoplasmic) and the most nuclear localized junction in the respective cell lines. Error bars represent standard deviations and were derived from triplicate qPCR reactions. These experiments were repeated once with similar results. Method for calculating fraction cytoplasmic is outlined in the methods section.
Fig 5
Fig 5. Graphical presentation of splicing and exon specific coverage of the RPMS1 latency locus.
Backsplicing read counts (under arches) are derived from RNase R-seq datasets and forward splicing (over arches) and coverage data (exon color intensity) are derived from polyA-seq datasets. The number of arches (forward- and back-splicing) correspond to the number of junction spanning reads. Exon shading intensity reflects relative coverage levels across both exons and samples. The location of the B95-8 deletion in IB4 and JY cells is indicated.
Fig 6
Fig 6. RT-PCR analysis of circRPMS1_E4_E3a and circRPMS1_E4_E2 circular RNAs.
A) RNase R resistance of circRPMS1_E4_E3a and circRPMS1_E4_E2. Divergent primers within RPMS1 exons 4 and 3a detect both exon 4 to exon 3a and exon 4 to exon 2 (exon 4 to exon 2 to exon 3a) circular RNAs (validated by sequencing of excised fragments). All PCR reactions were repeated with similar results. B) circRPMS1_E4_E3a and circRPMS1_E4_E2 are detected in stomach cancer biopsies from two patients (Pat 1 and Pat 2). “N” refers to normal adjacent tissue and “T” refers to tumor tissue. All PCR reactions were repeated with similar results. C) RT-qPCR analysis using junction specific primers shows nuclear enrichment for circRPMS1_E4_E3a. Error bars represent standard deviations and were derived from triplicate qPCR reactions. These experiments were repeated once with similar results. Method for calculating fraction cytoplasmic is outlined in the methods section.
Fig 7
Fig 7. Graphical presentation of splicing and exon specific coverage of the LMP2 locus.
Backsplicing read counts (under arches) are derived from RNase R-seq datasets and forward splicing (over arches) and coverage data (exon color intensity) are derived from polyA-seq datasets. The number of arches (forward- and back-splicing) correspond to the number of junction spanning reads. Exon shading intensity reflects relative coverage levels across both exons and samples.
Fig 8
Fig 8. Exonic structure of circLMP2_E8_E2.
A) Coverage and forward splicing enrichment of LMP2 exons 2 through 8 in RNase R-seq in reactivated Akata cells suggests exons 2 through 8 inclusion in circLMP2_E8_E2. Forward splicing (over arches), coverage (exon color intensity), and backsplicing (under arches) derived from polyA-seq and RNase R-seq in reactivated Akata cells and JY cells. B) RT-PCR using forward primers in exons 4 through 7 support a sequentially forward-spliced configuration of circLMP2_E8_E2. All PCR reactions were repeated with similar results. C) Nuclear/cytoplasmic distribution of circLMP2_E8_E2 using RT-qPCR. Cytoplasmically localized ACTB and nuclear localized KCNQ1OT1 are shown for comparison. Fraction cytoplasmic is relative to ACTB (cytoplasmic) and KCNQ1OT1 (nuclear). Error bars represent standard deviations and were derived from triplicate qPCR reactions. These experiments were repeated once with similar results. Method for calculating fraction cytoplasmic is outlined in the methods section.
Fig 9
Fig 9. circBHLF1 detection in reactivated Akata and Mutu I cells.
A) Backsplicing read counts (under arches) are derived from RNase R-seq datasets and forward splicing (over arches) and coverage data (exon color intensity) are derived from polyA-seq datasets. The number of arches (forward- and back-splicing) correspond to the number of junction spanning reads. Exon shading intensity reflects relative coverage levels across samples. B) RNase R-resistance of circBHLF1. All PCR reactions were repeated with similar results. C) Nuclear/cytoplasmic distribution of circBHLF1 using RT-qPCR. Cytoplasmically localized ACTB and nuclear localized KCNQ1OT1 are shown for comparison. Fraction cytoplasmic is relative to ACTB (cytoplasmic) and the most nuclear localized junction in the respective cell lines. Error bars represent standard deviations and were derived from triplicate qPCR reactions. These experiments were repeated once with similar results. Method for calculating fraction cytoplasmic is outlined in the methods section. D) BaseScope analysis of circBHLF1 cellular distribution. Inset shows confocal image of nuclear localization of circBHLF1.

Similar articles

Cited by

References

    1. Kang MS, Kieff E. Epstein-Barr virus latent genes. Exp Mol Med. 2015;47:e131 10.1038/emm.2014.84 ; PubMed Central PMCID: PMCPMC4314583. - DOI - PMC - PubMed
    1. Longnecker R, Kieff E, Cohen J. Epstein-Barr virus. 6th ed. DM K, PM H, editors. Philadelphia, PA2013.
    1. Moss WN, Steitz JA. Genome-wide analyses of Epstein-Barr virus reveal conserved RNA structures and a novel stable intronic sequence RNA. BMC Genomics. 2013;14:543 10.1186/1471-2164-14-543 ; PubMed Central PMCID: PMC3751371. - DOI - PMC - PubMed
    1. Hutzinger R, Feederle R, Mrazek J, Schiefermeier N, Balwierz PJ, Zavolan M, et al. Expression and processing of a small nucleolar RNA from the Epstein-Barr virus genome. PLoS Pathog. 2009;5(8):e1000547 Epub 2009/08/15. 10.1371/journal.ppat.1000547 . - DOI - PMC - PubMed
    1. Yajima M, Kanda T, Takada K. Critical role of Epstein-Barr Virus (EBV)-encoded RNA in efficient EBV-induced B-lymphocyte growth transformation. J Virol. 2005;79(7):4298–307. 10.1128/JVI.79.7.4298-4307.2005 ; PubMed Central PMCID: PMCPMC1061531. - DOI - PMC - PubMed

Publication types