. 2018 Aug 6;14(8):e1007555.
doi: 10.1371/journal.pgen.1007555. eCollection 2018 Aug.

Multilevel effects of light on ribosome dynamics in chloroplasts program genome-wide and psbA-specific changes in translation

Affiliations

Multilevel effects of light on ribosome dynamics in chloroplasts program genome-wide and psbA-specific changes in translation

Prakitchai Chotewutmontri et al. PLoS Genet. .

Erratum in

Abstract

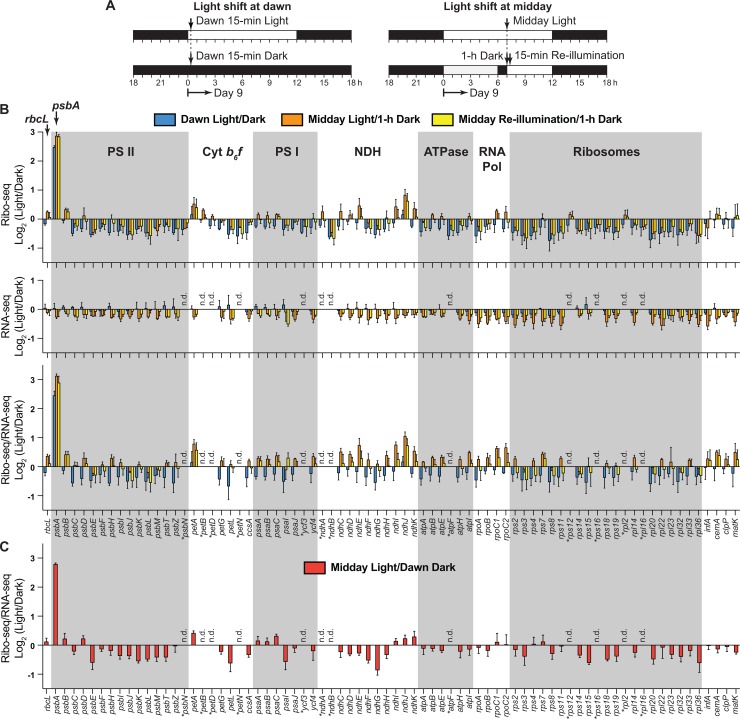
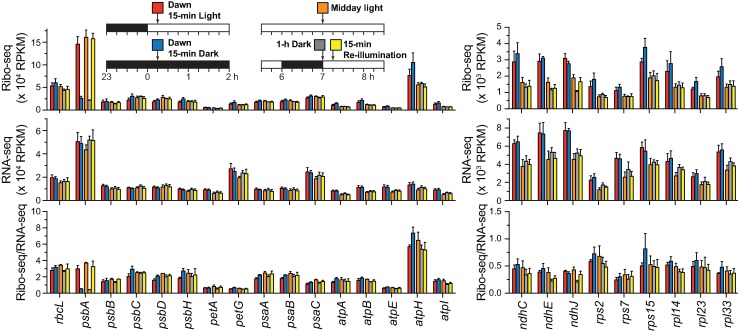
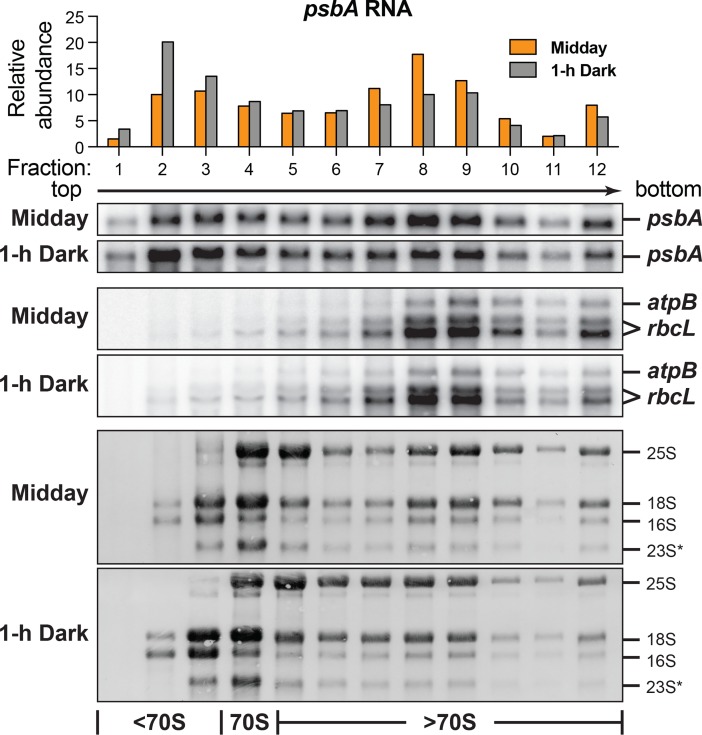
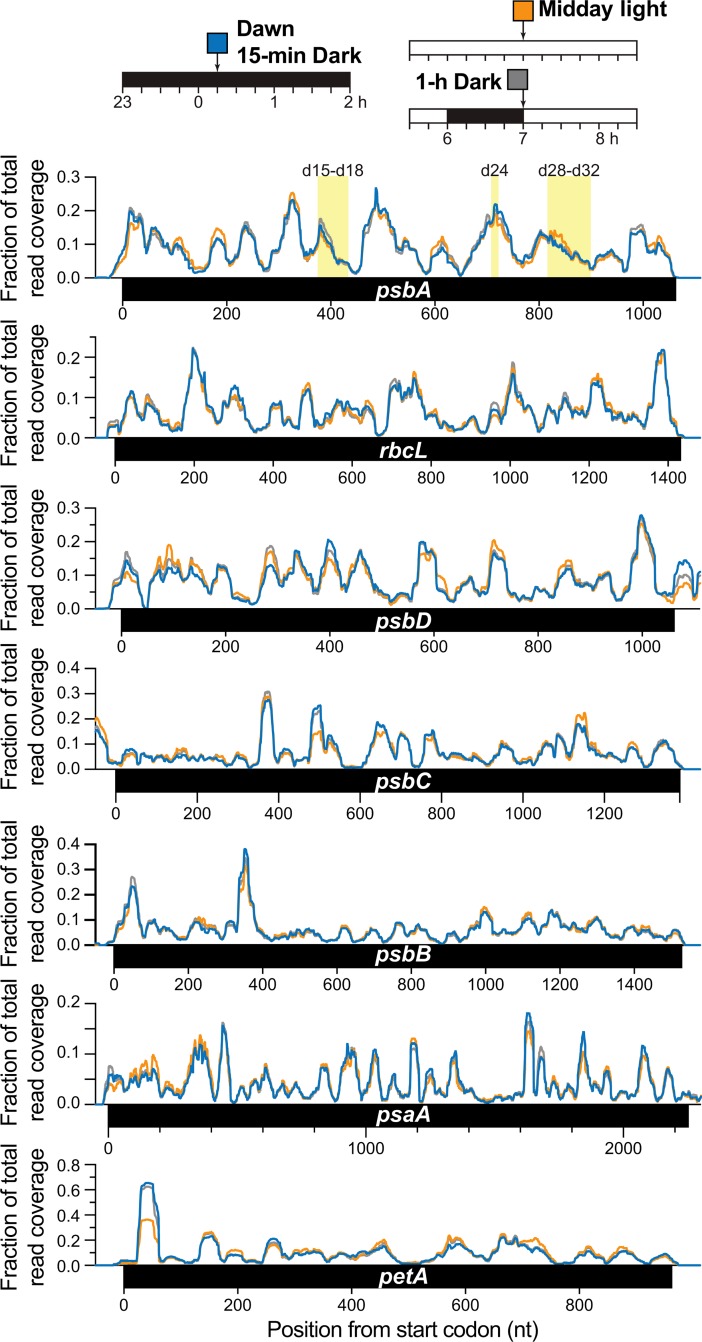
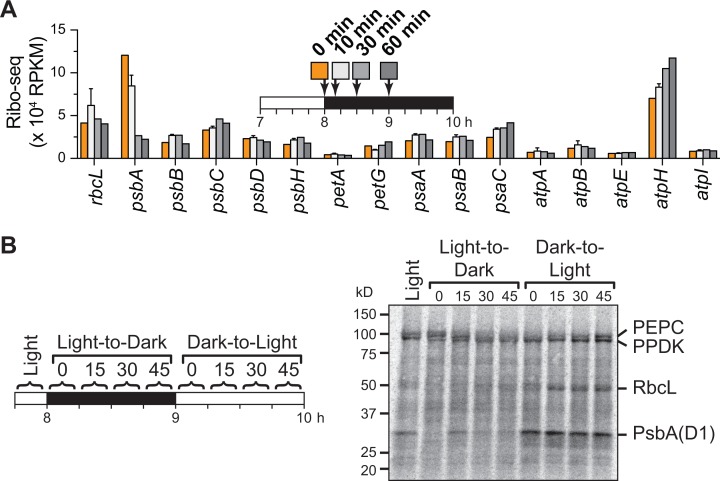
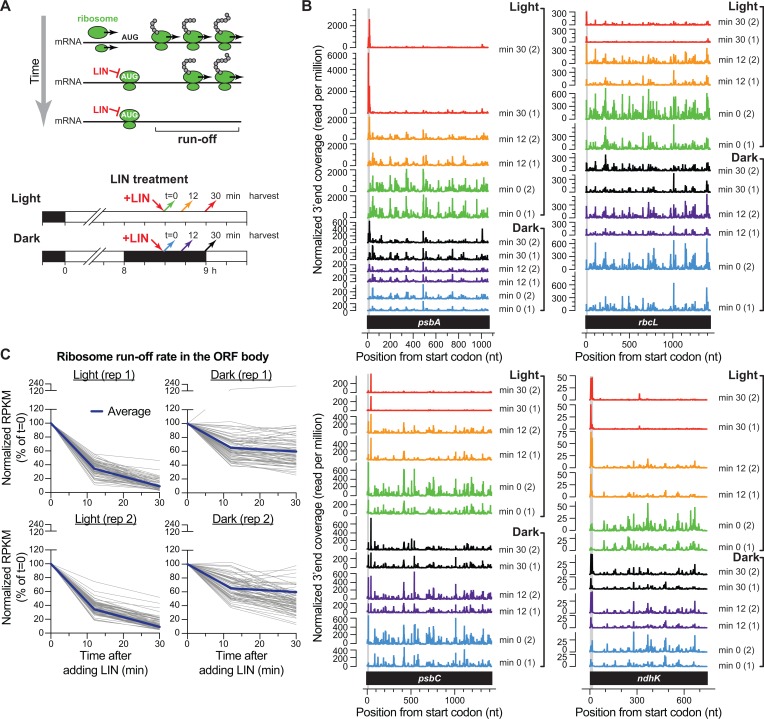
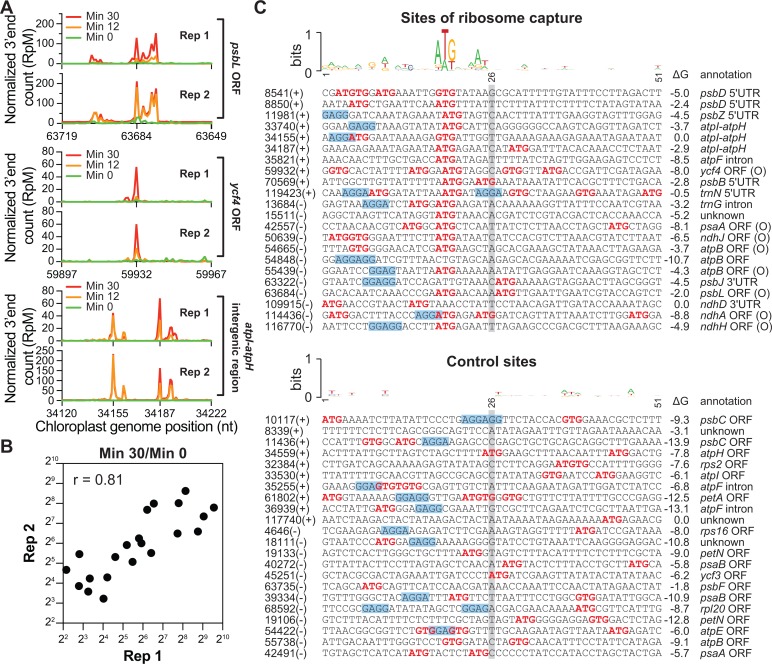
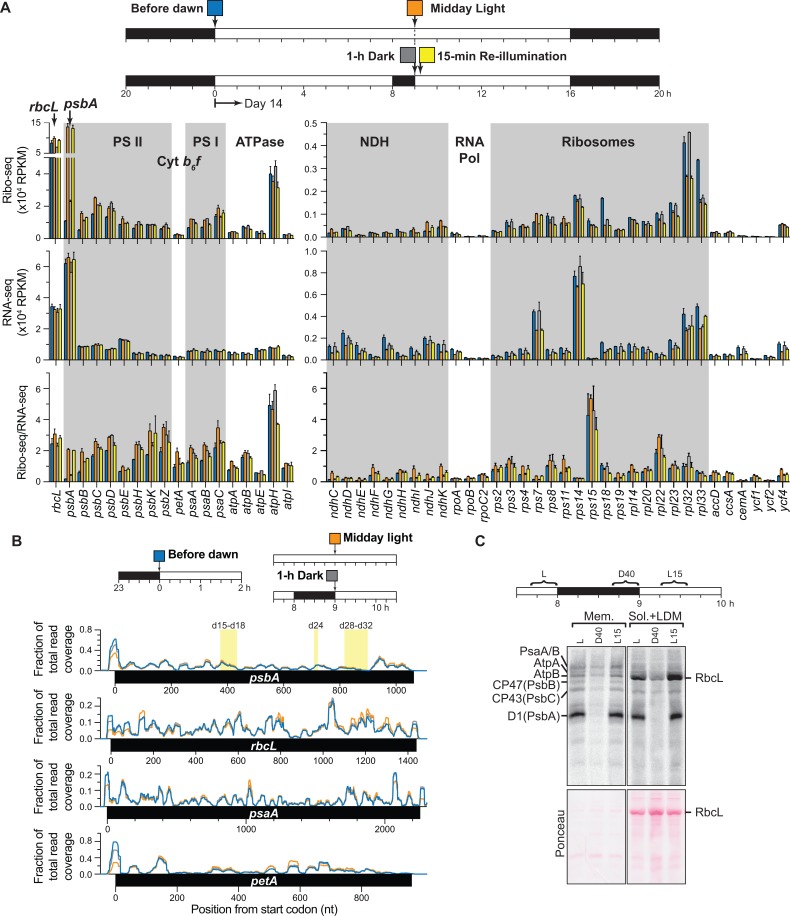
Plants and algae adapt to fluctuating light conditions to optimize photosynthesis, minimize photodamage, and prioritize energy investments. Changes in the translation of chloroplast mRNAs are known to contribute to these adaptations, but the scope and magnitude of these responses are unclear. To clarify the phenomenology, we used ribosome profiling to analyze chloroplast translation in maize seedlings following dark-to-light and light-to-dark shifts. The results resolved several layers of regulation. (i) The psbA mRNA exhibits a dramatic gain of ribosomes within minutes after shifting plants to the light and reverts to low ribosome occupancy within one hour in the dark, correlating with the need to replace damaged PsbA in Photosystem II. (ii) Ribosome occupancy on all other chloroplast mRNAs remains similar to that at midday even after 12 hours in the dark. (iii) Analysis of ribosome dynamics in the presence of lincomycin revealed a global decrease in the translation elongation rate shortly after shifting plants to the dark. The pausing of chloroplast ribosomes at specific sites changed very little during these light-shift regimes. A similar but less comprehensive analysis in Arabidopsis gave similar results excepting a trend toward reduced ribosome occupancy at the end of the night. Our results show that all chloroplast mRNAs except psbA maintain similar ribosome occupancy following short-term light shifts, but are nonetheless translated at higher rates in the light due to a plastome-wide increase in elongation rate. A light-induced recruitment of ribosomes to psbA mRNA is superimposed on this global response, producing a rapid and massive increase in PsbA synthesis. These findings highlight the unique translational response of psbA in mature chloroplasts, clarify which steps in psbA translation are light-regulated in the context of Photosystem II repair, and provide a foundation on which to explore mechanisms underlying the psbA-specific and global effects of light on chloroplast translation.


Conflict of interest statement

The authors have declared that no competing interests exist.

Figures

Fig 1
Fig 1. Genome-wide comparison of ribosome occupancy on maize chloroplast mRNAs following light-to-dark and dark-to-light shifts of green seedlings.
(A) Light shift regimes used for this analysis. Seedlings were grown for 8 days in 12-h light/12-h dark cycles and subjected to the indicate light shifts on day 9. (B) Ratio of signal in the light to dark following short-term light shifts at dawn and midday. Values reflect the relative abundance of ribosome footprints (Ribo-seq) or RNA (RNA-seq) mapping to each ORF in light versus dark. Ribo-seq/RNA-seq values reflect the number of ribosomes per mRNA (ribosome density) in light versus dark. The values are the mean ± SEM from three replicate datasets. Genes are grouped according to their function rather than their genomic position. Genes for which mRNA levels could not be measured with confidence are marked with asterisks. These include very short ORFs and intron-containing genes, as explained in [17]. (C) Comparison of ribosome density on chloroplast ORFs after 12 hours in the dark (dawn) and 7 hours in the light (midday).
Fig 2
Fig 2. Ribosome footprint and RNA abundance for chloroplast genes following light shifts at dawn and midday.
The values underlying the ratios presented in Fig 1 are displayed separately to allow comparison across all conditions. Analogous plots for the remaining chloroplast genes are shown in S2 Fig. As reported previously [17], the translational efficiency of psbA mRNA is not particularly high in the light (bottom panel, Ribo-seq/RNA-seq). Instead, the high translational output of psbA is due to the extremely high abundance of its mRNA (middle panel, RNA-seq).
Fig 3
Fig 3. Polysome analyses support conclusions from Ribo-seq.
Leaf lysates prepared from plants grown as for the ribosome profiling assays in Fig 1 were fractionated by sedimentation through sucrose gradients. RNA extracted from each fraction was analyzed by RNA gel blot hybridization. The blots shown here come from material harvested at midday, either in the light or after 1 hour in the dark. A single blot for each tissue sample was probed sequentially to detect rbcL, atpB/E, and psbA RNAs. The methylene blue-stained blots below illustrate the distribution of cytosolic (25S and 18S) and chloroplast (16S and 23S*) rRNAs in the same gradients. The quantification shown at top is based on quantitative phosphorimaging. S3 Fig shows the corresponding data for ndhJ and for material that was reilluminated for 15 minutes or harvested in the dark just prior to dawn.
Fig 4
Fig 4. Distribution of ribosome footprints along chloroplast ORFs in light and dark.
The distribution of Ribo-seq reads is plotted as a fraction of the total reads mapping to each indicated ORF for each of the three conditions diagrammed at top. Values are the sum from replicates 2 and 3. Replicate 1 was not included in this analysis because it involved a slightly different protocol for footprint and library preparation. Regions in psbA corresponding to major ribosome pause sites detected by toe-printing in barley are shaded in yellow and labeled as in the original reports [19, 20]. Ribosome footprints downstream of psbD and upstream of psbC result from the fact that these two ORFs overlap. A plastome-wide quantitative comparison of ribosome occupancy in light versus dark is presented in S4 Fig.
Fig 5
Fig 5. Time course of changes in psbA ribosome occupancy and protein synthesis following light shifts in maize seedlings.
(A) Kinetics of ribosome loss on psbA following a shift to dark. Plants were processed for ribosome profiling at the indicated time points following a shift to the dark at midday. The 10-minute time point was performed in two replicates; the mean ± SEM is shown. Other time points were performed once. However, the 0 and 60 minute time points are equivalent to the triplicated data shown in preceding figures, which gave similar values. (B) In vivo pulse labeling following light-to-dark shifts. Labeling with 35S-methionine/cysteine was initiated at the indicated times and continued for 15 min. Total leaf lysates were analyzed by SDS-PAGE and phosphorimaging. The two rapidly synthesized proteins at ~100 kDa are likely to be the nuclear gene products PEP Carboxylase and PPDK.
Fig 6
Fig 6. Time course of ribosome clearance following lincomycin treatment in light versus dark.
(A) Experimental design. Lincomycin (LIN) inhibits peptide bond formation only when the nascent peptide is shorter than approximately five amino acids. Therefore, ribosomes with longer nascent peptides continue to elongate in its presence. LIN was applied to seedlings at midday in the light or after 30 minutes of dark adaptation; this period of dark adaptation is sufficient for ribosome occupancy on psbA mRNA to decrease to its dark steady-state level (see Fig 5). Material was harvested just prior to LIN treatment, and 12 or 30 minutes later. (B) Distribution of ribosomes along four chloroplast ORFs following LIN treatment in the dark or light. The plots show the normalized abundance of ribosome footprints with 3’ ends at each position. Plots for each of two replicates are shown separately to illustrate reproducibility. The region occupied by initiating ribosomes (first 7 codons) is shaded in gray. (C) Fractional change in ribosome footprint abundance on each chloroplast ORF following LIN treatment in the light and dark. The apical half of leaves 2 and 3 were processed for ribosome profiling. Each line shows the percent of the initial RPKM for a single chloroplast ORF over time following LIN treatment. The data from two replicate datasets are shown in separate plots to illustrate trends and variation. Footprints mapping to the first seven codons of each ORF were excluded from read counts because LIN inhibits these ribosomes. Ribosomes that build up at specific ORF-internal sites following LIN treatment (see Fig 7) were also excluded based on the criteria and rationale explained in Materials and Methods. Only genes whose average RPKM was greater than 100 at t = 0 are included (n = 70).
Fig 7
Fig 7. Ribosome capture at sites resembling translation initiation regions following lincomycin treatment.
(A) Examples of ribosome build-up at non-start codons following LIN treatment. The abundance of ribosome footprints with 3’ ends mapping to the indicated position (per million reads mapped; RpM) is plotted at each time point following LIN treatment. Ribosome footprint abundance prior to LIN treatment is shown in green. Results from replicate experiments are shown in separate graphs. (B) Correlation plot showing the ratio of ribosome footprints 30 minutes after LIN treatment to that just prior to LIN treatment at non-start codons in two replicate experiments. These data come from the sites shown in panel (C), with the exception of the site at 8850, which was excluded because it had zero reads at t = 0 and was therefore unsuitable for the ratio calculation. (C) Features of sequences at which ribosomes accumulate to high-levels following LIN treatment. The sites of ribosome capture shown at top were selected based on the following criteria: they are not annotated start codons, they had an average of at least 50 RpM in the light, and the normalized abundance of the footprint increased at least 5-fold after 30 min in LIN. Sequences are centered at the 3’end of the footprint (gray shading). ATG and GTG sequences are in red. Sequences with four or more contiguous matches to the consensus Shine-Dalgarno sequence (AGGAGG) are shaded blue. Each sequence is annotated with its genomic coordinate and strand (left), and with the predicted stability of RNA structure (RNAfold, http://rna.tbi.univie.ac.at/cgi-bin/RNAWebSuite/RNAfold.cgi). Footprints are annotated “O” if they are out of frame with the ORF in which they reside. Each sequence at top is matched in an ordered pair to a control sequence below. The controls were selected as the sequence in closest proximity on the same strand but at least 500-nucleotide from each site that had a similar number of Ribo-seq reads at the start of lincomycin treatment in the light.
Fig 8
Fig 8. Chloroplast ribosome occupancy and protein synthesis in Arabidopsis following light-to-dark and dark-to-light shifts.
(A) Seedlings were grown for 13-days in 12-h light/12-h dark cycles and subjected to the indicated light shifts on day 14. The normalized abundance of ribosome footprints (Ribo-seq), RNA (RNA-seq), or ribosome density (Ribo-seq/RNA-seq) is shown for each gene under each of the four indicated conditions. The values are the mean ± SEM from two biological replicates. Genes for which mRNA levels could not be measured with confidence are excluded. These include short ORFs (<150 nucleotides) and intron-containing genes. (B) Normalized read coverage for each of the three conditions diagrammed at top is plotted according to nucleotide position in each indicated ORF. Values are the sum from two replicates. Regions in psbA corresponding to major ribosome pause sites detected by toe-printing in barley are shaded in yellow and labeled as in the original report [19, 20]. (C) Chloroplast protein synthesis in Arabidopsis in response to light shifts at midday. 35S-methionine/cysteine was applied to excised seedling leaves in the presence of cycloheximide. Labeling was initiated at the indicated times and continued for 20 min. After separating dense membranes (Mem) from soluble and low-density membranes (Sol+LDM), proteins were resolved by SDS-PAGE, transferred to nitrocellulose, and detected by phosphorimaging. Bands corresponding to D1 (PsbA), CP47 (PsbB), CP43 (PsbC), PsaA/B, AtpA, AtpB, and RbcL are marked. The Ponceau S-stained nitrocellulose blots used for phosphorimaging are shown below. The recovery of radiolabeled D1 in the Sol+LDM fraction was likely due to inefficient pelleting of stromal lamellae, the site of PSII repair.

Similar articles

Cited by

References

    1. Dietz KJ. Efficient high light acclimation involves rapid processes at multiple mechanistic levels. J Exp Bot. 2015; 66: 2401–14. 10.1093/jxb/eru505 - DOI - PubMed
    1. Schottler MA, Toth SZ. Photosynthetic complex stoichiometry dynamics in higher plants: environmental acclimation and photosynthetic flux control. Front Plant Sci. 2014; 5: 188 10.3389/fpls.2014.00188 - DOI - PMC - PubMed
    1. Jarvi S, Suorsa M, Aro EM. Photosystem II repair in plant chloroplasts—Regulation, assisting proteins and shared components with photosystem II biogenesis. Biochim Biophys Acta. 2015; 1847: 900–9. 10.1016/j.bbabio.2015.01.006 - DOI - PubMed
    1. Theis J, Schroda M. Revisiting the photosystem II repair cycle. Plant Signal Behav. 2016; 11: e1218587 10.1080/15592324.2016.1218587 - DOI - PMC - PubMed
    1. Sun Y, Zerges W. Translational regulation in chloroplasts for development and homeostasis. Biochim Biophys Acta. 2015; 1847: 809–20. 10.1016/j.bbabio.2015.05.008 - DOI - PubMed

Publication types

MeSH terms

Grants and funding

This work was supported by the National Science Foundation (USA), Grants IOS-1339130 and MCB-1616016. The funders had no role in study design, data collection and analysis, decision to publish, or preparation of the manuscript.

LinkOut - more resources