. 2018 Aug 13;34(2):211-224.e6.
doi: 10.1016/j.ccell.2018.07.001. Epub 2018 Aug 2.

Comprehensive Analysis of Alternative Splicing Across Tumors from 8,705 Patients

Collaborators, Affiliations

Comprehensive Analysis of Alternative Splicing Across Tumors from 8,705 Patients

André Kahles et al. Cancer Cell. .

Abstract

Our comprehensive analysis of alternative splicing across 32 The Cancer Genome Atlas cancer types from 8,705 patients detects alternative splicing events and tumor variants by reanalyzing RNA and whole-exome sequencing data. Tumors have up to 30% more alternative splicing events than normal samples. Association analysis of somatic variants with alternative splicing events confirmed known trans associations with variants in SF3B1 and U2AF1 and identified additional trans-acting variants (e.g., TADA1, PPP2R1A). Many tumors have thousands of alternative splicing events not detectable in normal samples; on average, we identified ≈930 exon-exon junctions ("neojunctions") in tumors not typically found in GTEx normals. From Clinical Proteomic Tumor Analysis Consortium data available for breast and ovarian tumor samples, we confirmed ≈1.7 neojunction- and ≈0.6 single nucleotide variant-derived peptides per tumor sample that are also predicted major histocompatibility complex-I binders ("putative neoantigens").

Keywords: CPTAC; GTEx; MS proteomics; RNA-seq; TCGA; TCGA Pan-Cancer Atlas; alternative splicing; cancer; exome; immunoediting; immunotherapy; neoantigens; splicing QTL; tumor-specific splicing.


Figures

Figure 1.
Figure 1.. Project Overview
Flow diagram of data and analyses presented in this work. The left schema represents approximate body source sites for the samples of the 32 analyzed cancer types. Bar charts describe numbers of tumor and matched normal samples for each cancer. The numbers for tumor samples represent cases where both tumor RNA-seq as well as whole-exome sequencing (WXS) data are available. The numbers for normal represent matched normal RNA-seq. All samples underwent uniform preprocessing (middle, top), including sequence alignment, expression quantification, and alternative splicing analysis (middle, RNA). Furthermore, samples were used for tumor variant calling and somatic variant calling by the Multi-Center Variant Call (MC3) project (center). In addition, data from other sources, such as the GTEx project, the Broad Firebrowse, and Clinical Proteomic Tumor Analysis Consortium (CPTAC) were included (middle bottom). Different data types were then combined into four integrative analysis sections. For the identification of splicing quantitative trait loci (sQTL, right, top), we associated RNA-seq-derived splicing quantifications with WXS-derived genetic variants, to identify cis and trans effects. To highlight quantitative splicing differences between tumor and normal samples, we used the splicing quantifications to test for significant differences between tumor and normal (illustrated with ***) and ranked the results across all cancers (right, second). To discover neojunctions only present in cancer samples but unobserved in normals or a tissue-matched outgroup, we integrated TCGA RNA-seq data and GTEx RNA-seq data to determine the degree of splicing aberration per sample, marking stark splicing outliers (right, third). Lastly, we analyzed the neojunctions and tested the extent they are translated into proteins, utilizing CPTAC data, confirming a large number of peptides. Many confirmed peptides were also predicted to be MHC-I binders and are excellent neoantigen candidates, promising for immunotherapy (right, bottom). See also Figures S1–S5.
Figure 2.
Figure 2.. Detection of Tumor Alternative Splicing and Splicing Landscape
(A) Detection of alternative splicing events. For each cancer type, we considered 40 randomly chosen samples and jointly identified alternative splicing events (exon skipping events are shown) containing junctions that each can be confirmed with a minimum (min) of 20 spliced reads in at least one sample for the respective cancer type. The darker bar fractions correspond to known alternative splicing events and the lighter bar fractions to additional events that are not part of the GENCODE (v19) annotation. (B) Comparison of the number of alternative splicing events on 40 matched tumor (T) and normal sample (N) pairs for TCGA cancer types with at least 40 normal samples, for events containing junctions confirmed with at least five reads (top) or 20 reads (bottom) in the respective cancer type. (C) Landscape of alternative splicing for all considered TCGA samples computed on exon skipping PSI scores only. Each point represents a sample, colored according to its TCGA project code. The position of each sample is computed as a t-distributed stochastic neighbor embedding (t-SNE) representation of the higher-dimensional splice event PSI matrix. Tumor samples are shown as circles and normal samples as triangles. The dashed box represents an area detailed in (D). (D) Samples in the splicing landscape highlighted for subtypes of BRCA. Normal samples are shown as triangles and tumor samples as circles colored according to subtype. Samples of all other cancer types are shown in gray.
Figure 3.
Figure 3.. Large-Scale Somatic cis- and trans-sQTL Analysis
(A) Two-dimensional Manhattan plot with location of a variant (x axis) associated (p ≤ 0.05 after Bonferroni correction separately for cis and trans associations) with an alternative splicing event at a separate location (y axis). Points along the diagonal correspond to cis associations (window 1 Mb) and the remaining points correspond to trans associations. The marginal bar plots show the number of splicing events found to be associated with a single variant (top) and the number of associations found for each alternative splicing event (right). The colored points indicate whether an alternative splicing event or sQTL is within an RNA binding gene (green), cancer census gene (blue), or cell cycle gene (orange). The pie charts on top of the bar show the breakdown of splicing event type composition of the sQTL targets. Brown indicates alternative 3′ events, gray alternative 5′ events, and green exon skip events. (B) Heatmaps of selected trans-sQTL: PSI z scores of alternative splicing events (columns) significantly associated in trans with the variant. The color bar on the left shows the mutation status for each sample (rows). For visualization purposes, the heatmaps are downsampled to highlight the differences. (C) Pie charts from (A) detailing the distribution of splicing event targets across three categories (alternative 5′, alternative 3′, and exon skip events). (D) Protein-protein interaction network of TADA1 and some selected partners (e.g., SF3B5). See also Figure S2.
Figure 4.
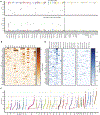
Figure 4.. Differential and Outlier Splicing
(A) Strip plots showing outlier splicing for an exon skipping event in PTEN (top) and an alternative 3′ splice site event in NDRG1 (bottom). Each column represents a cancer type with its matched normal directly adjacent if available (left of dashed line) and GTEx normal samples (right of dashed line). Each dot corresponds to the PSI value of the selected splicing events in one sample. Outlier samples are emphasized through increased marker size with black outline. (B) Result of differential splicing analysis between tumor and matched normals for 14 cancer types. Rows correspond to the 40 most significantly altered genes from the COSMIC cancer census set. Shading corresponds to −log10(p value). Columns represent cancer types. (C) Number of neojunctions per sample for 32 cancer types. Each dot represents the number of tumor-specific introns of a single sample not observed in the annotation and not (or only very rarely) in tissue-matched GTEx samples. If at least five tumor-normal samples were available, the median of neojunctions is indicated by a horizontal dotted red line. Cancer types are sorted from left to right by the mean number of neojunctions. (D) Overview of tumor introns exclusively detected in cancer samples but not in matched normals. The leftmost panel corresponds to TCGA tumor samples, the middle panel to TCGA matched normal samples, and the right panel to tissue-matched GTEx samples. Shading indicates the fraction of samples that have a tumor-specific intron confirmed with RNA-seq in the corresponding sample group. Rows are sorted according to a ranking that is the result of significance testing between tumor and matched normal samples. For multiple introns per gene, the most significant intron was chosen. See also Figures S3 and S4.
Figure 5.
Figure 5.. Alternative Splicing-derived Putative Neoepitopes (ASNs)
(A) Overview of the ASN detection and validation workflow. Starting from the personalized splicing graph including sample-specific germline and somatic SNVs and the GENCODE genome annotations, polypeptides are generated across the junctions of all introns (including neojunctions). Expression of the resulting polypeptides is validated using CPTAC mass spectra. From the expressed polypeptides, 9-mer substrings spanning junctions are enumerated and filtered based on their presence in a non-cancer background set. For the remaining 9-mers, MHC binding predictions (NetMHC) are obtained with respect to the individual’s HLA-I type. Predicted MHC-I binders (percentile rank <2.0) are considered ASNs. The analysis is repeated for somatic SNV-derived 9-mer peptides for comparison. (B) Comparison of the contribution of alternative splicing and SNVs to the CPTAC-confirmed putative neoepitope landscape by cancer type. Average number of CPTAC-confirmed neojunction- and SNV-derived 9-mers per sample (left). Average number of CPTAC-confirmed alternative splicing and SNV sites generating putative neoepitopes per sample (center). Sample fractions with at least one CPTAC-confirmed alternative splicing- or SNV-derived putative neoepitope (right). “UNION” corresponds to the combination of both variant types. “Total” refers to the combination of both cancer types. Only neojunctions RNA-expressed in the respective sample or with a minimum RNA expression of 20 spliced reads in at least one of the samples are considered. (C) Violin plot showing the RNA expression distribution over all expressed neojunction- and SNV-derived 9-mers as well as the overall 9-mer expression distribution. Expression of neojunctions is estimated using the library-size normalized read count confirming the neojunction. For SNV-derived peptides expression is determined by multiplying normalized segment read coverage by the SNV somatic variant allele fraction, and for overall 9-mer expression normalized segment read coverage of all 9-mers is used. The set of SNV-derived 9-mers is used as a representative peptide set for overall 9-mer expression. Filled violins with dotted margins represent the distribution over all 9-mers in the respective set; solid lines represent the distribution over the subset of CPTAC-confirmed 9-mers. See also Figures S4 and S5 and Table S1.

Comment in

Similar articles

Cited by

References

    1. Agrawal S, and Eng C (2006). Differential expression of novel naturally occurring splice variants of PTEN and their functional consequences in Cowden syndrome and sporadic breast cancer. Hum. Mol. Genet. 15, 777–787. - PubMed
    1. Alsafadi S, Houy A, Battistella A, Popova T, Wassef M, Henry E, Tirode F, Constantinou A, Piperno-Neumann S, Roman-Roman S, et al. (2016). Cancer-associated SF3B1 mutations affect alternative splicing by promoting alternative branchpoint usage. Nat. Commun. 7, 10615. - PMC - PubMed
    1. Andreatta M, and Nielsen M (2016). Gapped sequence alignment using artificial neural networks: application to the MHC class I system. Bioinformatics 32, 511–517. - PMC - PubMed
    1. Barrett CL, DeBoever C, Jepsen K, Saenz CC, Carson DA, and Frazer KA (2015). Systematic transcriptome analysis reveals tumor-specific isoforms for ovarian cancer diagnosis and therapy. Proc. Natl. Acad. Sci. USA 112, E3050–E3057. - PMC - PubMed
    1. Bassani-Sternberg M, Bräunlein E, Klar R, Engleitner T, Sinitcyn P, Audehm S, Straub M, Weber J, Slotta-Huspenina J, Specht K, et al. (2016). Direct identification of clinically relevant neoepitopes presented on native human melanoma tissue by mass spectrometry. Nat. Commun. 7, 13404. - PMC - PubMed

Publication types