. 2018 Aug;560(7718):377-381.
doi: 10.1038/s41586-018-0394-6. Epub 2018 Aug 1.

A single-cell atlas of the airway epithelium reveals the CFTR-rich pulmonary ionocyte

Affiliations

A single-cell atlas of the airway epithelium reveals the CFTR-rich pulmonary ionocyte

Lindsey W Plasschaert et al. Nature. 2018 Aug.

Abstract

The functions of epithelial tissues are dictated by the types, abundance and distribution of the differentiated cells they contain. Attempts to restore tissue function after damage require knowledge of how physiological tasks are distributed among cell types, and how cell states vary between homeostasis, injury-repair and disease. In the conducting airway, a heterogeneous basal cell population gives rise to specialized luminal cells that perform mucociliary clearance1. Here we perform single-cell profiling of human bronchial epithelial cells and mouse tracheal epithelial cells to obtain a comprehensive census of cell types in the conducting airway and their behaviour in homeostasis and regeneration. Our analysis reveals cell states that represent known and novel cell populations, delineates their heterogeneity and identifies distinct differentiation trajectories during homeostasis and tissue repair. Finally, we identified a novel, rare cell type that we call the 'pulmonary ionocyte', which co-expresses FOXI1, multiple subunits of the vacuolar-type H+-ATPase (V-ATPase) and CFTR, the gene that is mutated in cystic fibrosis. Using immunofluorescence, modulation of signalling pathways and electrophysiology, we show that Notch signalling is necessary and FOXI1 expression is sufficient to drive the production of the pulmonary ionocyte, and that the pulmonary ionocyte is a major source of CFTR activity in the conducting airway epithelium.


Conflict of interest statement

Author Information. The authors declare the following competing interests: L.W.P., R.C.-W., J.K., G.R., and A.B.J. are employees of Novartis Institutes for BioMedical Research, as indicated in the affiliations. A.M.K. is a founder and SAB member of 1Cell-Bio.

Figures

Extended Data Figure 1:
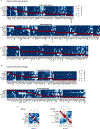
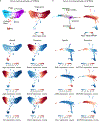
Extended Data Figure 1:. Atlas of transcription factors, surface molecules and kinases enriched in proximal airway lineages of mouse and human.
Transcription factors, kinases and surface molecules in mouse (a) and human (b) identified among the list of cell type-specific genes that met the following criteria: significantly enriched in lineage (false discovery rate (FDR) <5%, permutation test), expressed at ≥50 transcripts per million (TPM), expressed in marked lineage at least 1.5X higher than second highest cluster and highest in marked lineage for 4/4 (mouse) or 2/3 (human) biological replicates. c, Pairwise correlation of cell populations identified by single cell RNAseq. The 20% most variable genes (identified as described in) detected in at least 3 cells at at least 3 counts were considered. Ward’s method was used for hierarchical clustering.
Extended Data Figure 2:
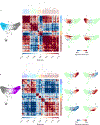
Extended Data Figure 2:. Gene modules identified in mouse tracheal lineages.
Gene modules were identified by selecting variable genes within the given population that were correlated with at least 4 other genes with rank correlation > 0.2. Gene-gene correlation heat map shows 4 gene modules in mouse airway basal cells (a) and 6 gene modules in mouse airway secretory cells (b). SPRING plots show where gene modules are expressed in a given population. Multiple genes are combined in a single signature defined as the mean rank of expression (dense ranking).
Extended Data Figure 3:
Extended Data Figure 3:. Gene modules identified in human bronchial lineages.
Two major modules of anti-correlated genes were identified by selecting variable genes within the basal to secretory continuum that were correlated with at least 4 other genes with rank correlation > 0.12. Genes within each module were then separately considered within basal and secretory cells, keeping genes with a correlation > 0.35 with at least 4 other genes. Gene-gene correlation heat map shows 3 gene modules in human airway basal cells (a) and 4 gene modules in human airway secretory cells (b). SPRING plots show where gene modules are active in a given population. Multiple genes are combined in a single signature defined as the mean rank of expression (dense ranking).
Extended Data Figure 4:
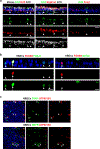
Extended Data Figure 4:. Validation of novel lineages in mouse and human by immunofluorescence.
a, Immunofluorescence in mouse tracheal epithelium for Krt4 (green, arrowheads), Krt5 (basal), Krt8 (luminal), Scgb1a1 (club, secretory) and Foxj1 (ciliated) (n=3 animals). b, Immunofluorescence in differentiated HBEC cultures for FOXN4 (red, arrows), FOXJ1 (arrowheads mark FOXJ1low cells) and Acetylated αTubulin (cilia) (n=2 donors). c, Immunofluorescence in HBEC cultures for the ionocyte markers FOXI1, ATP6V1B1 and NGFR (n=3 donors). Arrowhead shows apical enrichment of ATP6V1B1. Arrows highlight lateral protrusions. Scale bar, 20 μm.
Extended Data Figure 5:
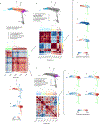
Extended Data Figure 5:. Identification of recovery-specific cell states and population dynamics during regeneration.
a, Cells from uninjured mouse airway do not equally populate all regions of the SPRING plot of all mouse data combined. Each cell from the uninjured condition voted for its 10 nearest neighbors among all mouse cells profiled, and smoothed vote counts are used as a proxy for uninjured cell density on the map (two leftmost plots). By visual inspection of the smooth vote distribution a threshold of 25 votes was chosen to binarize regions of the SPRING plot into present vs depleted in uninjured. b, Barcharts representing abundance of rare populations as a fraction of all cells, over time post-injury. Error bars represent the 95% binomial proportion confidence interval (normal approximation). Total number cells = 7,898 from n=4 mice (uninjured), 898 from n=1 mouse (24h), 1,964 from n=1 mouse (48h), 1,082 from n=1 mouse (72h) and 2,321 from n=4 mice (1 week). c, Barcharts showing the fraction of all cells that are express Foxi1 in each population during recovery. Values shown correspond to fraction of all cells at each time point (cell and mouse numbers as in b above). Error bars defined as in b.
Extended Data Figure 6:
Extended Data Figure 6:. Analysis of basal to ciliated differentiation trajectory following injury.
a, Population Balance Analysis (PBA, see Methods) was used to order 609 cells highlighted in black along the pseudotime of their basal-to-ciliated progression, followed by application of a moving average over a window of 100 cells. The resulting ordering of averaged cells is referred to as the basal-to-ciliated trajectory. PBA requires manually selecting source and sink cells for calculating the pseudotime. b, Heat map of the 1237 genes differentially expressed genes along the basal-to-ciliated trajectory (permutation test, FDR<5%, fold-changemax≥2, see Methods). Genes ordered by expression weighted mean position, defined for an expression time series xt as τ=tt xt / txtc, Heat map of transcription factors (TFs) only. Hierarchical clustering revealed six major clusters of correlated genes. Clusters were ordered by mean expression weighted mean position. d, Plots of up to 5 TFs sampled from each cluster. The y-axis shows the average expression of a gene within the window of 100 cells ± SEM (or +1/[window size] for mean values of zero), normalized to the max. value. The total trajectory includes 609 cells.
Extended Data Figure 7:
Extended Data Figure 7:. Specification and characterization of FOXI1 lineage in human bronchial epithelium.
a, HBECs were transduced at seeding with GFP or GFP:FOXI1 lentivirus, differentiated and sorted for GFP (shown is representative gating strategy (n=12). b, Fold change in transduced cells (GFP+, n=8 samples) compared to non-transduced cells (GFP-, n=7 samples) was determined by RT-qPCR normalized to GAPDH. Pooled data from 2 donors are represented as mean ± standard error of the mean (SEM). *p-value for FOXI1=.001, for CFTR=.04, ATP6V1B1=.006, FOXJ1=.01 and for SCGB1A1=.02 by two-tailed t-test. c, Fluorescent in situ hybridization (RNAscope®) for FOXI1 and CFTR in rHBEC culture transduced with GFP or GFP:FOXI1. Note that while there is an increase in FOXI1/CFTR co-labeled cells, not all FOXI1 cells express CFTR. (arrowheads vs. arrows) (n=2 independent experiments in 2 donors) d,e Chromogenic in situ hybridization (RNAscope®) in primary human bronchial tissue surface epithelium and gland ducts for CFTR and FOXI1 (d) or FOXJ1 (e). Chromogenic signals were split and pseudocolored to reveal individual channels; higher magnification is shown for boxed regions. Note that CFTR is highly enriched in FOXI1+ but not FOXJ1+ cells (n=1 donor, 5 regions of bronchial tree analyzed). Scale bars, 20 μm.
Extended Data Figure 8:
Extended Data Figure 8:. Single-cell RNA-seq analysis of GFP- and GFP:FOXI1-transduced HBECs.
a, SPRING plot combining cells transduced with GFP (n= 9,436) or GFP:FOXI1 (n=10,330), with each of the two conditions highlighted in black (total cells n=19,766). b, The SLC16A7+ population was identified to be absent in the viral transduction experiment after mapping single cell transcriptome onto the reference state map. Each cell from the viral transduction experiment voted for its nearest neighbor in the reference experiment. The bar chart on the right shows the average number of votes per cluster. c, Cell states unique to the viral transduction experiment were identified as detailed in Extended Data Fig. 5a. d, Cells representing states also found in the reference experiment (conserved cells) inherited the label of their single nearest neighbor in the reference map. Cells specific to the viral transduction experiment were divided into four clusters by spectral clustering, with their top 5 enriched genes shown in the top part of the heat map (right). Enrichment of gene g in population i is defined as the fold-change in expression of g in i versus the second highest expresser. A pseudo value of 10 TPM was added before calculating the fold-change, and only genes expressed at >50 TPM in at least on cluster were considered. The bottom of the heat map shows the top 20 enriched genes identified treating all four transduction-specific states as one population. e, Bar chart showing fold-changes in population size following GFP:FOXI1 vs GFP transduction (extension of Fig. 3d). f, Expression of transgene in identified cell populations.
Extended Data Figure 9:
Extended Data Figure 9:. Notch pathway component enrichment in airway lineages.
SPRING plots show enrichment of Notch pathway components in mouse (a) and human (b) airway lineages. Normalized counts are shown for the Notch ligands JAG1, JAG2 and DLL1 and the Notch receptors NOTCH1, NOTCH2 and NOTCH3. The Notch target gene signature combines HES1, HES5 and NRARP into a single gene signature defined as the mean expression rank (dense ranking). All gene expression and signature values are smoothed (see Methods for smoothing).
Extended Data Figure 10:
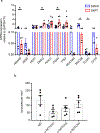
Extended Data Figure 10:. Notch signaling inhibition decreases ionocyte markers in HBECs.
a, Expression of Notch target genes and airway lineage markers in cultures treated with 3.3 μM DAPT compared to cultures treated with DMSO. Notch target genes (NRARP p=.03, HES5) and secretory cell markers (MUC5B p=.001, MUC5AC) are decreased while ciliated cell markers (FOXJ1, DNAI2 p=.01) and basal cell markers (ITGA6 p=.006 and TP63) are increased upon DAPT treatment. Note that ionocyte markers (FOXI1 p=.02, CFTR) are also decreased upon DAPT treatment. P-value determined by two-tailed t-test (n=8 experiments in 2 donors). b, FOXI1 cell counts in HBEC cultures treated with antibodies that neutralize individual NOTCH receptors (n=5 experiments in 2 donors). All data are mean ± SEM.
Figure 1:
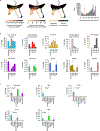
Figure 1:. Single-cell RNA-seq of proximal airway epithelial cells in mouse and human.
a, Mouse tracheal epithelial cells were isolated, dissociated and collected for inDrops scRNA-seq. Human bronchial epithelial cells (HBECs) were cultured for 1 week submerged, followed by 2 weeks at an air-liquid-interface (ALI) and collected for scRNA-seq. b, Mouse tracheal epithelium (n=3 mice) and differentiated HBEC culture (n=3 donors) are pseudostratified, containing basal cells (KRT5) secretory cells (Scgb1a1 in mouse; MUC5B in human), and ciliated cells (AcTub, Acetylated αTubulin). Scale bars, 20μm. c,d, SPRING plots of scRNA-seq data for mouse tracheal epithelial cells (n=4 mice, 7,662 cells) (c) and HBECs (n=3 donors, 2,970 cells) (d) colored by inferred cell type, with heat maps of lineage-specific genes by biological replicates (rows). Cell numbers are post quality control. PNEC=pulmonary neuroendocrine cells. Lineage markers for PNECs and brush cells were expressed in rare cells in HBEC cultures, and formed just one human cluster.
Figure 2:
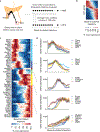
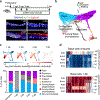
Figure 2:. Single-cell RNA-seq reveals recovery specific cell states.
a, Mice were administered 2% polidocanol by oralpharyngeal aspiration and tracheae were collected 1 (n=1), 2 (n=1), 3 (n=1), and 7 (n=3) days post injury (dpi) for scRNA-seq. Immunofluorescence for basal cells (Krt5) and lumenal markers (AcTub and Scgb1a1) shows lumenal lineages are shed 1dpi (n=3), basal population expands 2dpi (n=4), mature lumenal markers are visible 3dpi (n=3) and the differentiated epithelium is restored by 7dpi (compare to Fig 1b; n=3). b, SPRING plot of scRNA-seq data showing cells from uninjured (n=7,898) and regenerating (n=6,265) mice. Cell states that emerge during regeneration are shown in gray (see Extended data Fig. 5a, methods). c, Top: Enrichment of scRNA-Seq cell states compared to uninjured; Bottom: the relative abundance of cell types at each time point. Rare = ionocytes, brush, and PNECs. d, Keratin gene expression patterns in basal cells alter between uninjured trachea and 1dpi. The heat maps show imputed expression counts, with range 5th to 95th percentile. Basal and Krt4/Krt13+ cluster cells shown.
Figure 3:
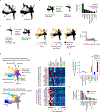
Figure 3:. FOXI1 specifies a novel cell type, the CFTR-rich ‘pulmonary ionocyte’.
a, Immunofluorescence for FOXI1 (red, arrow), and airway lineage markers (green, arrowheads); TP63 (basal), FOXJ1 (ciliated), MUC5B (secretory) and ASCL1 (PNEC) in differentiated HBEC cultures (n=3 donors). b, Fluorescent in situ hybridization (RNAscope®) in mouse tracheal epithelium (n=3 mice) and human bronchial epithelium (n=2 donors) for FOXI1 (red) and CFTR (green). c, HBECs were transduced at seeding with GFP or GFP:FOXI1 lentivirus, differentiated and then profiled by scRNAseq or analyzed by immunofluorescence (IF). d, Immunofluorescence for ATP6V1B1 (white) and FOXI1 (red) in HBECs transduced with GFP or GFP:FOXI1 (n=4 experiments from two donors). Scale bars, 20μm. e,f, Fold-change in fractions of cell states revealed by scRNA-seq in GFP:FOXI1 vs. GFP. Heatmap values correspond to the ratio of cell numbers from the viral transduction experiments projecting onto each point of the reference HBEC data set from Fig. 1b. Extended Data Fig. 8e extends to populations specific to viral transduction. g, Ionocytes induced by GFP:FOXI1 are transcriptionally similar to natural ionocytes, shown by comparing their gene expression in scRNA-seq data from three experimental conditions (Reference data from Fig. 1d). The genes shown are markers of each epithelial cell type (bottom), with ionocyte markers shown in detail (top). Genes are normalized to the median expression level across populations observed in a given condition.
Figure 4:
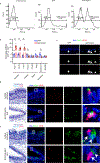
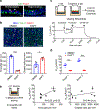
Figure 4:. Pulmonary ionocytes are a major source of CFTR activity.
a, Immunofluorescence for Krt5 (green) and Foxi1 (red) in mouse tracheae at homeostasis (left, n=3) or 3 days post injury (right, n=3). Arrowhead: Foxi1+Krt5+ cells. Arrow: Foxi1+Krt5- cell. Scale bars, 20μm. b, Immunofluorescence and quantification for ionocytes (FOXI1+, red, arrowheads) and ciliated cells (FOXJ1+, green) in HBEC cultures treated with DMSO or DAPT, scale bar, 100 μm, (n=4 experiments in one donor). *p-value=0.01, ***p-value=1.1×10⁻⁶ by two-tailed t-test c, HBECs were treated with DMSO or DAPT upon culture at ALI. After differentiation (2–3 weeks), cultures were loaded into Ussing chambers and short circuit current (Isc) was recorded during addition of Amiloride, Forskolin, and a CFTR-inhibitor, CFTR(inh)-172. Shown is a representative tracing from Donor 1 (n=11). d, Change in short circuit current (ΔIsc) in response to Forskolin measured in DMSO (n=7 cultures per donor) and DAPT-treated cultures, (n=8 cultures per donor). ***p-value<1×10⁻⁸ by two-tailed t-test. e, Donor mean ΔIsc in response to Forskolin plotted against mean number of ionocytes (FOXI1+) or ciliated cells (FOXJ1+) (n=7). All data are mean ± SEM. R = Pearson correlation with associated p-value. n.s., not significant.

Comment in

Similar articles

Cited by

References

    1. Rock JR, Randell SH & Hogan BLM Airway basal stem cells: a perspective on their roles in epithelial homeostasis and remodeling. Dis. Model. Mech 3, 545–556 (2010). - PMC - PubMed
    1. Hogan BLM et al. Repair and regeneration of the respiratory system: Complexity, plasticity, and mechanisms of lung stem cell function. Cell Stem Cell 15, 123–138 (2014). - PMC - PubMed
    1. Hong KU, Reynolds SD, Watkins S, Fuchs E & Stripp BR In vivo differentiation potential of tracheal basal cells: evidence for multipotent and unipotent subpopulations. Am J Physiol Lung Cell Mol Physiol 286, L643–L649 (2004). - PubMed
    1. Rock JR et al. Basal cells as stem cells of the mouse trachea and human airway epithelium. Proc. Natl. Acad. Sci. U. S. A 106, 12771–12775 (2009). - PMC - PubMed
    1. Pardo-Saganta A et al. Injury Induces Direct Lineage Segregation of Functionally Distinct Airway Basal Stem/Progenitor Cell Subpopulations. Cell Stem Cell 16, 184–197 (2015). - PMC - PubMed

Publication types

MeSH terms

Substances