

Targeting WEE1 to enhance conventional therapies for acute lymphoblastic leukemia
- PMID: 30068368
- PMCID: PMC6090987
- DOI: 10.1186/s13045-018-0641-1
Targeting WEE1 to enhance conventional therapies for acute lymphoblastic leukemia
Abstract
Background: Despite the recent progress that has been made in the understanding and treatment of acute lymphoblastic leukemia (ALL), the outcome is still dismal in adult ALL cases. Several studies in solid tumors identified high expression of WEE1 kinase as a poor prognostic factor and reported its role as a cancer-conserving oncogene that protects cancer cells from DNA damage. Therefore, the targeted inhibition of WEE1 kinase has emerged as a rational strategy to sensitize cancer cells to antineoplastic compounds, which we evaluate in this study.
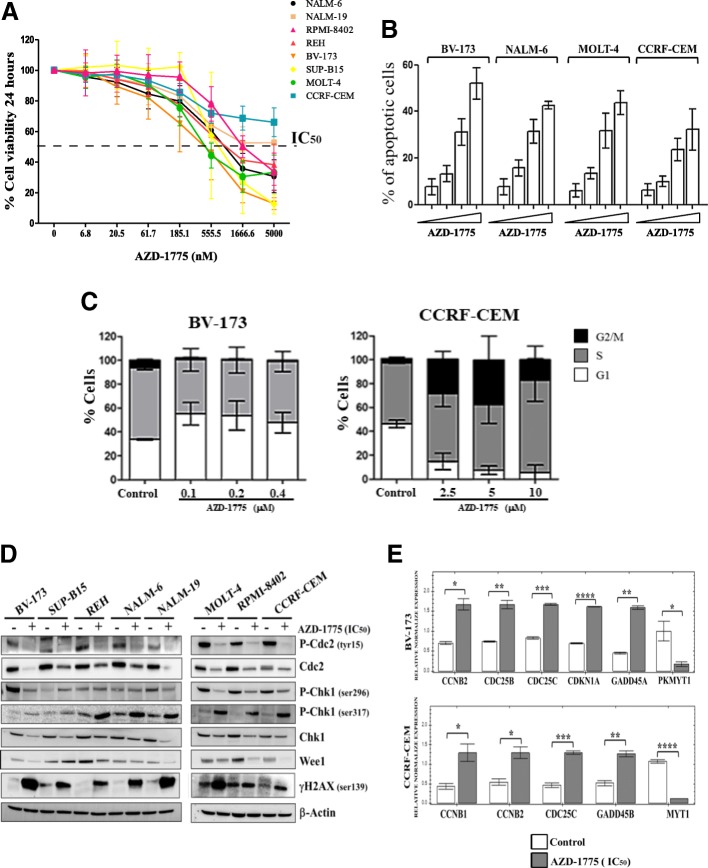
Methods: The effectiveness of the selective WEE1 inhibitor AZD-1775 as a single agent and in combination with different antineoplastic agents in B and T cell precursor ALL (B/T-ALL) was evaluated in vitro and ex vivo studies. The efficacy of the compound in terms of cytotoxicity, induction of apoptosis, and changes in gene and protein expression was assessed using different B/T-ALL cell lines and confirmed in primary ALL blasts.
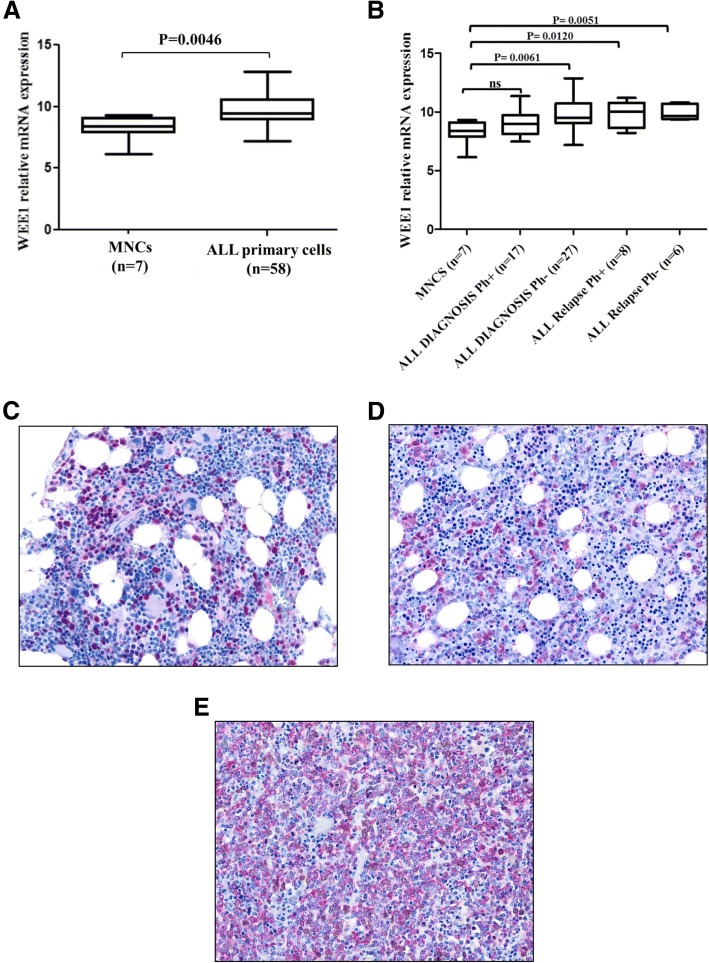
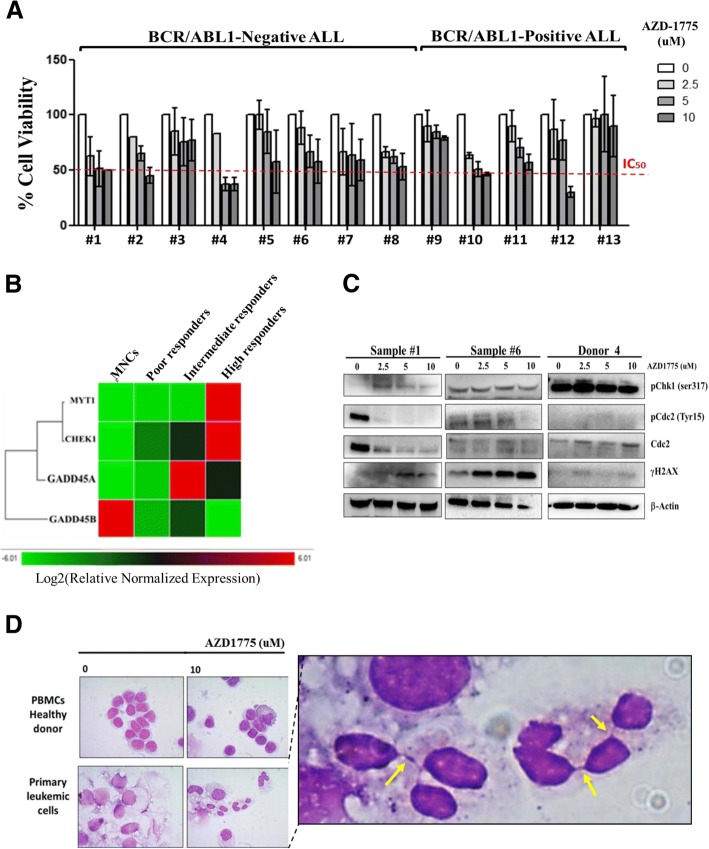
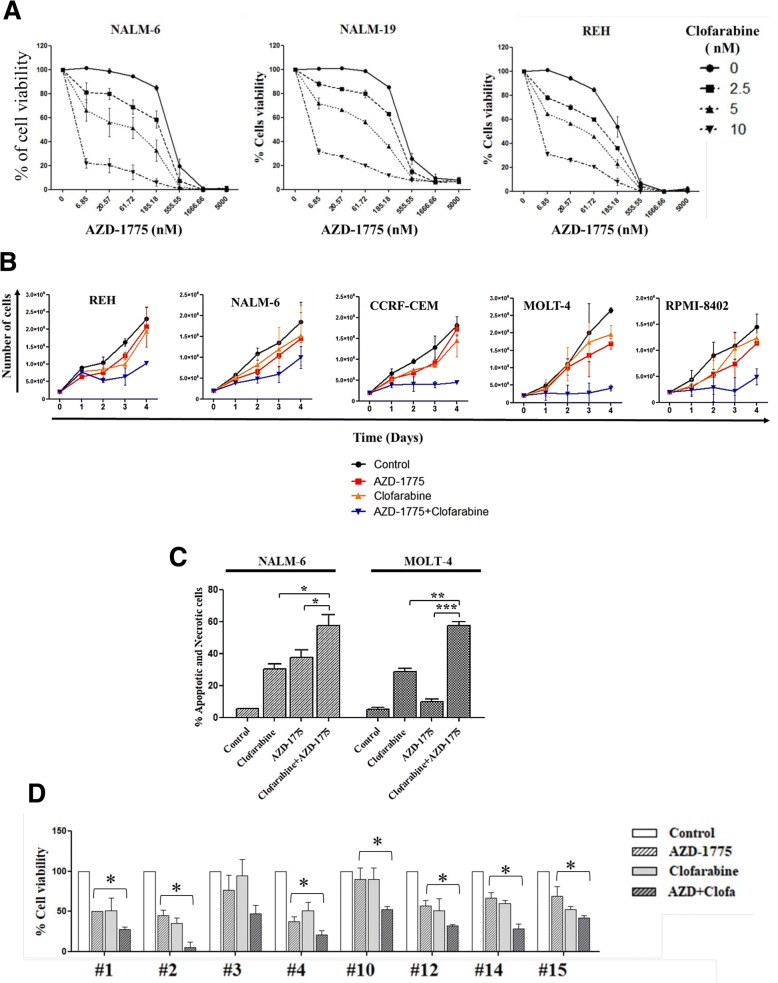
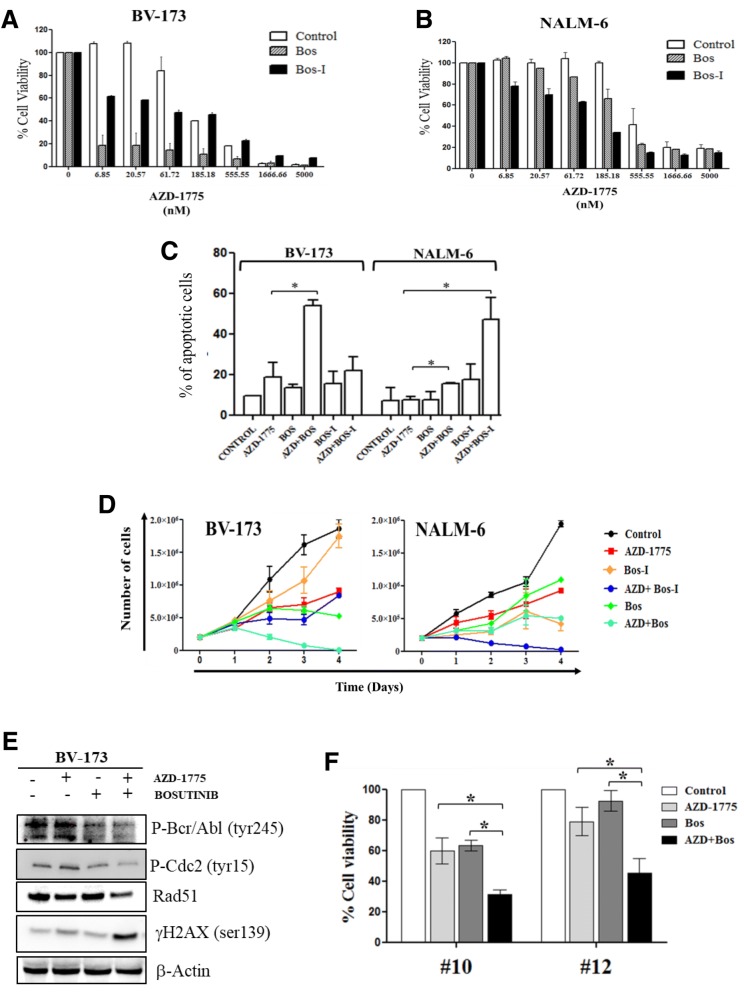
Results: We showed that WEE1 was highly expressed in adult primary ALL bone marrow and peripheral blood blasts (n = 58) compared to normal mononuclear cells isolated from the peripheral blood of healthy donors (p = 0.004). Thus, we hypothesized that WEE1 could be a rational target in ALL, and its inhibition could enhance the cytotoxicity of conventional therapies used for ALL. We evaluated the efficacy of AZD-1775 as a single agent and in combination with several antineoplastic agents, and we elucidated its mechanisms of action. AZD-1775 reduced cell viability in B/T-ALL cell lines by disrupting the G2/M checkpoint and inducing apoptosis. These findings were confirmed in human primary ALL bone marrow and peripheral blood blasts (n = 15). In both cell lines and primary leukemic cells, AZD-1775 significantly enhanced the efficacy of several tyrosine kinase inhibitors (TKIs) such as bosutinib, imatinib, and ponatinib, and of chemotherapeutic agents (clofarabine and doxorubicin) in terms of the reduction of cell viability, apoptosis induction, and inhibition of proliferation.
Conclusions: Our data suggest that WEE1 plays a role in ALL blast's survival and is a bona fide target for therapeutic intervention. These data support the evaluation of the therapeutic potential of AZD-1775 as chemo-sensitizer agent for the treatment of B/T-ALL.
Keywords: Acute lymphoblastic leukemia; Chemo-sensitizer agent; G2/M checkpoint; WEE1 inhibitor.
Conflict of interest statement
The study was approved by the Ethical Committee at Policlinico-Universitario S. Orsola Malpighi. Full informed consent was obtained from all patients.
Not applicable
GM has competing interests with Novartis, BMS, Roche, Pfizer, ARIAD, MSD.
Springer Nature remains neutral with regard to jurisdictional claims in published maps and institutional affiliations.
Figures
Similar articles
-
WEE1 inhibition induces glutamine addiction in T-cell acute lymphoblastic leukemia.Haematologica. 2021 Jul 1;106(7):1816-1827. doi: 10.3324/haematol.2019.231126. Haematologica. 2021. PMID: 31919076 Free PMC article.
-
Synergism Through WEE1 and CHK1 Inhibition in Acute Lymphoblastic Leukemia.Cancers (Basel). 2019 Oct 25;11(11):1654. doi: 10.3390/cancers11111654. Cancers (Basel). 2019. PMID: 31717700 Free PMC article.
-
Bortezomib Is Effective in the Treatment of T Lymphoblastic Leukaemia by Inducing DNA Damage, WEE1 Downregulation, and Mitotic Catastrophe.Int J Mol Sci. 2023 Sep 27;24(19):14646. doi: 10.3390/ijms241914646. Int J Mol Sci. 2023. PMID: 37834095 Free PMC article.
-
Targeting WEE1 Kinase in Cancer.Trends Pharmacol Sci. 2016 Oct;37(10):872-881. doi: 10.1016/j.tips.2016.06.006. Epub 2016 Jul 14. Trends Pharmacol Sci. 2016. PMID: 27427153 Review.
-
Wee1 kinase as a target for cancer therapy.Cell Cycle. 2013 Oct 1;12(19):3159-64. doi: 10.4161/cc.26062. Epub 2013 Aug 26. Cell Cycle. 2013. PMID: 24013427 Free PMC article. Review.
Cited by
-
Targeting the DNA damage response in hematological malignancies.Front Oncol. 2024 Jan 29;14:1307839. doi: 10.3389/fonc.2024.1307839. eCollection 2024. Front Oncol. 2024. PMID: 38347838 Free PMC article. Review.
-
WEE1 inhibition induces glutamine addiction in T-cell acute lymphoblastic leukemia.Haematologica. 2021 Jul 1;106(7):1816-1827. doi: 10.3324/haematol.2019.231126. Haematologica. 2021. PMID: 31919076 Free PMC article.
-
Axitinib in Ponatinib-Resistant B-Cell Acute Lymphoblastic Leukemia Harboring a T315L Mutation.Int J Mol Sci. 2020 Dec 20;21(24):9724. doi: 10.3390/ijms21249724. Int J Mol Sci. 2020. PMID: 33419251 Free PMC article.
-
Development and Characterization of a Wee1 Kinase Degrader.Cell Chem Biol. 2020 Jan 16;27(1):57-65.e9. doi: 10.1016/j.chembiol.2019.10.013. Epub 2019 Nov 14. Cell Chem Biol. 2020. PMID: 31735695 Free PMC article.
-
The DNA damage repair-related gene PKMYT1 is a potential biomarker in various malignancies.Transl Lung Cancer Res. 2021 Dec;10(12):4600-4616. doi: 10.21037/tlcr-21-973. Transl Lung Cancer Res. 2021. PMID: 35070764 Free PMC article.
References
-
- Onciu M. Acute lymphoblastic leukemia. Hematol Oncol Clin North Am. 2009;23(4):655–74. - PubMed
-
- Fielding AK. Current therapeutic strategies in adult acute lymphoblastic leukemia. Hematol Oncol Clin North Am. 2011;25(6):1255–79. - PubMed
-
- Narayanan S, Shami PJ. Treatment of acute lymphoblastic leukemia in adults. Crit Rev Oncol Hematol. 2012;81:94–102. - PubMed
Publication types
MeSH terms
Substances
Grants and funding
LinkOut - more resources
Full Text Sources
Other Literature Sources
Research Materials
