

Experimental microbial dysbiosis does not promote disease progression in SIV-infected macaques
- PMID: 30061696
- PMCID: PMC6129204
- DOI: 10.1038/s41591-018-0132-5
Experimental microbial dysbiosis does not promote disease progression in SIV-infected macaques
Abstract
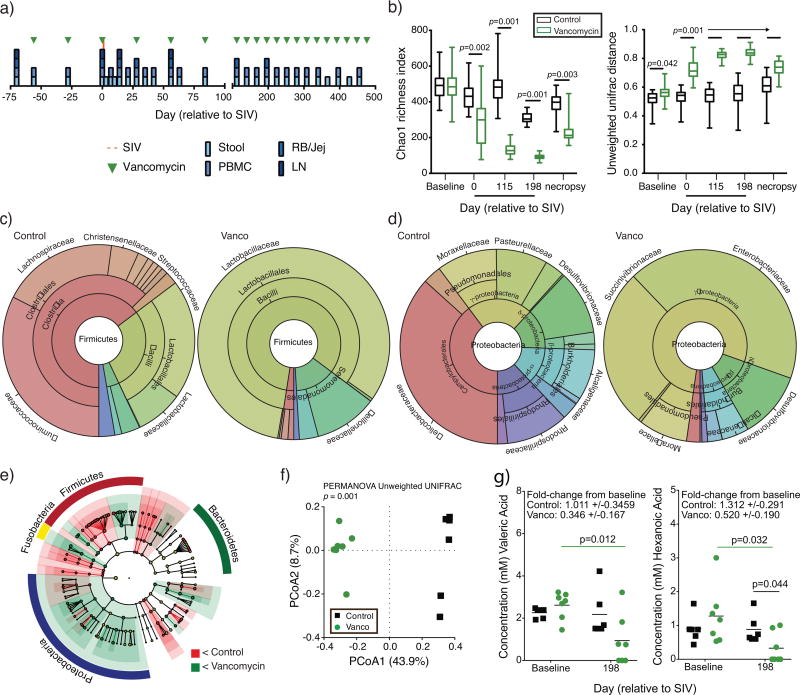
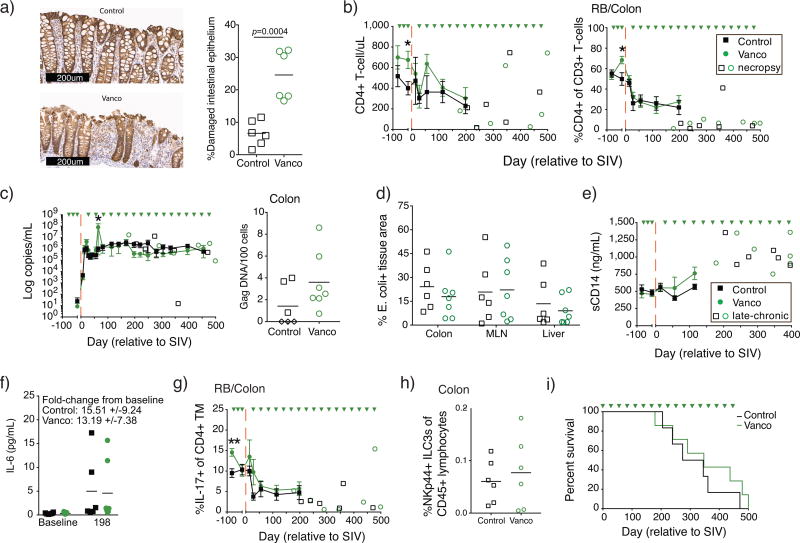
Intestinal microbial dysbiosis has been described in individuals with an HIV-1 infection and may underlie persistent inflammation in chronic infection, thereby contributing to disease progression. Herein, we induced an HIV-1-like intestinal dysbiosis in rhesus macaques (Macaca mulatta) with vancomycin treatment and assessed the contribution of dysbiosis to SIV disease progression. Dysbiotic and control animals had similar disease progression, indicating that intestinal microbial dysbiosis similar to that observed in individuals with HIV is not sufficient to accelerate untreated lentiviral disease progression.
Conflict of interest statement
The authors have no competing interests as defined by Nature Publishing Group, or other interests that might be perceived to influence the results and/or discussion reported in this article.
Figures
Similar articles
-
Microbial Dysbiosis During Simian Immunodeficiency Virus Infection is Partially Reverted with Combination Anti-retroviral Therapy.Sci Rep. 2020 Apr 14;10(1):6387. doi: 10.1038/s41598-020-63196-0. Sci Rep. 2020. PMID: 32286417 Free PMC article.
-
Elite Control, Gut CD4 T Cell Sparing, and Enhanced Mucosal T Cell Responses in Macaca nemestrina Infected by a Simian Immunodeficiency Virus Lacking a gp41 Trafficking Motif.J Virol. 2015 Oct;89(20):10156-75. doi: 10.1128/JVI.01134-15. Epub 2015 Jul 29. J Virol. 2015. PMID: 26223646 Free PMC article.
-
Increased stability and limited proliferation of CD4+ central memory T cells differentiate nonprogressive simian immunodeficiency virus (SIV) infection of sooty mangabeys from progressive SIV infection of rhesus macaques.J Virol. 2014 Apr;88(8):4533-42. doi: 10.1128/JVI.03515-13. Epub 2014 Feb 5. J Virol. 2014. PMID: 24501416 Free PMC article.
-
Critical Role for Monocytes/Macrophages in Rapid Progression to AIDS in Pediatric Simian Immunodeficiency Virus-Infected Rhesus Macaques.J Virol. 2017 Aug 10;91(17):e00379-17. doi: 10.1128/JVI.00379-17. Print 2017 Sep 1. J Virol. 2017. PMID: 28566378 Free PMC article.
-
Monocyte/macrophage trafficking in acquired immunodeficiency syndrome encephalitis: lessons from human and nonhuman primate studies.J Neurovirol. 2008 Aug;14(4):318-26. doi: 10.1080/13550280802132857. J Neurovirol. 2008. PMID: 18780233 Free PMC article. Review.
Cited by
-
Alterations of the gut microbiome in HIV infection highlight human anelloviruses as potential predictors of immune recovery.Microbiome. 2024 Oct 17;12(1):204. doi: 10.1186/s40168-024-01925-7. Microbiome. 2024. PMID: 39420423 Free PMC article.
-
Maturation of the infant rhesus macaque gut microbiome and its role in the development of diarrheal disease.Genome Biol. 2019 Aug 26;20(1):173. doi: 10.1186/s13059-019-1789-x. Genome Biol. 2019. PMID: 31451108 Free PMC article.
-
Multiple modes of antigen exposure induce clonotypically diverse epitope-specific CD8+ T cells across multiple tissues in nonhuman primates.PLoS Pathog. 2022 Jul 7;18(7):e1010611. doi: 10.1371/journal.ppat.1010611. eCollection 2022 Jul. PLoS Pathog. 2022. PMID: 35797339 Free PMC article.
-
Profile of the Lower Respiratory Tract Microbiome in Human Immunodeficiency Virus/Acquired Immunodeficiency Syndrome and Lung Disease.Front Microbiol. 2022 Jun 23;13:888996. doi: 10.3389/fmicb.2022.888996. eCollection 2022. Front Microbiol. 2022. PMID: 35814692 Free PMC article.
-
From dysbiosis to defense: harnessing the gut microbiome in HIV/SIV therapy.Microbiome. 2024 Jun 21;12(1):113. doi: 10.1186/s40168-024-01825-w. Microbiome. 2024. PMID: 38907315 Free PMC article. Review.
References
Publication types
MeSH terms
Substances
Grants and funding
LinkOut - more resources
Full Text Sources
Other Literature Sources
