Detection of Succinate by Intestinal Tuft Cells Triggers a Type 2 Innate Immune Circuit
- PMID: 30021144
- PMCID: PMC6084797
- DOI: 10.1016/j.immuni.2018.06.016
Detection of Succinate by Intestinal Tuft Cells Triggers a Type 2 Innate Immune Circuit
Abstract
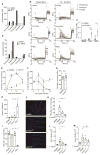
In the small intestine, type 2 responses are regulated by a signaling circuit that involves tuft cells and group 2 innate lymphoid cells (ILC2s). Here, we identified the microbial metabolite succinate as an activating ligand for small intestinal (SI) tuft cells. Sequencing analyses of tuft cells isolated from the small intestine, gall bladder, colon, thymus, and trachea revealed that expression of tuft cell chemosensory receptors is tissue specific. SI tuft cells expressed the succinate receptor (SUCNR1), and providing succinate in drinking water was sufficient to induce a multifaceted type 2 immune response via the tuft-ILC2 circuit. The helminth Nippostrongylus brasiliensis and a tritrichomonad protist both secreted succinate as a metabolite. In vivo sensing of the tritrichomonad required SUCNR1, whereas N. brasiliensis was SUCNR1 independent. These findings define a paradigm wherein tuft cells monitor microbial metabolites to initiate type 2 immunity and suggest the existence of other sensing pathways triggering the response to helminths.
Keywords: ILC2; chemosensing; helminth; nippostrongylus brasiliensis; protist; small intestine; succinate; tritrichomonas; tuft cell; type 2 immunity.
Copyright © 2018 Elsevier Inc. All rights reserved.
Conflict of interest statement
The authors declare no competing interests.
Figures


Comment in
-
Getting a Taste for Parasites in the Gut.Immunity. 2018 Jul 17;49(1):16-18. doi: 10.1016/j.immuni.2018.07.002. Immunity. 2018. PMID: 30021142
Similar articles
-
Activation of intestinal tuft cell-expressed Sucnr1 triggers type 2 immunity in the mouse small intestine.Proc Natl Acad Sci U S A. 2018 May 22;115(21):5552-5557. doi: 10.1073/pnas.1720758115. Epub 2018 May 7. Proc Natl Acad Sci U S A. 2018. PMID: 29735652 Free PMC article.
-
Tuft-Cell-Derived Leukotrienes Drive Rapid Anti-helminth Immunity in the Small Intestine but Are Dispensable for Anti-protist Immunity.Immunity. 2020 Mar 17;52(3):528-541.e7. doi: 10.1016/j.immuni.2020.02.005. Epub 2020 Mar 10. Immunity. 2020. PMID: 32160525 Free PMC article.
-
A Metabolite-Triggered Tuft Cell-ILC2 Circuit Drives Small Intestinal Remodeling.Cell. 2018 Jul 12;174(2):271-284.e14. doi: 10.1016/j.cell.2018.05.014. Epub 2018 Jun 7. Cell. 2018. PMID: 29887373 Free PMC article.
-
Regulation of immune responses by tuft cells.Nat Rev Immunol. 2019 Sep;19(9):584-593. doi: 10.1038/s41577-019-0176-x. Nat Rev Immunol. 2019. PMID: 31114038 Free PMC article. Review.
-
The Role of Succinate in the Regulation of Intestinal Inflammation.Nutrients. 2018 Dec 22;11(1):25. doi: 10.3390/nu11010025. Nutrients. 2018. PMID: 30583500 Free PMC article. Review.
Cited by
-
Roles of innate lymphoid cells (ILCs) in allergic diseases: The 10-year anniversary for ILC2s.J Allergy Clin Immunol. 2021 May;147(5):1531-1547. doi: 10.1016/j.jaci.2021.03.015. J Allergy Clin Immunol. 2021. PMID: 33965091 Free PMC article. Review.
-
Food for thought - ILC metabolism in the context of helminth infections.Mucosal Immunol. 2022 Jun;15(6):1234-1242. doi: 10.1038/s41385-022-00559-y. Epub 2022 Aug 31. Mucosal Immunol. 2022. PMID: 36045216 Free PMC article. Review.
-
Interrogating the Small Intestine Tuft Cell-ILC2 Circuit Using In Vivo Manipulations.Curr Protoc. 2021 Mar;1(3):e77. doi: 10.1002/cpz1.77. Curr Protoc. 2021. PMID: 33740294 Free PMC article.
-
Crosstalk between epithelium, myeloid and innate lymphoid cells during gut homeostasis and disease.Front Immunol. 2022 Sep 16;13:944982. doi: 10.3389/fimmu.2022.944982. eCollection 2022. Front Immunol. 2022. PMID: 36189323 Free PMC article. Review.
-
Loss of Elp3 blocks intestinal tuft cell differentiation via an mTORC1-Atf4 axis.EMBO J. 2024 Sep;43(18):3916-3947. doi: 10.1038/s44318-024-00184-4. Epub 2024 Jul 31. EMBO J. 2024. PMID: 39085648 Free PMC article.
References
-
- Barker N. Adult intestinal stem cells: critical drivers of epithelial homeostasis and regeneration. Nat Rev Mol Cell Biol. 2014;15:19–33. - PubMed
-
- Bezençon C, Fürholz A, Raymond F, Mansourian R, Métairon S, Le Coutre J, Damak S. Murine intestinal cells expressing Trpm5 are mostly brush cells and express markers of neuronal and inflammatory cells. J Comp Neurol. 2008;509:514–525. - PubMed
Publication types
MeSH terms
Substances
Grants and funding
LinkOut - more resources
Full Text Sources
Other Literature Sources
Molecular Biology Databases
Research Materials

