

Reversal of indoleamine 2,3-dioxygenase-mediated cancer immune suppression by systemic kynurenine depletion with a therapeutic enzyme
- PMID: 30010674
- PMCID: PMC6078800
- DOI: 10.1038/nbt.4180
Reversal of indoleamine 2,3-dioxygenase-mediated cancer immune suppression by systemic kynurenine depletion with a therapeutic enzyme
Abstract
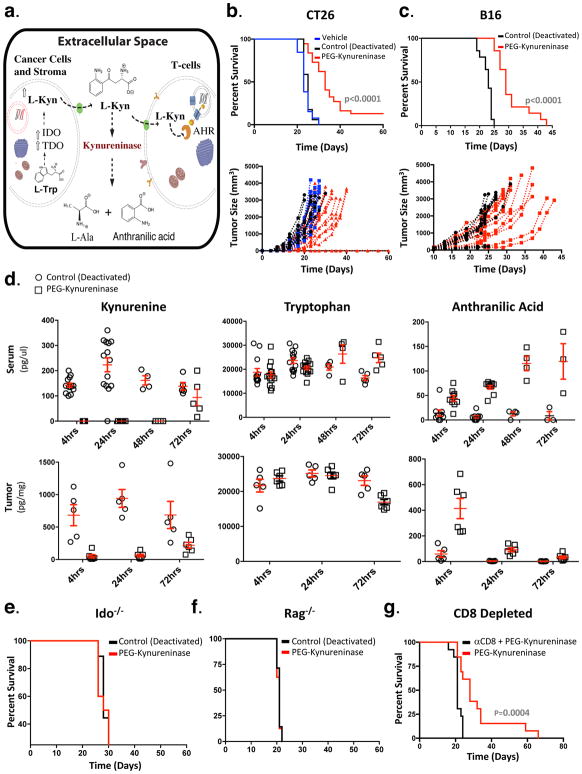
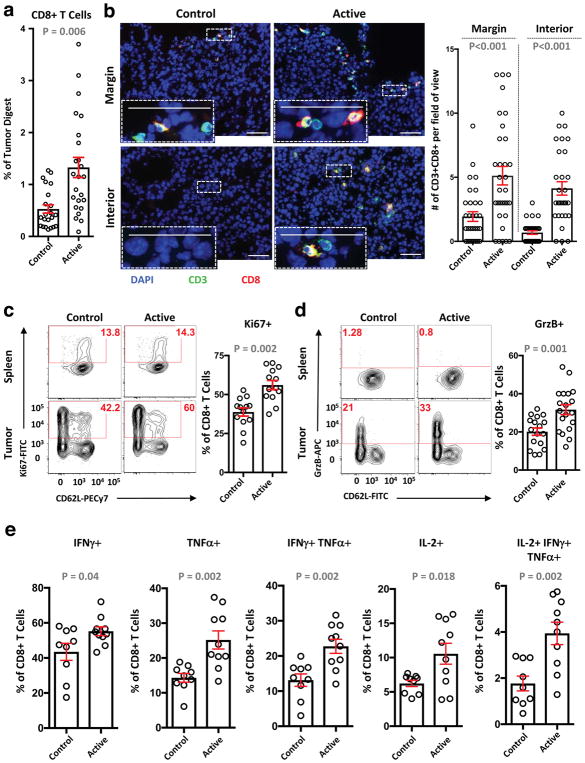
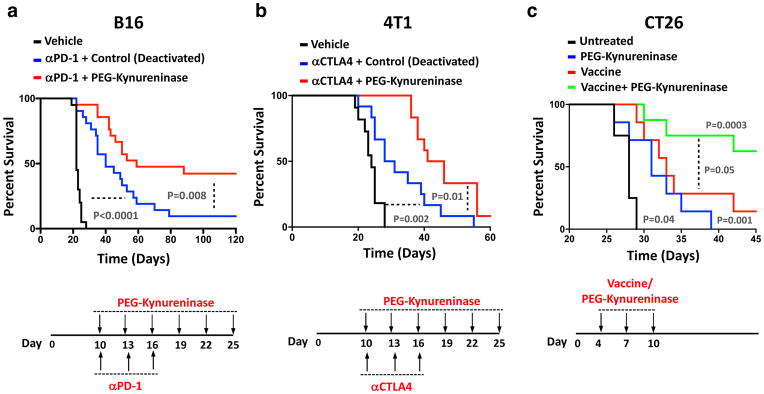
Increased tryptophan (Trp) catabolism in the tumor microenvironment (TME) can mediate immune suppression by upregulation of interferon (IFN)-γ-inducible indoleamine 2,3-dioxygenase (IDO1) and/or ectopic expression of the predominantly liver-restricted enzyme tryptophan 2,3-dioxygenase (TDO). Whether these effects are due to Trp depletion in the TME or mediated by the accumulation of the IDO1 and/or TDO (hereafter referred to as IDO1/TDO) product kynurenine (Kyn) remains controversial. Here we show that administration of a pharmacologically optimized enzyme (PEGylated kynureninase; hereafter referred to as PEG-KYNase) that degrades Kyn into immunologically inert, nontoxic and readily cleared metabolites inhibits tumor growth. Enzyme treatment was associated with a marked increase in the tumor infiltration and proliferation of polyfunctional CD8+ lymphocytes. We show that PEG-KYNase administration had substantial therapeutic effects when combined with approved checkpoint inhibitors or with a cancer vaccine for the treatment of large B16-F10 melanoma, 4T1 breast carcinoma or CT26 colon carcinoma tumors. PEG-KYNase mediated prolonged depletion of Kyn in the TME and reversed the modulatory effects of IDO1/TDO upregulation in the TME.
Conflict of interest statement
The authors declare competing financial interests: details are available in the online version of the paper.
Figures
Similar articles
-
Tryptophan: A Rheostat of Cancer Immune Escape Mediated by Immunosuppressive Enzymes IDO1 and TDO.Front Immunol. 2021 Feb 23;12:636081. doi: 10.3389/fimmu.2021.636081. eCollection 2021. Front Immunol. 2021. PMID: 33708223 Free PMC article. Review.
-
Quantification of IDO1 enzyme activity in normal and malignant tissues.Methods Enzymol. 2019;629:235-256. doi: 10.1016/bs.mie.2019.07.006. Epub 2019 Jul 24. Methods Enzymol. 2019. PMID: 31727243 Free PMC article.
-
Reimagining IDO Pathway Inhibition in Cancer Immunotherapy via Downstream Focus on the Tryptophan-Kynurenine-Aryl Hydrocarbon Axis.Clin Cancer Res. 2019 Mar 1;25(5):1462-1471. doi: 10.1158/1078-0432.CCR-18-2882. Epub 2018 Oct 30. Clin Cancer Res. 2019. PMID: 30377198 Free PMC article. Review.
-
Targeting the IDO1/TDO2-KYN-AhR Pathway for Cancer Immunotherapy - Challenges and Opportunities.Trends Pharmacol Sci. 2018 Mar;39(3):307-325. doi: 10.1016/j.tips.2017.11.007. Epub 2017 Dec 15. Trends Pharmacol Sci. 2018. PMID: 29254698 Review.
-
Tryptophan 2,3-dioxygenase in tumor cells is associated with resistance to immunotherapy in renal cell carcinoma.Cancer Sci. 2021 Mar;112(3):1038-1047. doi: 10.1111/cas.14797. Epub 2021 Jan 25. Cancer Sci. 2021. PMID: 33410234 Free PMC article.
Cited by
-
Targeting Dietary and Microbial Tryptophan-Indole Metabolism as Therapeutic Approaches to Colon Cancer.Nutrients. 2021 Apr 3;13(4):1189. doi: 10.3390/nu13041189. Nutrients. 2021. PMID: 33916690 Free PMC article. Review.
-
Near-Infrared Photoactivatable Immunomodulatory Nanoparticles for Combinational Immunotherapy of Cancer.Front Chem. 2021 May 24;9:701427. doi: 10.3389/fchem.2021.701427. eCollection 2021. Front Chem. 2021. PMID: 34109160 Free PMC article. Review.
-
Identification and Characterization of a Novel Dual Inhibitor of Indoleamine 2,3-dioxygenase 1 and Tryptophan 2,3-dioxygenase.Int J Tryptophan Res. 2022 Nov 30;15:11786469221138456. doi: 10.1177/11786469221138456. eCollection 2022. Int J Tryptophan Res. 2022. PMID: 36467776 Free PMC article.
-
Progression of m6A in the tumor microenvironment: hypoxia, immune and metabolic reprogramming.Cell Death Discov. 2024 Jul 20;10(1):331. doi: 10.1038/s41420-024-02092-2. Cell Death Discov. 2024. PMID: 39033180 Free PMC article. Review.
-
Modeling T cell temporal response to cancer immunotherapy rationalizes development of combinatorial treatment protocols.Nat Cancer. 2024 May;5(5):742-759. doi: 10.1038/s43018-024-00734-z. Epub 2024 Mar 1. Nat Cancer. 2024. PMID: 38429414
References
-
- Cheong JE, Sun L. Targeting the IDO1/TDO2-KYN-AhR Pathway for Cancer Immunotherapy - Challenges and Opportunities. Trends Pharmacol Sci. 2018;39:307–325. - PubMed
Publication types
MeSH terms
Substances
Grants and funding
LinkOut - more resources
Full Text Sources
Other Literature Sources
Research Materials
Miscellaneous
