. 2018 Oct 12;46(18):9353-9366.
doi: 10.1093/nar/gky632.

The interplay between H2A.Z and H3K9 methylation in regulating HP1α binding to linker histone-containing chromatin

Affiliations

The interplay between H2A.Z and H3K9 methylation in regulating HP1α binding to linker histone-containing chromatin

Daniel P Ryan et al. Nucleic Acids Res. .

Abstract

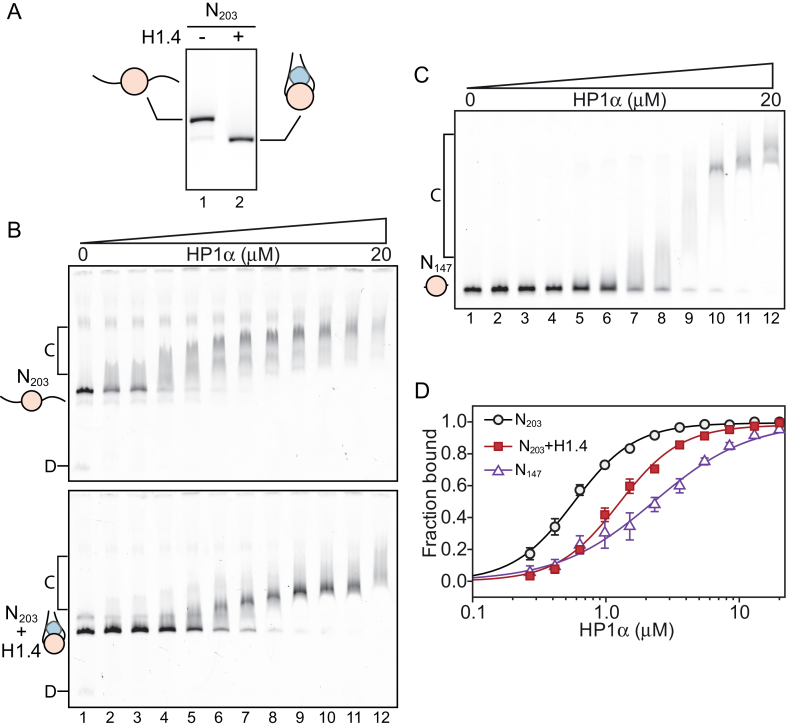
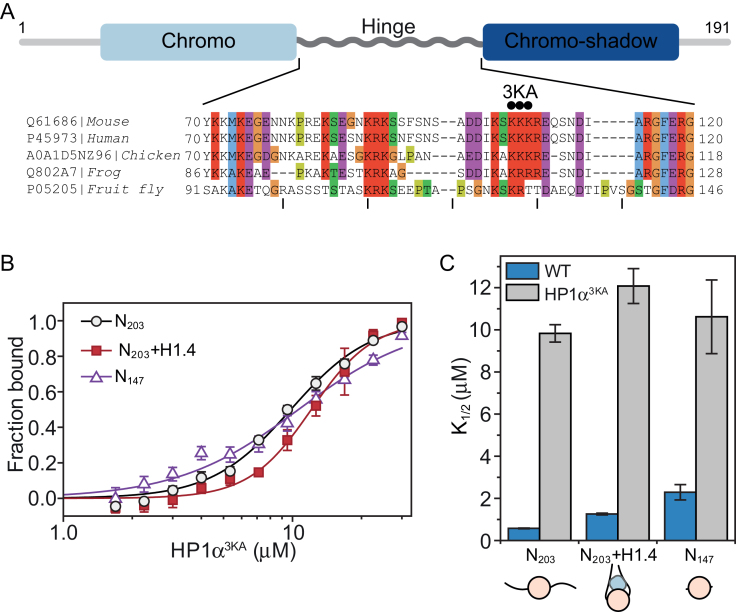
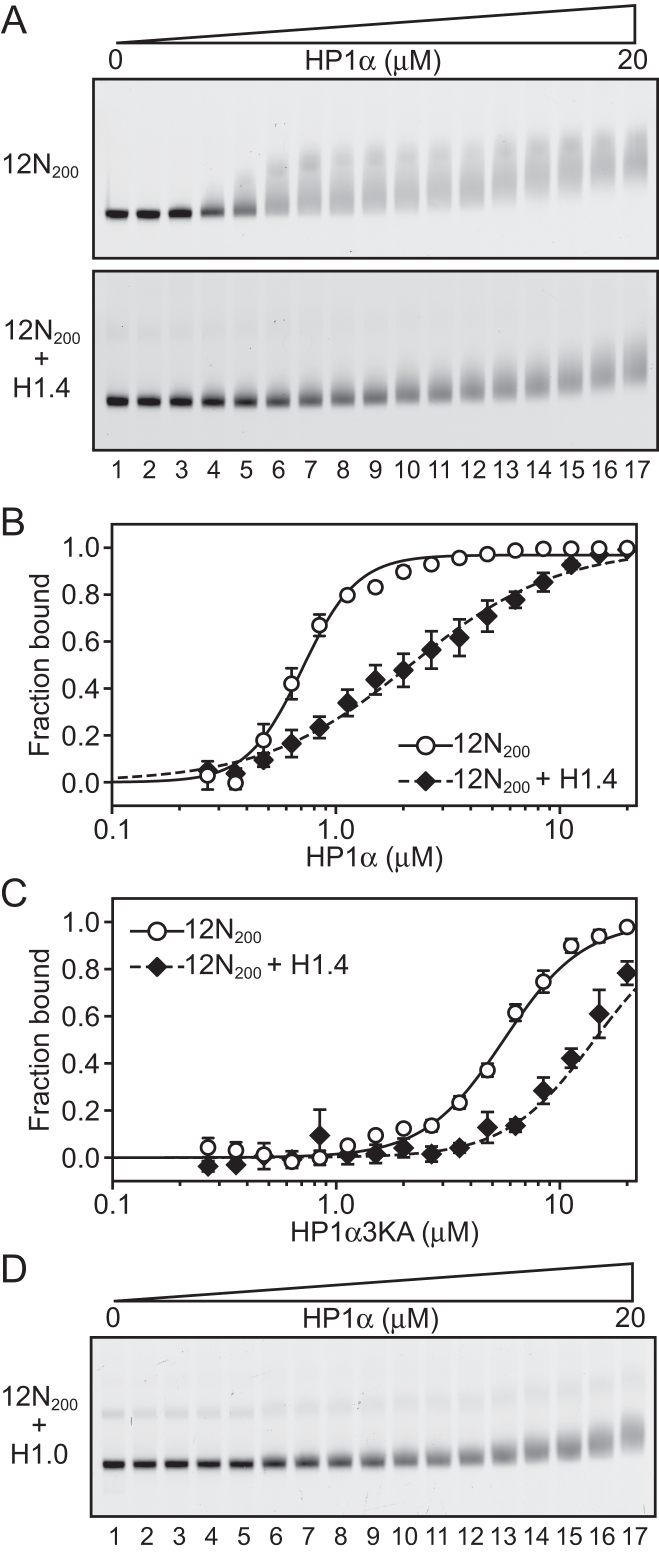
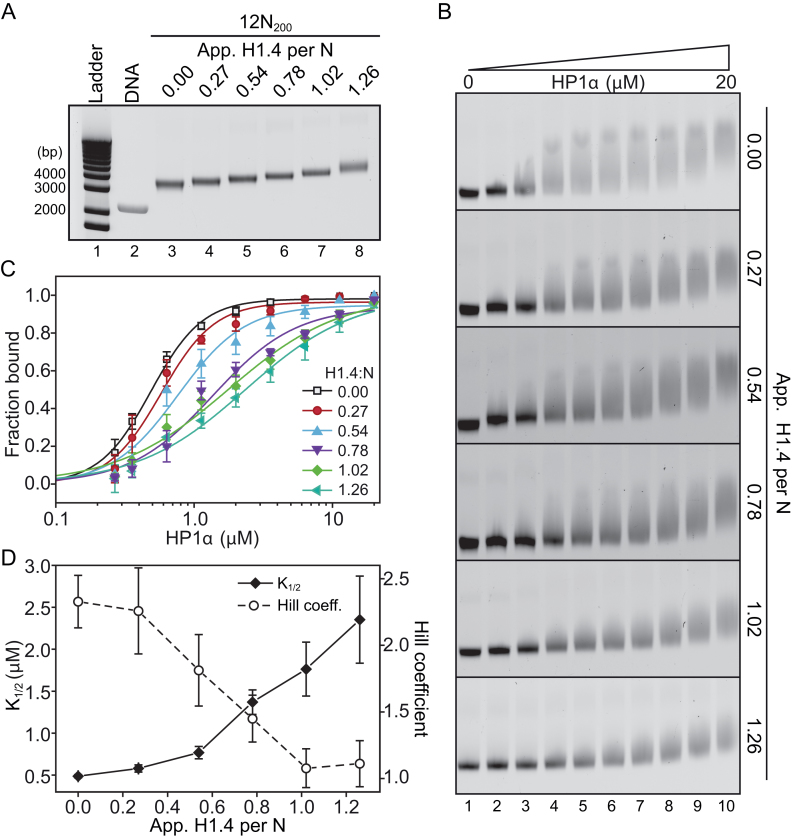
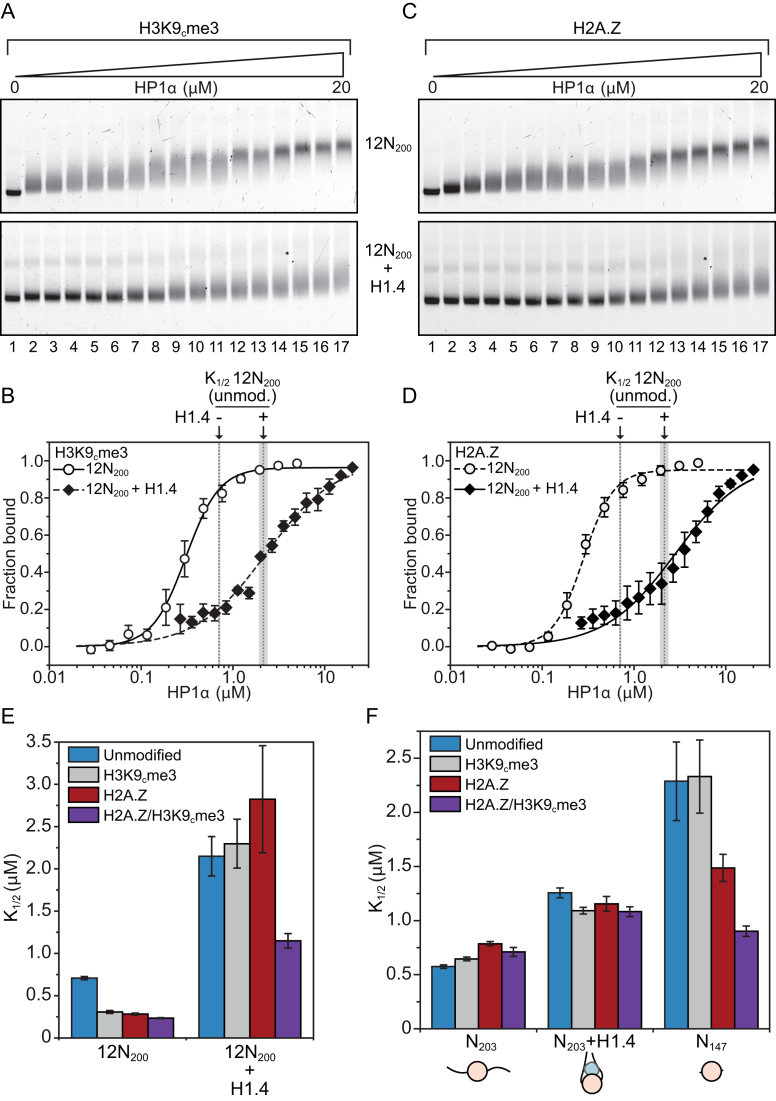
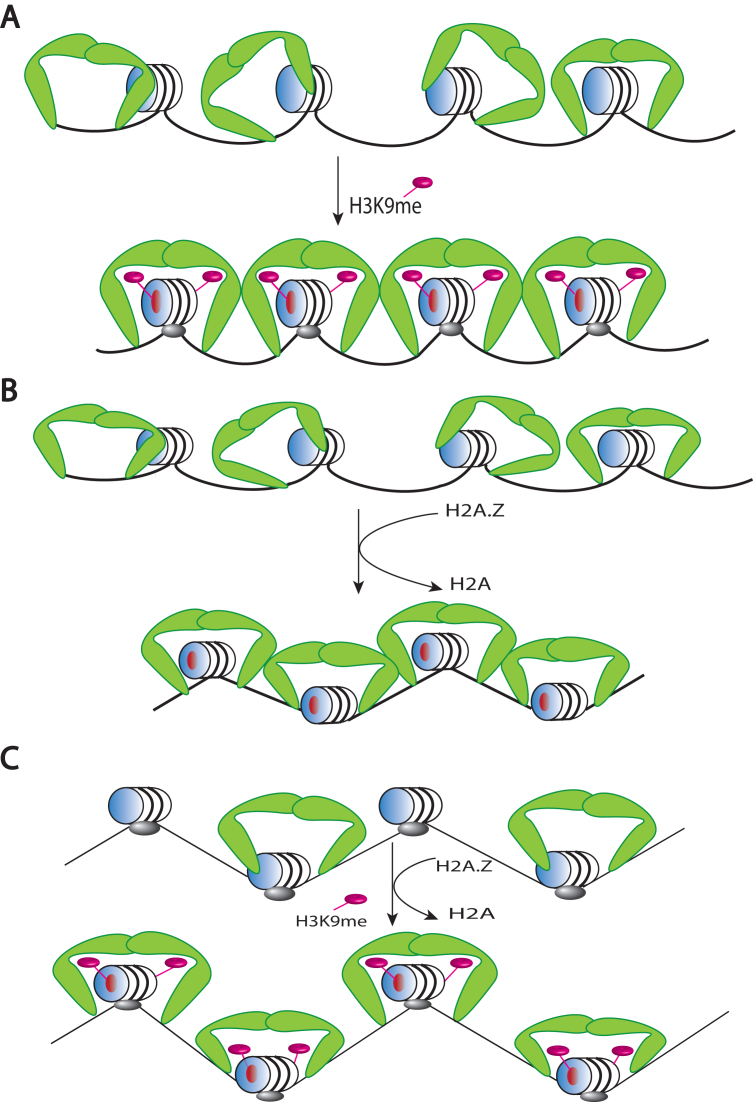
One of the most intensively studied chromatin binding factors is HP1α. HP1α is associated with silenced, heterochromatic regions of the genome and binds to H3K9me3. While H3K9me3 is necessary for HP1α recruitment to heterochromatin, it is becoming apparent that it is not sufficient suggesting that additional factors are involved. One candidate proposed as a potential regulator of HP1α recruitment is the linker histone H1.4. Changes to the underlying make-up of chromatin, such as the incorporation of the histone variant H2A.Z, has also been linked with regulating HP1 binding to chromatin. Here, we rigorously dissected the effects of H1.4, H2A.Z and H3K9me3 on the nucleosome binding activity of HP1α in vitro employing arrays, mononucleosomes and nucleosome core particles. Unexpectedly, histone H1.4 impedes the binding of HP1α but strikingly, this inhibition is partially relieved by the incorporation of both H2A.Z and H3K9me3 but only in the context of arrays or nucleosome core particles. Our data suggests that there are two modes of interaction of HP1α with nucleosomes. The first primary mode is through interactions with linker DNA. However, when linker DNA is missing or occluded by linker histones, HP1α directly interacts with the nucleosome core and this interaction is enhanced by H2A.Z with H3K9me3.


Figures

Figure 1.
Figure 1.
Linker histone H1.4 decreases affinity but not cooperativity of HP1α binding to mononucleosomes. (A) Native PAGE analysis of symmetric 203 bp mononucleosomes (N203) assembled in the absence (lane 1) or presence (lane 2) of a stoichiometric amount of linker histone H1.4. (B) EMSA analysis of HP1α (0–20 μM; 0.65× dilutions series) binding to N203 mononucleosomes. (C) EMSA analysis of HP1α binding to 147 bp nucleosome core particles (N147). HP1α concentrations are the same as those used in (B). (D) Quantitative analysis of EMSA experiments as shown in (B and C). Data (symbols) are the average of 3–4 replicates and error bars represent the S.E. Lines represent fits to the data using the Hill equation as described in the ‘materials and methods’.
Figure 2.
Figure 2.
The basic-rich hinge region of HP1α is critical for nucleosome binding. (A) Schematic of HP1α domain organization; the N-terminal chromo-domain is shown in light blue, the C-terminal chromoshadow domain in dark blue, and the hinge domain as a grey rippled line. Below, a multiple sequence alignment of the hinge region of HP1α proteins from distinct animal species. UniProt/UniRef accession numbers and organisms are shown on the left. The alignment is coloured according to the ClustalX colour scheme utilized in Jalview (68). The three black dots above the sequence indicate the sites of mutation in the triple lysine-to-alanine mutant HP1α3KA. (B) Binding isotherms (symbols) derived from quantitative EMSAs and corresponding fits (solid lines) for HP1α3KA binding to different mononucleosome species (black = N203; red = N203 + H1.4; purple = N147). Data are the average of a minimum of three replicate experiments and error bars represent the S.E. (C) Bar graph comparing relative affinity (Kformula image) values derived from the fits for HP1α3KA (grey bars) in (B) and wild-type HP1α (WT; blue bars) in Figure 1D. The corresponding mononucleosome species are shown along the bottom and are the same as those defined in Figure 1.
Figure 3.
Figure 3.
Linker histones inhibit binding of HP1α to nucleosome arrays. (A) EMSA analysis of HP1α (0–20 μM; 0.75 × dilution series) binding to 12 × 200 × 601 (12N200) nucleosome arrays (4.7 nM; effective nucleosome concentration is ∼ 56 nM) assembled in the absence (upper) or presence (lower) of recombinant linker histone H1.4. (B) Quantitative analysis of EMSA experiments as shown in (A). Data are the average of three replicates and error bars represent the standard error (s.e.). Lines represent fits to the data using the Hill equation as described in the ‘materials and methods’. (C) EMSA-derived binding isotherms for HP1α3KA binding to 12N200 arrays in the absence (hollow circles) or presence of H1.4 (black diamonds). Lines represent fits to the data as per (B). (D) EMSA analysis of HP1α (0–20 μM; 0.75× dilution series) binding to 12N200 nucleosome arrays assembled in the presence of recombinant linker histone H1.0 (12N200 + H1.0).
Figure 4.
Figure 4.
Linker histone stoichiometry modulates HP1α binding to nucleosome arrays. (A) Representative native agarose gel of 12N200 arrays assembled with increasing amounts of linker histone H1.4. The apparent number of H1.4 molecules per nucleosome is displayed along the top of the gel. Sizes of select DNA ladder bands in lane 1 are indicated on the left. The band in lane 2 corresponds to the naked 12N200 DNA. (B) Representative EMSAs of HP1α (0–20 μM; 0.56x dilution series) binding to nucleosome arrays with varying levels of H1.4 as shown in (A). (C) Quantitative analysis of EMSA experiments as shown in (B). Data (symbols) are the average of four replicates and error bars represent the s.e. Lines represent fits to the data using the same binding model as in Figures 1 and 3. (D) Relative affinity (Kformula image; left axis, solid diamonds, black line) and cooperativity (Hill coefficient; right axis, hollow circles, dashed line) values extracted from each of the fits shown in (C).
Figure 5.
Figure 5.
Methylation of H3K9 and H2A.Z modulate the binding of HP1α to nucleosomes. (A) EMSA analysis of HP1α (0–20 μM; 0.75× dilution series) binding to H3K9cme3 12N200 nucleosome arrays (4.7 nM; effective nucleosome concentration is ∼56 nM) assembled in the absence (upper) or presence (lower) of recombinant linker histone H1.4. (B) Quantitative analysis of EMSA experiments as shown in (A). Data are the average of three replicates and error bars represent the s.e. Lines represent fits to the data using the same binding model used in previous figures. For comparison, the positions of the Kformula image values for HP1α binding to unmodified 12N200 arrays in the absence (0.71 μM) or presence (2.15 μm) of H1.4 are indicated by the dashed grey lines (as determined in the fits in Figure 3B; flanking area shaded in light grey indicate the s.e.). (C) EMSA analysis of HP1α (0–20 μM; 0.75× dilution series) binding to 12N200 nucleosome arrays containing histone variant H2A.Z, conditions are identical to those in (A). (D) Quantitative analysis of EMSA experiments as shown in (C). Analysis is identical to that described in (B). (E) Bar graph comparing relative affinity (Kformula image) values derived from quantitative of EMSAs of HP1α binding to 12N200 ± H1.4 that contain either unmodified histones (blue), H3K9cme3 (grey), H2A.Z (red), or both H2A.Z and H3K9cme3 (purple). Data are derived from a minimum of three replicates for each binding experiment. Errors bars represent the S.E. (F) Bar graph comparing relative affinity (Kformula image) values derived from quantitative of EMSAs of HP1α binding to different mononucleosome substrates (N203, N203 + H1.4, and N147) that contain either unmodified histones (blue), H3K9cme3 (grey), H2A.Z (red), or both H2A.Z and H3K9cme3 (purple). Data are derived from a minimum of three replicates for each binding experiment. Errors bars represent the S.E.
Figure 6.
Figure 6.
A model for the interaction of HP1α with chromatin and the role of H2A.Z, H3K9me3 and histone H1. (A) HP1α (green boomerangs) binds chromatin promiscuously to a nucleosomal array because of its strong affinity for DNA. On the other hand, the incorporation of H3K9me3 facilitates the proper orientation of HP1α on the nucleosome (via the H3K9me3-chromodomain interaction) to promote cooperative HP1α-HP1α interactions along the array. (B) H2A.Z mimics H3K9me3 in promoting cooperative HP1α-HP1α interactions via HP1α–acidic patch interactions (red circle on the face of the nucleosome). Note that the incorporation of H2A.Z promotes array compaction (represented by the zigzag conformation. (C) Histone H1 (which also promotes array compaction) inhibits both the affinity of binding of HP1α to nucleosomes and cooperative HP1α-HP1α interactions. H2A.Z and H3K9me3 can partially overcome the reduced HP1α binding affinity but cannot restore cooperative HP1α-HP1α interactions.

Similar articles

Cited by

References

    1. Luger K., Dechassa M.L., Tremethick D.J.. New insights into nucleosome and chromatin structure: an ordered state or a disordered affair. Nat. Rev. Mol. Cell Biol. 2012; 13:436–447. - PMC - PubMed
    1. Dixon J.R., Selvaraj S., Yue F., Kim A., Li Y., Shen Y., Hu M., Liu J.S., Ren B.. Topological domains in mammalian genomes identified by analysis of chromatin interactions. Nature. 2012; 485:376–380. - PMC - PubMed
    1. Roadmap Epigenomics C., Kundaje A., Meuleman W., Ernst J., Bilenky M., Yen A., Heravi-Moussavi A., Kheradpour P., Zhang Z., Wang J. et al. . Integrative analysis of 111 reference human epigenomes. Nature. 2015; 518:317. - PMC - PubMed
    1. Filion G.J., van Bemmel J.G., Braunschweig U., Talhout W., Kind J., Ward L.D., Brugman W., de Castro I.J., Kerkhoven R.M., Bussemaker H.J. et al. . Systematic protein location mapping reveals five principal chromatin types in Drosophila cells. Cell. 2010; 143:212–224. - PMC - PubMed
    1. Sexton T., Yaffe E., Kenigsberg E., Bantignies F., Leblanc B., Hoichman M., Parrinello H., Tanay A., Cavalli G.. Three-dimensional folding and functional organization principles of the Drosophila genome. Cell. 2012; 148:458–472. - PubMed

Publication types

MeSH terms

LinkOut - more resources