. 2018 Jul 10;24(2):489-502.
doi: 10.1016/j.celrep.2018.06.027.

Genome-wide CRISPR-KO Screen Uncovers mTORC1-Mediated Gsk3 Regulation in Naive Pluripotency Maintenance and Dissolution

Affiliations

Genome-wide CRISPR-KO Screen Uncovers mTORC1-Mediated Gsk3 Regulation in Naive Pluripotency Maintenance and Dissolution

Meng Li et al. Cell Rep. .

Abstract

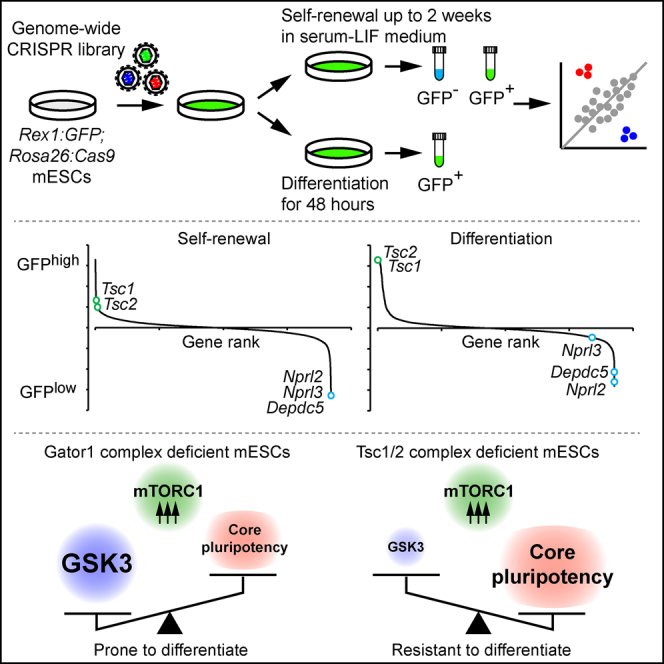
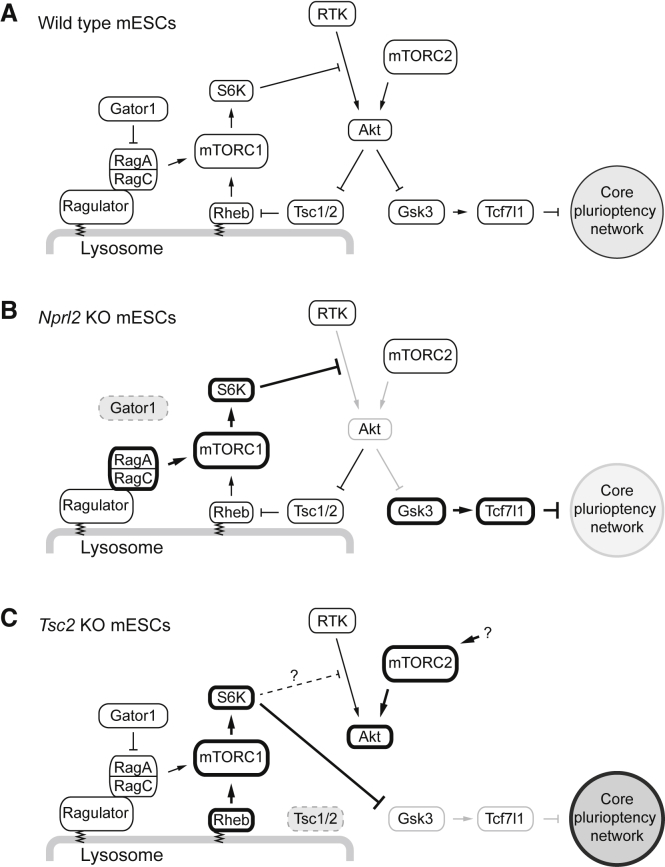
The genetic basis of naive pluripotency maintenance and loss is a central question in embryonic stem cell biology. Here, we deploy CRISPR-knockout-based screens in mouse embryonic stem cells to interrogate this question through a genome-wide, non-biased approach using the Rex1GFP reporter as a phenotypic readout. This highly sensitive and efficient method identified genes in diverse biological processes and pathways. We uncovered a key role for negative regulators of mTORC1 in maintenance and exit from naive pluripotency and provided an integrated account of how mTORC1 activity influences naive pluripotency through Gsk3. Our study therefore reinforces Gsk3 as the central node and provides a comprehensive, data-rich resource that will improve our understanding of mechanisms regulating pluripotency and stimulate avenues for further mechanistic studies.

Keywords: Akt; CRISPR; GATOR1; Nprl2; Tsc2; exit from pluripotency; mTORC1; mTORC2; naive pluripotency; screening.


Figures

None
Graphical abstract
Figure 1
Figure 1
CRISPR-KO Screen in Maintenance of Naive Pluripotency (A) Screening strategy for maintenance of naive pluripotency. Lentivirus used expresses blue fluorescent protein (BFP), and transduced cells were thus enriched on day 2 by sorting. For mESCs in SL, gRNA abundance in sorted GFP+ and GFP− populations was analyzed. (B and C) Screen summaries as ranked DE score plots for day 8 (B) and day 15 (C) by comparing GFP+ and GFP− populations. (D) Validation of newly identified genes. (E and F) Differentiation trajectory (Figure S2) identified potential involvement of the negative elongation factor in naive pluripotency maintenance. (E) Validation experiment was performed with 2 gRNAs each for Nelfb and Nelfcd, together with a gRNA targeting Stat3 as a positive control (F). (G) Comparison of the screen results between GFP+ cells in SL and the cells in 2iL. Green and blue dots indicate genes enriched or depleted in cells in 2iL. (H) GO terms overrepresented in processes specifically required in mESCs cultured in 2iL. Data are shown as mean ± SD. (D and F) n = 3. Student’s t test was performed. p ≤ 0.05. See also Figures S1 and S2.
Figure 2
Figure 2
CRISPR-KO Screen in Exit from Naive Pluripotency (A) Screening strategy for exit from naive pluripotency. (B) Screen summary shown as a ranked DE score plot. (C–E) GSEA for a gene set identified by a siRNA screen (Betschinger et al., 2013) (C) and a set of genes identified in positive (D) and negative (E) selection from our self-renewal screen (GFP+:GFP−) on day 15. NES, normalized enrichment score. (F) Comparison of DE scores between self-renewal (day 15) and differentiation screens. Although there are correlations as observed in (D) and (E), most genes identified in exit from pluripotency do not have a major impact on Rex1GFP heterogeneity in maintenance culture. See also Figures S1 and S3.
Figure 3
Figure 3
Genes Identified in the CRISPR-KO Screen for Exit from Naive Pluripotency Genes with known functions are placed in pathways, protein complexes, or cellular compartments. When genes with redundant function are present, these genes are boxed in black. Defined protein complexes are boxed in blue. Not all components are shown for protein complexes. See also Figure S4.
Figure 4
Figure 4
Gator1 and Tsc2 Loss Exhibit Opposing Phenotype on Naive Pluripotency Network Resolution (A) Schematic of mTORC1 regulators. (B and C) Ranked DE score plots from the self-renewal (B) and differentiation (C) screens, highlighting opposing phenotypes between Tsc1/2 and Gator1. (D) Maintenance of naive pluripotency measured as a percentage of Rex1GFP+ cells in the SL condition (left panel) and the 2iL condition (right panel). (E) Reacquisition of naive pluripotency. (F and G) RexGFP profiles of indicated KO mESCs after 27 hr differentiation for Gator1 (F) and Tsc1/2 (G) complex. Tcf7l1 KO mESCs were used as a positive control. (H) Commitment assay. (I–K) qRT-PCR analysis of differentiating wild-type, Nprl2 KO mESCs, and Tsc2 KO mESCs at the indicated days. Selected naive (I and J) and formative (K) markers were analyzed. Day 1 data are summarized in (J). Expression was normalized to day 0 wild-type expression, from which log10(fold change) were calculated. Data are shown as mean ± SD. (D, E, and I–K) n = 3. Student’s t test was performed. p ≤ 0.05; ∗∗p ≤ 0.01. See also Figures S4 and S5.
Figure 5
Figure 5
Gsk3 Is Differentially Affected by mTORC1 Upregulation upon Nprl2 and Tsc2 Loss (A) Western blot analysis of key phosphorylation sites in the Akt-mTORC1 pathway. (B) Quantification of the phospho-Gsk3β level. (C) Percentage of Rex1GFP+ cells in response to reducing the dose of CHIR992021 in wild-type and Nprl2 KO mESCs. (D) Restabilization of naive pluripotency by rapamycin in Nprl2 KO mESCs. (E) Restoration of differentiation in Nprl2 KO mESCs by rapamycin. (F) Phosphorylation profile in Tsc2 KO mESCs with or without Rictor KO. (G) Akt kinase assay. (H) Rex1GFP profile of indicated KO mESCs after 27 hr differentiation. (I) Full restoration of differentiation in both Tsc2 sKO and Tsc2/Rictor dKO mESCs by rapamycin. Data are shown as mean ± SD. (B and D) n = 3. Student’s t test was performed. p ≤ 0.05; ∗∗p ≤ 0.01. See also Figures S4 and S5.
Figure 6
Figure 6
Transcriptome Profile in Nprl2 and Tsc2 KO mESCs (A) Depletion-enrichment sequencing (DE-seq) output of differentially expressed genes in Nprl2 and Tsc2 KO mESCs compared to wild-type. Genes with FDR < 0.05 were highlighted with black dots, and selected pluripotency markers were highlighted in red. (B) Expression profile of general, naive, and primed pluripotency marker genes. Primed markers were upregulated in Nprl2 KO mESCs, while naive markers were substantially upregulated in Tsc2 KO mESCs. (C and D) Comparison of fold changes between Tsc2 and Nprl2 KO mESCs. Genes that were significantly (FDR < 0.05) up- or downregulated in either or both KO mESCs were highlighted in red. (D). Gene ontology analysis of genes highlighted in each quadrant in (C).
Figure 7
Figure 7
Models of mTORC1-Mediated Gsk3 Regulation in Each Genotype (A) In wild-type cells, receptor tyrosine kinase (RTK)-mediated activation of Akt and the mTORC1-mediated negative feedback are in equilibrium, maintaining appropriate Gsk3 activity level. (B) Nprl2 loss increases mTORC1 activity and shows stronger negative feedback, resulting in Gsk3 upregulation. (C) Tsc2 loss also increases mTORC1 activity, but upregulated S6K directly phosphorylates and consequently inactivates Gsk3 (Zhang et al., 2006). mTORC2 is upregulated in the absence of Tsc2 protein in mESCs.

Similar articles

Cited by

References

    1. Adli M. The CRISPR tool kit for genome editing and beyond. Nat. Commun. 2018;9:1911. - PMC - PubMed
    1. Bar-Peled L., Chantranupong L., Cherniack A.D., Chen W.W., Ottina K.A., Grabiner B.C., Spear E.D., Carter S.L., Meyerson M., Sabatini D.M. A tumor suppressor complex with GAP activity for the Rag GTPases that signal amino acid sufficiency to mTORC1. Science. 2013;340:1100–1106. - PMC - PubMed
    1. Batista P.J., Molinie B., Wang J., Qu K., Zhang J., Li L., Bouley D.M., Lujan E., Haddad B., Daneshvar K. m(6)A RNA modification controls cell fate transition in mammalian embryonic stem cells. Cell Stem Cell. 2014;15:707–719. - PMC - PubMed
    1. Bechard M., Dalton S. Subcellular localization of glycogen synthase kinase 3beta controls embryonic stem cell self-renewal. Mol. Cell. Biol. 2009;29:2092–2104. - PMC - PubMed
    1. Betschinger J., Nichols J., Dietmann S., Corrin P.D., Paddison P.J., Smith A. Exit from pluripotency is gated by intracellular redistribution of the bHLH transcription factor Tfe3. Cell. 2013;153:335–347. - PMC - PubMed

Publication types

MeSH terms

Substances