. 2018 Aug;560(7716):128-132.
doi: 10.1038/s41586-018-0308-7. Epub 2018 Jul 11.

Structures of human Patched and its complex with native palmitoylated sonic hedgehog

Affiliations

Structures of human Patched and its complex with native palmitoylated sonic hedgehog

Xiaofeng Qi et al. Nature. 2018 Aug.

Abstract

Hedgehog (HH) signalling governs embryogenesis and adult tissue homeostasis in mammals and other multicellular organisms1-3. Whereas deficient HH signalling leads to birth defects, unrestrained HH signalling is implicated in human cancers2,4-6. N-terminally palmitoylated HH releases the repression of Patched to the oncoprotein smoothened (SMO); however, the mechanism by which HH recognizes Patched is unclear. Here we report cryo-electron microscopy structures of human patched 1 (PTCH1) alone and in complex with the N-terminal domain of 'native' sonic hedgehog (native SHH-N has both a C-terminal cholesterol and an N-terminal fatty-acid modification), at resolutions of 3.5 Å and 3.8 Å, respectively. The structure of PTCH1 has internal two-fold pseudosymmetry in the transmembrane core, which features a sterol-sensing domain and two homologous extracellular domains, resembling the architecture of Niemann-Pick C1 (NPC1) protein7. The palmitoylated N terminus of SHH-N inserts into a cavity between the extracellular domains of PTCH1 and dominates the PTCH1-SHH-N interface, which is distinct from that reported for SHH-N co-receptors8. Our biochemical assays show that SHH-N may use another interface, one that is required for its co-receptor binding, to recruit PTCH1 in the absence of a covalently attached palmitate. Our work provides atomic insights into the recognition of the N-terminal domain of HH (HH-N) by PTCH1, offers a structural basis for cooperative binding of HH-N to various receptors and serves as a molecular framework for HH signalling and its malfunction in disease.


Conflict of interest statement

Competing interests The authors declare no competing interests.

Figures

Extended Data Fig. 1
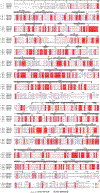
Extended Data Fig. 1. Sequence alignment of human Ptch1 and Ptch2, mouse Ptch1 and Drosophila Ptch.
The residue numbers of hPtch1 are indicated above the protein sequence. The transmembrane helices and secondary structures of ECDs are labeled (structural elements of ECD-II with asterisk). Residues under the dashed lines are excluded from the 3D reconstruction.
Extended Data Fig. 2
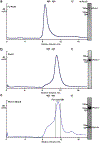
Extended Data Fig. 2. Biochemical properties of expressed human Ptch1 proteins.
a, Size-exclusion chromatogram and SDS-PAGE gel of the purified full-length Ptch1. b, Size-exclusion chromatogram and SDS-PAGE gel of the purified Ptch1*. c, Size-exclusion chromatogram and SDS-PAGE gel of the purified Ptch1*–Shh-N complex. Molecular standards indicated on left side of SDS-PAGE gels and above the elution curves. The assays were reproduced at least three times with the similar results.
Extended Data Fig. 3
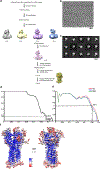
Extended Data Fig. 3. Data processing and model quality assessment of Ptch1*.
a, The data processing work-flow for Ptch1*. b, A representative electron micrograph at defocus −2.0 µm. c, 2D classification. d, Fourier shell correlation (FSC) curve of the structure with FSC as a function of resolution using Frealign output. e, The FSC curves calculated between the refined structure and the half map used for refinement, the other half map, and the full map. f, Density maps of Ptch1* structure colored by local resolution estimation using blocres.
Extended Data Fig. 4
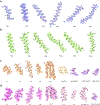
Extended Data Fig. 4. Electron microscopy density of different portions of Ptch1* at 5σ level.
a, TMs 1–6. b, TMs 7–12. c, ECD-I. d, ECD-II. NAG denotes N-Acetylglucosamine.
Extended Data Fig. 5
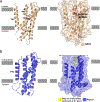
Extended Data Fig. 5. NPC1 and Patched SSD structural and surface comparison.
a, NPC1-SSD. The putative pocket (indicated by red arrow) in the SSD is created by TMs 3–5. b, Patched-SSD.
Extended Data Fig. 6
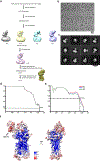
Extended Data Fig. 6. Data processing and model quality assessment of Ptch1*–Shh-N.
a, The data processing work-flow for Ptch1*–Shh-N. b, A representative electron micrograph at defocus −2.0 µm. c, 2D classification. d, Fourier shell correlation (FSC) curve of the structure with FSC as a function of resolution using Frealign output. e, The FSC curves calculated between the refined structure and the half map used for refinement, the other half map, and the full map. f, Density maps of Ptch1*–Shh-N structure colored by local resolution estimation using blocres.
Extended Data Fig. 7
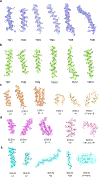
Extended Data Fig. 7. Electron microscopy density of different portions of Ptch1*–Shh-N complex.
a, TMs 1–6 at 5σ level. b, TMs 7–12 at 5σ level. c, Major structural elements of ECD-I at 4.5σ level, d, Major structural elements of ECD-II at 4.5σ level. e, Major structural elements of Shh-N at 4.5σ level; PLM at 3σ level.
Extended Data Fig. 8
Extended Data Fig. 8. Ptch1*–Shh-N binding assay in detergent-free system.
a, Size-exclusion chromatogram and SDS-PAGE gel of the purified Ptch1* with Amphipol A8–35 in buffer A. Molecular standards indicated on left side of SDS-PAGE gels and above the elution curves. b, 5E1 does not compete with the binding of native Shh-N to Ptch1*. 5E1 and Shh-N at a 1:1 molar ratio were incubated with Ptch1*– immobilized Flag-M2 resin; the complex was eluted by Flag-peptide. Protein was detected by Coomassie-staining. The assay was reproduced three times with the similar results.
Fig. 1
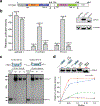
Fig. 1. The engineered human Ptch1 protein binds Shh-N ligand.
a, Primary structure of Ptch1. Residues 619–720 and 1189–1447 were removed in Ptch1*. b, Hh signaling in Ptch1−/− MEFs transfected with Ptch1 or Ptch1* and response to wild-type or mutant Shh-N ligand via luciferase activity. Shh-N in conditioned medium and transiently expressed Ptch1 were detected by western blotting. c, Pull-down assay of his-tagged Shh-N or native Shh-N with Ptch1* at different molar ratios detected by Coomassie-staining. The assay was reproduced three times with the similar results. d, Palmitoylated Shh-N stimulates Hh signaling but unmodified Shh-N does not. Shh-Light II cells were treated with various concentrations of Shh-N varients, and Hh signaling was measured using luciferase activity. Data (panels b and d) are mean ± s.d. (n=3).
Fig. 2
Fig. 2. Overall structure of Ptch1*.
a, Ribbon representation of the structure horizontal to the membrane. Flexible linkers are indicated by dots. b, Structural comparison of transmembrane domains of Ptch1* and NPC1 (pdb code: 5U74) viewed from extracellular side. c, Structural comparison of transmembrane domains of Ptch1* and AcrB trimer (pdb code: 1IWG). One subunit of AcrB is yellow, while the rest are gray. d, SSD comparison of Ptch1* and NPC1 (pdb code: 5U74) in a similar view as the right panel of a. Red arrows indicate shifted helices. Surface representation of the unidentified molecule in yellow. e, Overall structure of ECD-I and ECD-II. f, Interface between ECD-I and ECD-II. Hydrophilic interactions are indicated by dots and residues colored as in panel e.
Fig. 3
Fig. 3. Structure of Ptch1*–Shh-N complex.
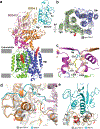
a, Ribbon representation of the structure horizontal to the membrane with Ptch1* colored as in Fig. 2 and Shh-N colored in cyan. An Shh-N bound zinc atom is indicated by a gray sphere. Putative endogenous molecules from the cryo-EM density map are shown at 5σ level in red mesh. b, Structural comparison of the membrane domains of apo-Ptch1* (gray) and Ptch1*–Shh-N (colored). c, The palmitate-binding site. d, Interface between Np of Shh-N and ECD-I compared with apo-Ptch1*. e, Secondary interface between Shh-N and ECD-I subdomain 2 compared with apo-Ptch1*. Red arrows represent structural shifts.
Fig. 4
Fig. 4. The palmitoylated N-terminus of Shh-N dominates its interface to Ptch1*.
a, The palmitoylated N-terminus of Shh-N is important for Ptch1* binding. A 2:1 Ptch1*:Shh-N molar ratio was used for assays. b, Calcium facilitates the binding between Ptch1 and N-terminal tagged Shh-N. c, Complex of Shh-N and 5E1 (pdb code: 3MXW), with interaction areas on Shh-N in red. Calcium in the interface are indicated by green balls. d, 5E1 blocks the binding of Ptch1* to His-tagged Shh-N but not to native Shh-N. e, Mutagenesis of the secondary interface of Shh-N. f, Mutagenesis of the interface of Ptch1*. The assays (panels a, b, d, e and f) were reproduced three times with the similar results. g, Repression of Hh signaling by Ptch1-AAAA and its response to Shh-N ligand. Shh-N in conditioned medium was shown in Fig. 1d. Hh activity was measured by luciferase assay and data are mean ± s.d. (n=3). The protein was detected by Coomassie-staining (panel a, b and d) or by western blotting (panels e, f and g).
Fig. 5
Fig. 5. Putative multivalent complex of Shh-N with Ptch1 and its co-receptors.
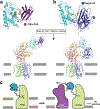
a, Complex of Shh-N and Cdo-Fn3 (pdb code: 3D1M) with interaction areas on Shh-N in red. b, Complex of Shh-N and Ihog-Fn3 (pdb code: 2IBG) with interaction areas on Shh-N in red. Hypothetical model of Ptch1*–Shh-N–Cdo complex or Ptch1*–Shh-N-Ihog complex was generated by docking Shh-N-Cdo-Fn3 or Shh-N-Ihog-Fn3 to the Ptch1*– Shh-N structure. c, Model of putative collaboration between Shh-N–Ptch1 and co-receptors or Ptch itself in Hh signaling.

Similar articles

Cited by

References

    1. Ingham PW & McMahon AP Hedgehog signaling in animal development: paradigms and principles. Genes & development 15, 3059–3087, doi:10.1101/gad.938601 (2001). - DOI - PubMed
    1. Jiang J & Hui CC Hedgehog signaling in development and cancer. Developmental cell 15, 801–812, doi:10.1016/j.devcel.2008.11.010 (2008). - DOI - PMC - PubMed
    1. Briscoe J & Therond PP The mechanisms of Hedgehog signalling and its roles in development and disease. Nature reviews. Molecular cell biology 14, 416–429, doi:10.1038/nrm3598 (2013). - DOI - PubMed
    1. Hooper JE & Scott MP Communicating with Hedgehogs. Nature reviews. Molecular cell biology 6, 306–317, doi:10.1038/nrm1622 (2005). - DOI - PubMed
    1. Taipale J & Beachy PA The Hedgehog and Wnt signalling pathways in cancer. Nature 411, 349–354, doi:10.1038/35077219 (2001). - DOI - PubMed

Publication types

LinkOut - more resources