. 2018 Aug;50(8):1140-1150.
doi: 10.1038/s41588-018-0156-2. Epub 2018 Jul 9.

Genetic determinants of co-accessible chromatin regions in activated T cells across humans

Affiliations

Genetic determinants of co-accessible chromatin regions in activated T cells across humans

Rachel E Gate et al. Nat Genet. 2018 Aug.

Abstract

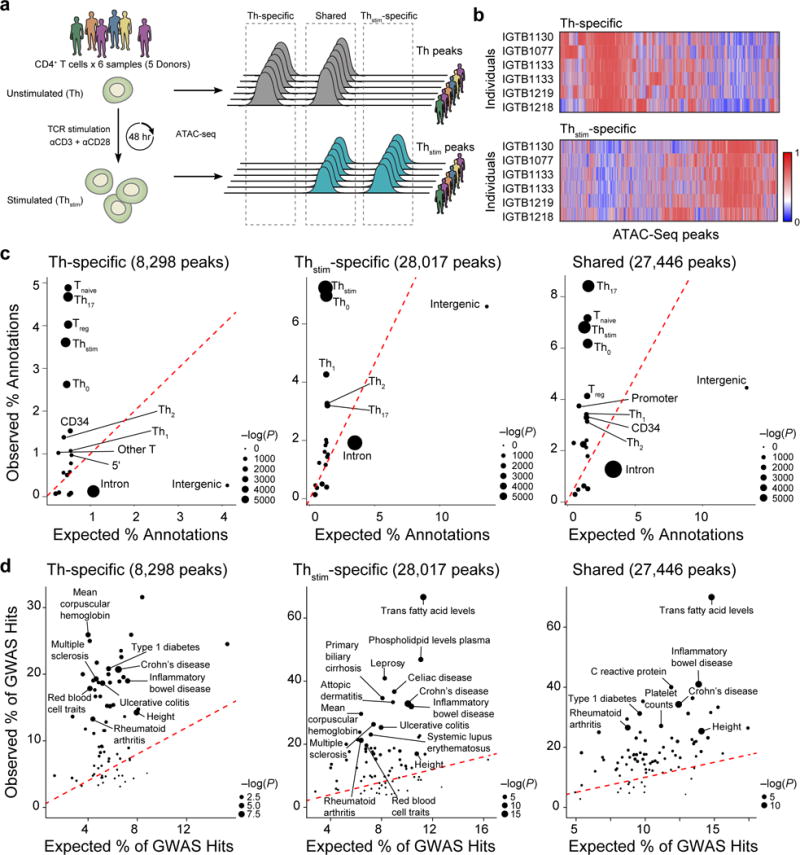
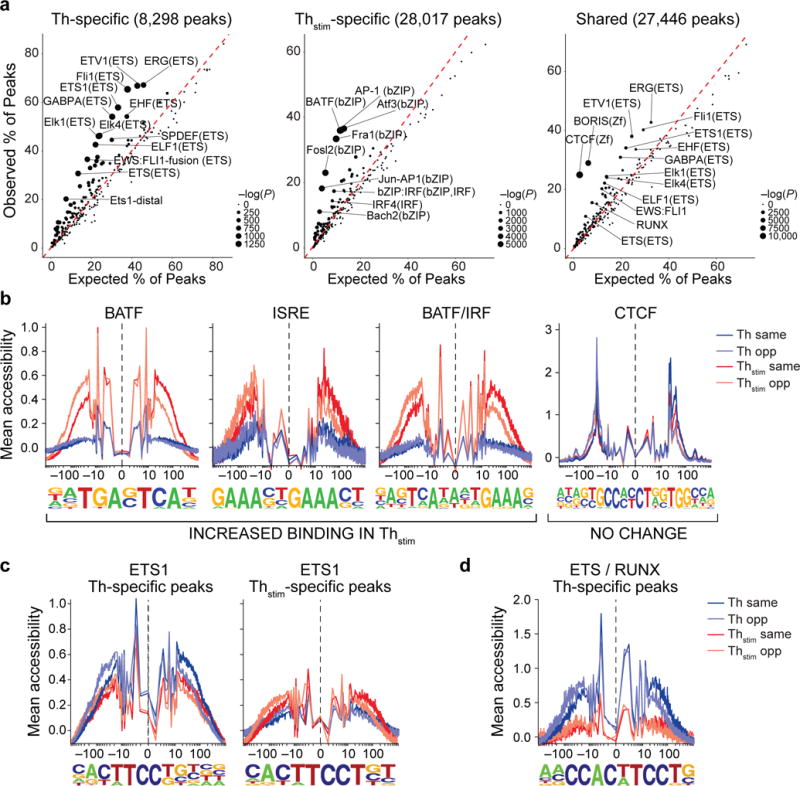
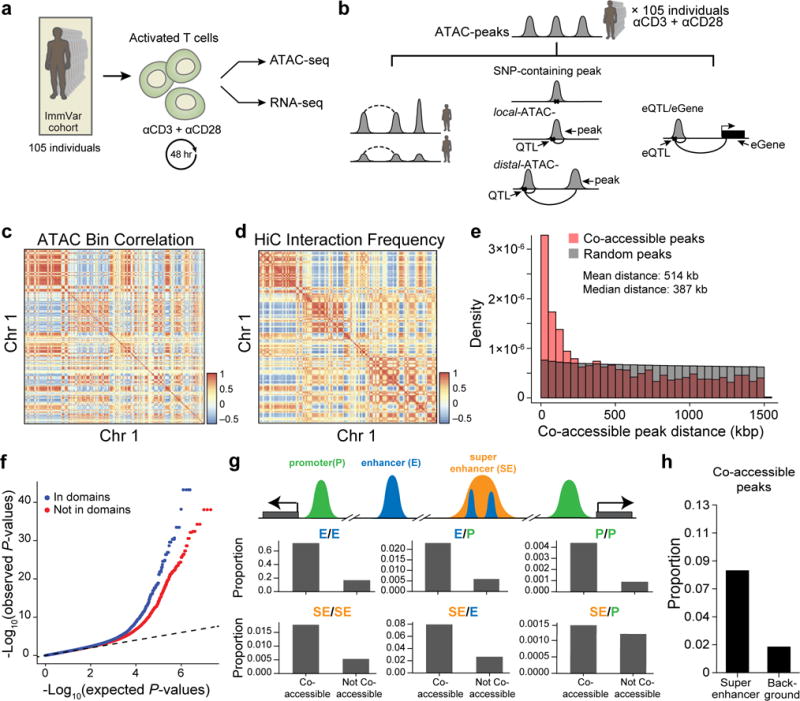
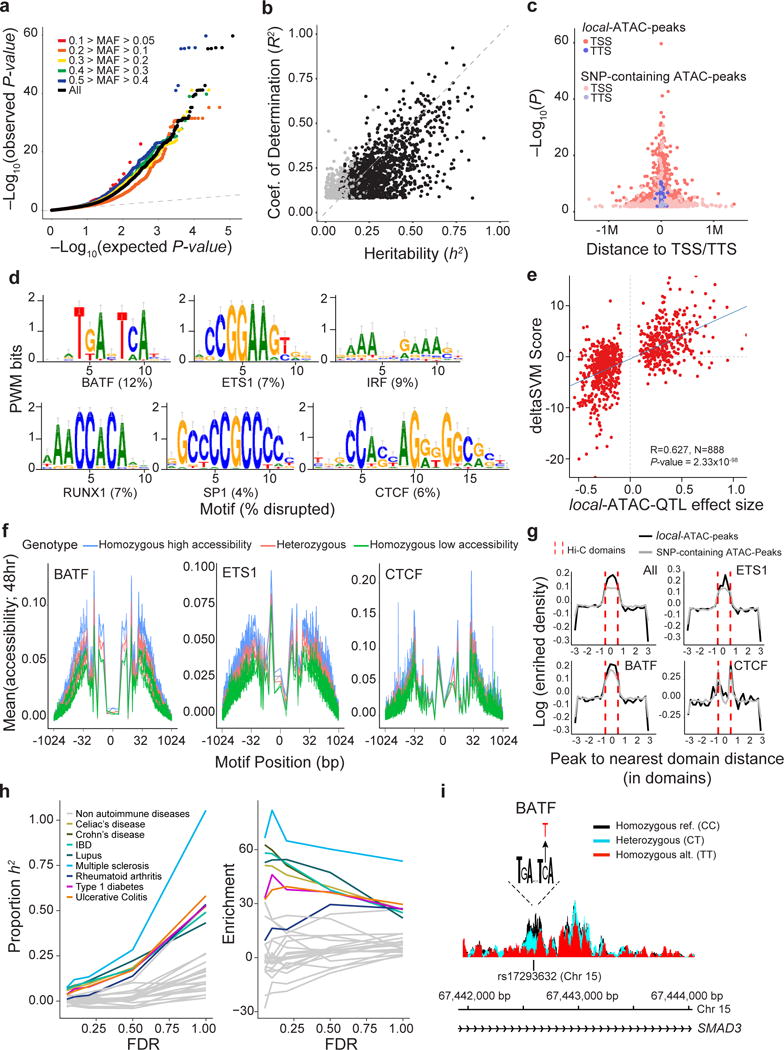
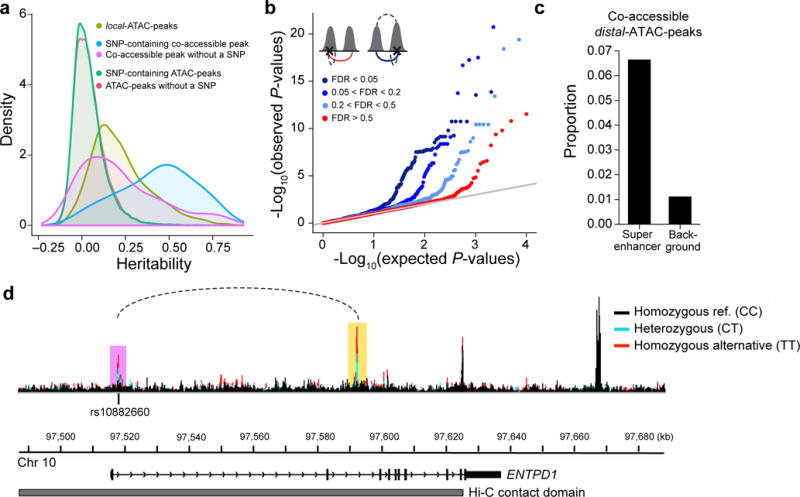
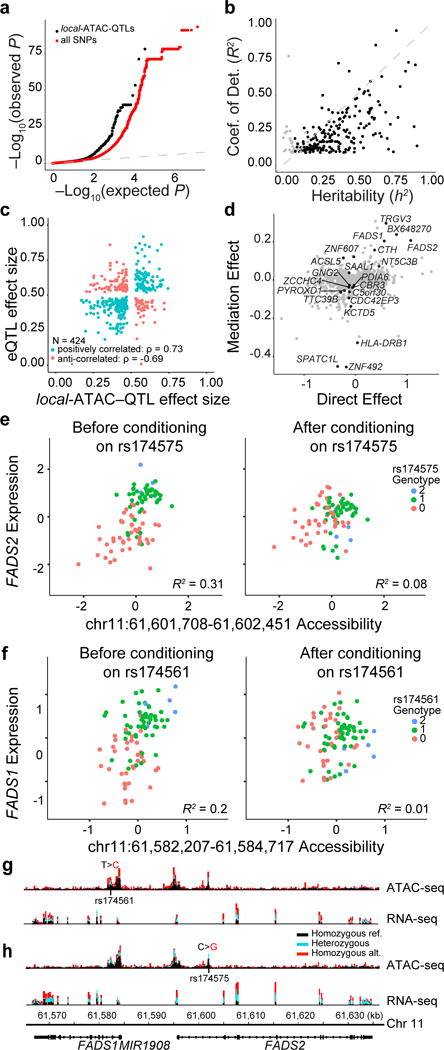
Over 90% of genetic variants associated with complex human traits map to non-coding regions, but little is understood about how they modulate gene regulation in health and disease. One possible mechanism is that genetic variants affect the activity of one or more cis-regulatory elements leading to gene expression variation in specific cell types. To identify such cases, we analyzed ATAC-seq and RNA-seq profiles from stimulated primary CD4+ T cells in up to 105 healthy donors. We found that regions of accessible chromatin (ATAC-peaks) are co-accessible at kilobase and megabase resolution, consistent with the three-dimensional chromatin organization measured by in situ Hi-C in T cells. Fifteen percent of genetic variants located within ATAC-peaks affected the accessibility of the corresponding peak (local-ATAC-QTLs). Local-ATAC-QTLs have the largest effects on co-accessible peaks, are associated with gene expression and are enriched for autoimmune disease variants. Our results provide insights into how natural genetic variants modulate cis-regulatory elements, in isolation or in concert, to influence gene expression.


Conflict of interest statement

Competing Interest: A.R. is an SAB member of ThermoFisher Scientific, Syros Pharmaceuticals and Driver group and a founder of Celsius Therapeutics.

Figures

Figure 1
Figure 1. Changes in chromatin state in human T cell activation
(a) Experimental overview (left) and schematic of nomenclature (right). (b) Differential chromatin accessibility. Regions of open chromatin (columns) in six samples (rows) before (top, Th-specific) and 48hr after (bottom, Thstim-specific) activation of primary T cells with anti-CD3/CD28 antibodies. (c) Overlap with previously annotated T cell enhancers. For each annotation, expected (x-axis) vs. observed (y-axis) percentages of annotated features overlapping Th-specific (left), Thstim-specific (center) and shared peaks (right). (d) Overlap with GWAS variants. For each phenotype or disease, expected (x-axis) vs. observed (y-axis) percentages of GWAS loci overlapping Th-specific (left), Thstim-specific (center), or shared (right) peaks.
Figure 2
Figure 2. Changes in transcription factor enrichment in response to T cell activation
(a) Transcription factor motif enrichment. Expected (x-axis) vs. observed (y-axis) percentages of Th-specific (left), Thstim-specific (center), or shared (right) peaks overlapping each TF binding site annotation. (b-d) TF footprinting. For each TF motif (as defined in ENCODE), nucleotide resolution average chromatin accessibility (y-axis) in Th (purple) or Thstim (red) cells along the TF binding site (x-axis; log(bp from center of each TF motif)). Aggregated locations are defined as (b) Thstim-specific peaks overlapping BATF, ISRE, and BATF/IRF motifs (three left panels) and shared peaks overlapping CTCF binding sites (right panel), (c) Th-specific (left) and Thstim-specific (right) peaks overlapping ETS1 binding sites, and (d) Th-specific peaks overlapping ETS1/RUNX combinatorial binding sites.
Figure 3
Figure 3. Inter-individual chromatin co-accessibility
(a) Overview of T cell activation for 105 ATAC-seq and 95 RNA-seq samples. (b) Schematic of nomenclature for co-accessible peaks, SNP-containing peaks, local-ATAC-QTLs, distal-ATAC-QTLs, and eQTLs. Dashed lines denote a correlation between co-accessible peaks and solid lines denote a genetic association. (c) Megabase scale correlation of chromatin accessibility across 105 individuals. Heat map shows the pairwise Pearson correlation of chromatin accessibility between 1 Mb bins (row, column) for Chr 1. (d) Pearson correlation of Hi-C interactions at 1 Mb resolution for Chr 1. (e) Histogram of distances between significantly co-accessible peaks (pink) and random permuted peaks (grey). (f) Co-accessible peaks overlap with Hi-C domains. Q-Q plot of linear regression P-values for pairs of peaks residing in (blue) or out (red) of the same Hi-C domain. (g) Pairs of co-accessible peaks overlapping with multiple cis-regulatory regions. A cartoon depiction (top) of co-accessible peaks in promoters (green), enhancers (blue), and super enhancers (orange). Proportion (y-axis) of pairs of co-accessible peaks and non-co-accessible peaks overlapping pairs of annotated cis-regulatory elements (right). (h) Proportion of co-accessible peaks overlapping super-enhancers or randomly shuffled background.
Figure 4
Figure 4. Genetic variants that affect chromatin states in human T cell activation
(a) Q-Q plot of linear regression P-values for all local-ATAC-QTLs (black) and local-ATAC-QTLs binned by minor allele frequency: 0.1 > MAF > 0.05 (red), 0.2 > MAF > 0.1 (orange), 0.3 > MAF 0.2 (yellow), 0.4 > MAF > 0.3 (green), 0.5 > MAF 0.4 (blue), and MAF > 0.05 (black). (b) Heritability of chromatin accessibility. For each of 1,428 local-ATAC-peaks, coefficient of determination (R2) of the best associated local-ATAC-QTL (y-axis) vs. cis heritability (h2) estimated based on all genotypes +/− 500 kb of each peak (x-axis). Black points: significantly heritable peaks (FDR < 0.05). (c) Enrichment of local-ATAC-peaks in TSS and TTS. 3,318 local-ATAC-peaks (dark pink and purple) vs. 3,318 randomly sampled SNP-containing ATAC-peaks (light pink and purple). (d-f) Disruption of TF binding sites by local-ATAC-QTLs. (d) Unsupervised TF binding site analysis of local-ATAC-peaks. Motifs for six TFs associated with most of the large gkmSVM weights, and the percentage of the overall disruption (%, bottom) explained by local-ATAC-QTLs. (e) Correlation of effect sizes of local-ATAC-QTLs (x-axis) vs. deltaSVM scores (y-axis). (f) Allele specificity of local-ATAC-QTLs. For BATF, ETS1 and CTCF motifs (as identified in ENCODE), aggregated plots of mean chromatin accessibility (y-axis) of local-ATAC-peaks along the TF binding site (x-axis; log(bp from center of the TF motif)) for samples heterozygous (pink), homozygous for the high (blue) or low (green) local-ATAC-QTL alleles (g) Relation between contact domains and SNP-containing ATAC-peaks or local-ATAC-peaks. For ATAC-peaks or local-ATAC-peaks overlapping ETS1, CTCF, or BATF binding sites, enrichment density (y-axis) vs. distance (number of domains) of peak to nearest domain (x-axis). Hi-C contact domain boundaries are indicated (dotted red lines). (h) Partitioned heritability estimates. The proportion of the heritability for 28 diseases explained (proportion: left, y-axis; enrichment: right, y-axis) captured by local-ATAC-QTLs called at different FDR thresholds (x-axis). (i) Effects of local-ATAC-QTL rs17293632 on the accessibility of the corresponding BATF containing local-ATAC-peak on chromosome 15. ATAC-seq profiles were aggregated per rs17293632 genotypes (black: homozygous major allele, light blue: heterozygous, red: homozygous minor allele).
Figure 5
Figure 5. Genetic determinants of co-accessible peaks
(a) Distribution of the heritability explained by SNPs +/− 500 kb of ATAC-peaks. Local-ATAC-peaks (olive). SNP-containing co-accessible peaks (blue). Co-accessible peaks without a SNP (purple). SNP-containing ATAC-peaks (green). ATAC-peaks without a SNP (red). (b) Q-Q plots of the linear regression P-values of distal-ATAC-peaks that are single peaks (red: co-accessibility FDR > 0.5), or co-accessible peaks called at various significance cutoffs (light blue: 0.2 < FDR < 0.5, medium blue: 0.05 < FDR < 0.2, dark blue: FDR < 0.05). The cartoons (upper left corner) depict the distal-ATAC-QTL association for single peaks (left cartoon; red line is the association plotted) and distal-ATAC-QTL association for co-accessible peaks (right cartoon; blue line is the association plotted; upper dashed line is the co-accessible peak at various significance cutoffs). (c) Proportion of co-accessible distal-ATAC-peaks overlapping super-enhancers or randomly shuffled background. (d) An example of a genetic variant (rs10882660) residing in the first intron in ENTPD1, associated locally (in purple) and distally (in yellow) to ATAC-peaks. The local and distal-ATAC-peaks are co-accessible (dotted line) and reside in a Hi-C contact domain (grey). ATAC-seq profiles were aggregated for individuals of different rs10882660 genotypes (black: homozygous major allele, light blue: heterozygous, red: homozygous minor allele).
Figure 6
Figure 6. Association of chromatin accessibility and gene expression
(a) eQTLs. Q-Q plot of associations between local-ATAC-QTLs (black) or all SNPs (red) and expression of genes +/− 500kb. (b) Heritability of gene expression. For each of 191 eGenes, coefficient of determination (R2) of the best associated eQTL (y-axis) vs. heritability (h2) of all variants +/− 500 kb of each gene (x-axis). Black points: significantly heritable peaks (FDR < 0.05). (c) Correlation of effect sizes between local-ATAC-QTLs (x-axis) and eQTLs (y-axis). (d) Mediation of eGenes. Average causal mediation effect estimates (y-axis) and average direct effect estimates (x-axis) for local-ATAC-peaks (mediator) and eGenes (outcome variable) sharing a SNP (instrument variable). FDR < 0.1 local-ATAC-peaks are colored in black. (e,f) Examples of gene expression conditioned on chromatin accessibility. (e) FADS2 expression (y-axis) vs. chromatin accessibility at chr11:61,601,708-61,602,451 (x-axis) before (left) and after (right) conditioning on rs174575. (f) FADS1 expression (y-axis) vs. chromatin accessibility at chr11:61,582,207-61,584,717 (x-axis) before (left) and after (right) conditioning, colored by rs174561 genotypes. (g,h) ATAC-seq (top) and RNA-seq (bottom) profiles were aggregated for individuals of different (g) rs174561 and (h) rs174575 genotypes (black: homozygous major allele, light blue: heterozygous, red: homozygous minor allele).

Similar articles

Cited by

References

    1. McCarthy MI, et al. Genome-wide association studies for complex traits: consensus, uncertainty and challenges. Nat Rev Genet. 2008;9:356–69. - PubMed
    1. Visscher PM, Brown MA, McCarthy MI, Yang J. Five years of GWAS discovery. Am J Hum Genet. 2012;90:7–24. - PMC - PubMed
    1. Hirschhorn JN, Daly MJ. Genome-wide association studies for common diseases and complex traits. Nat Rev Genet. 2005;6:95–108. - PubMed
    1. Maurano MT, et al. Systematic localization of common disease-associated variation in regulatory DNA. Science. 2012;337:1190–5. - PMC - PubMed
    1. Stranger BE, et al. Population genomics of human gene expression. Nat Genet. 2007;39:1217–24. - PMC - PubMed

Publication types