. 2018 Jul 24;115(30):E7129-E7138.
doi: 10.1073/pnas.1721298115. Epub 2018 Jul 9.

Different roles of myocardial ROCK1 and ROCK2 in cardiac dysfunction and postcapillary pulmonary hypertension in mice

Affiliations

Different roles of myocardial ROCK1 and ROCK2 in cardiac dysfunction and postcapillary pulmonary hypertension in mice

Shinichiro Sunamura et al. Proc Natl Acad Sci U S A. .

Abstract

Although postcapillary pulmonary hypertension (PH) is an important prognostic factor for patients with heart failure (HF), its pathogenesis remains to be fully elucidated. To elucidate the different roles of Rho-kinase isoforms, ROCK1 and ROCK2, in cardiomyocytes in response to chronic pressure overload, we performed transverse aortic constriction (TAC) in cardiac-specific ROCK1-deficient (cROCK1-/-) and ROCK2-deficient (cROCK2-/-) mice. Cardiomyocyte-specific ROCK1 deficiency promoted pressure-overload-induced cardiac dysfunction and postcapillary PH, whereas cardiomyocyte-specific ROCK2 deficiency showed opposite results. Histological analysis showed that pressure-overload-induced cardiac hypertrophy and fibrosis were enhanced in cROCK1-/- mice compared with controls, whereas cardiac hypertrophy was attenuated in cROCK2-/- mice after TAC. Consistently, the levels of oxidative stress were up-regulated in cROCK1-/- hearts and down-regulated in cROCK2-/- hearts compared with controls after TAC. Furthermore, cyclophilin A (CyPA) and basigin (Bsg), both of which augment oxidative stress, enhanced cardiac dysfunction and postcapillary PH in cROCK1-/- mice, whereas their expressions were significantly lower in cROCK2-/- mice. In clinical studies, plasma levels of CyPA were significantly increased in HF patients and were higher in patients with postcapillary PH compared with those without it. Finally, high-throughput screening demonstrated that celastrol, an antioxidant and antiinflammatory agent, reduced the expressions of CyPA and Bsg in the heart and the lung, ameliorating cardiac dysfunction and postcapillary PH induced by TAC. Thus, by differentially affecting CyPA and Bsg expressions, ROCK1 protects and ROCK2 jeopardizes the heart from pressure-overload HF with postcapillary PH, for which celastrol may be a promising agent.

Keywords: Rho-kinase; heart failure; oxidative stress.


Conflict of interest statement

The authors declare no conflict of interest.

Figures
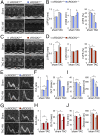
Fig. 1.
Fig. 1.
Different roles of ROCK1 and ROCK2 in response to pressure overload. (A) Representative echocardiographic M-mode images of left ventricles in cROCK1+/+ and cROCK1−/− mice 4 wk after TAC or sham operation. (Scale bars, 100 ms and 1 mm.) (B) Quantitative analysis of the parameters of cardiac function in cROCK1+/+ and cROCK1−/− mice at 4 wk after TAC (n = 12 each) or sham operation (n = 5 each). (C) Representative echocardiographic M-mode images of left ventricles in cROCK2+/+ and cROCK2−/− mice 4 wk after TAC or sham operation. (Scale bars, 100 ms and 1 mm.) (D) Quantitative analysis of the parameters of cardiac function in cROCK2+/+ and cROCK2−/− mice at 4 wk after TAC (n = 12 each) or sham operation (n = 5 each). (E) Representative echocardiographic images of mitral inflow pattern to evaluate diastolic dysfunction in cROCK1+/+ and cROCK1−/− mice 4 wk after TAC or sham operation. (Scale bars, 20 ms and 200 mm/s.) (F) Quantitative analysis of the parameters of diastolic function measured by transmitral Doppler velocity ratio of early-to-atrial wave (E/A ratio) and early wave decelation time (DcT) in cROCK1+/+ and cROCK1−/− mice at 4 wk after TAC (n = 12 each) or sham operation (n = 5 each). (G) Representative echocardiographic images of mitral inflow pattern to evaluate diastolic dysfunction in cROCK2+/+ and cROCK2−/− mice 4 wk after TAC or sham operation. (Scale bars, 20 ms and 200 mm/s.) (H) Quantitative analysis of the parameters of diastolic function measured by E/A ratio and DcT in cROCK2+/+ and cROCK2−/− mice at 4 wk after TAC (n = 12 each) or sham operation (n = 5 each). (I) Exercise tolerance evaluated by measuring running time and distance in a treadmill running test in cROCK1+/+ and cROCK1−/− mice at 4 wk after TAC (n = 12 each) or sham operation (n = 5 each). (J) Exercise tolerance evaluated by measuring walking time and distance in a treadmill test in cROCK2+/+ and cROCK2−/− mice at 4 wk after TAC (n = 12 each) or sham operation (n = 5 each). Data represent the mean ± SEM; *P < 0.05. Comparisons of parameters were performed with two-way ANOVA, followed by Tukey’s honestly significant difference test for multiple comparisons.
Fig. 2.
Fig. 2.
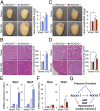
Opposite roles of ROCK1 and ROCK2 in cardiac hypertrophy. (A, Left) Representative photomicrographs of hearts from cROCK1+/+ and cROCK1−/− mice 4 wk after TAC or sham operation. (A, Right) The ratio of heart weight to body weight (BW) in cROCK1+/+ and cROCK1−/− mice at 4 wk after TAC (n = 12 each) or sham operation (n = 5 each). (Scale bars, 3 mm.) (B, Left) Representative photomicrographs of H&E staining of hearts from cROCK1+/+ and cROCK1−/− mice 4 wk after TAC or sham operation. (B, Right) Quantitative analysis of cardiomyocyte CSA in cROCK1+/+ and cROCK1−/− mice at 4 wk after TAC (n = 10 each) or sham operation (n = 5 each). (Scale bars, 50 μm.) (C, Left) Representative photomicrographs of hearts from cROCK2+/+ and cROCK2−/− mice 4 wk after TAC or sham operation. (C, Right) The ratio of heart weight to body weight (BW) in cROCK2−/− and cROCK2+/+ mice at 4 wk after TAC (n = 12 each) or sham operation (n = 5 each). (Scale bars, 3 mm.) (D, Left) Representative photomicrographs of H&E staining of hearts from cROCK2+/+ and cROCK2−/− mice 4 wk after TAC or sham operation. (D, Right) Quantitative analysis of cardiomyocyte CSA in cROCK2−/− and cROCK2+/+ mice at 4 wk after TAC (n = 10 each) or sham operation (n = 5 each). (Scale bars, 50 μm.) (E) Relative mRNA expressions of hypertrophic markers, such as natriuretic peptide A (Nppa) and natriuretic peptide B (Nppb), in cROCK1+/+ and cROCK1−/− hearts at 4 wk after TAC (n = 12 each) or sham operation (n = 5 each). (F) Relative mRNA expressions of hypertrophic markers in cROCK2+/+ and cROCK2−/− hearts at 4 wk after TAC (n = 12 each) or sham operation (n = 5 each). (G) Schematic representation of the opposite roles of ROCK1 and ROCK2 in the development of pressure-overload-induced cardiac hypertrophy. *P < 0.05. Comparisons of parameters were performed with two-way ANOVA, followed by Tukey’s honestly significant difference test for multiple comparisons.
Fig. 3.
Fig. 3.
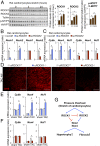
Conflicting roles of ROCK1 and ROCK2 in cardiomyocytes for ROS induction. (A) Representative Western blot and quantification of ROCK1, ROCK2, and phosphorylated/total MYPT in NRCMs after mechanical cyclic stretch (1 Hz, 20% elongation) for 0, 3, and 24 h (n = 6 each). (B) Relative mRNA expression of Rock1 and Rock2 in NRCMs after transfection with ROCK1 siRNA (si-ROCK1), ROCK2 siRNA (si-ROCK2), or control siRNA (si-Ctrl) (n = 4 each). (C) Relative mRNA expressions of Cybb (NOX2), Nox4, and Ncf1 (p47phox) in NRCMs after transfection with si-ROCK1, si-ROCK2, or si-Ctrl (n = 4 each). (D) Representative pictures of DHE staining of the LV after TAC. (Scale bars, 100 µm.) (E) Relative mRNA expression of Cybb (NOX2), Nox4, and Ncf1 (p47phox), in cROCK1+/+ and cROCK1−/− hearts at 4 wk after TAC (n = 12 each) or sham operation (n = 5 each). (F) Relative mRNA expression of Cybb, Nox4, and Ncf1, in cROCK2+/+ and cROCK2−/− hearts at 4 wk after TAC (n = 12 each) or sham operation (n = 5 each). (G) Schematic representation of opposing roles of ROCK1 and ROCK2 in cardiomyocytes for ROS production. Data represent the mean ± SEM; *P < 0.05. Comparisons of parameters were performed with the unpaired Student’s t test or two-way ANOVA followed by Tukey’s honestly significant difference test for multiple comparisons.
Fig. 4.
Fig. 4.
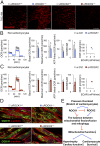
Conflicting roles of ROCK1 and ROCK2 in mitochondrial function. (A) Representative pictures of MitoSOX staining of the LV after TAC. (Scale bars, 100 µm.) (B) Quantification of the mitochondrial OCR and ECAR of NRCMs after transfection with ROCK1 siRNA (si-ROCK1) or control siRNA (si-Ctrl) (n = 6 each). Bar graphs show basal OCR, maximum OCR, ATP-linked OCR, and the ratio of OCR to ECAR. (C) Quantification of the mitochondrial OCR and ECAR of NRCMs after transfection with ROCK2 siRNA (si-ROCK2) or si-Ctrl (n = 6 each). (D) Representative double immunostaining for α-actinin and COX IV (mitochondria) of the LV after TAC. (Scale bars, 25 µm.) (E) Schematic representation of opposing roles of ROCK1 and ROCK2 in mitochondrial function. Data represent the mean ± SEM; *P < 0.05. Comparisons of parameters were performed with an unpaired Student’s t test.
Fig. 5.
Fig. 5.
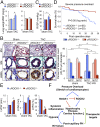
ROCK1 and ROCK2 in cardiomyocytes for postcapillary PH and survival. (A) The ratio of lung weight to body weight (BW) in cROCK1+/+, cROCK1−/−, cROCK2+/+, and cROCK2−/− mice at 4 wk after TAC (n = 12 each) or sham operation (n = 5 each). (B, Left) Representative EM and immunostaining for α-smooth muscle actin (αSMA) of the distal pulmonary arteries (PA) in cROCK1−/− and cROCK2−/− mice at 4 wk after TAC or sham operation. (Scale bars, 25 µm.) (B, Right) Muscularization ratios of distal PAs in cROCK1−/− and cROCK2−/− mice at 4 wk after TAC (n = 10 each) or sham operation (n = 5 each). F, fully muscularized vessels; N, nonmuscularized vessels; P, partially muscularized vessels. (C) RVSP in cROCK1−/− and cROCK2−/− mice at 4 wk after TAC (n = 6 each) or sham operation (n = 6 each). (D) Survival rates of cROCK1−/− (n = 55) and cROCK2−/− mice (n = 35) subjected to severe TAC. Results are expressed as log-rank test. (E) Quantitative analysis of the parameters of cardiac function assessed by echocardiography in cROCK1−/− and cROCK2−/− mice at 4 wk after severe TAC (n = 12 each) or sham operation (n = 5 each). (F) Schematic representation of the different roles of ROCK1 and ROCK2 in cardiomyocytes for the development of postcapillary PH and survival. Data represent the mean ± SEM; *P < 0.05. Comparisons of parameters were performed with two-way ANOVA followed by Tukey’s honestly significant difference test for multiple comparisons.
Fig. 6.
Fig. 6.
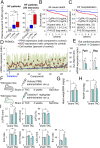
Celastrol ameliorates cardiac dysfunction and postcapillary PH. (A, Left) Plasma levels of cyclophilin A (CyPA) in patients with HF with (n = 54) or without (n = 72) postcapillary PH compared with controls (n = 25). (B, Right) Plasma levels of CyPA in patients with stenotic valvular disease, such as AS, mitral valve stenosis, and pulmonary valve stenosis with (n = 18) or without (n = 27) postcapillary PH compared with controls (n = 25). (B and C) Kaplan–Meier curve in patients with HF. Higher plasma CyPA levels (≥10 ng/mL) were significantly associated with (B) all-cause death and (C) HF hospitalization, compared with lower plasma CyPA levels (<10 ng/mL). (D) Results of the 113 compounds that suppress PASMC proliferation (green bars) and Ppia (CyPA, blue plots) and Bsg (Bsg, red plots) gene expression. (E) Relative mRNA expressions of Ppia and Bsg in NRCMs after treatment with celastrol or vehicle for 24 h (n = 3 each). (F) Schematic protocols for celastrol administration to wild-type mice subjected to TAC or sham operation, in which celastrol (1 mg/kg/d) or control vehicle was administered by i.p. injection. (G) The ratio of heart weight/body weight (BW) after treatment with celastrol or control vehicle for 4 wk (TAC, n = 15 each; sham n = 5 each). (H) RVSP after treatment with celastrol or vehicle for 4 wk (TAC, n = 15 each; sham n = 5 each). (I) Quantitative analysis of the echocardiographic parameters of cardiac function after treatment with celastrol or control vehicle for 4 wk (TAC, n = 15 each; sham n = 5 each). Data represent the mean ± SEM; *P < 0.05. Comparisons of parameters were performed with two-way ANOVA followed by Tukey’s honestly significant difference test for multiple comparisons.

Similar articles

Cited by

References

    1. Roger VL. Epidemiology of heart failure. Circ Res. 2013;113:646–659. - PMC - PubMed
    1. Paulus WJ, van Ballegoij JJ. Treatment of heart failure with normal ejection fraction: An inconvenient truth! J Am Coll Cardiol. 2010;55:526–537. - PubMed
    1. Holland DJ, Kumbhani DJ, Ahmed SH, Marwick TH. Effects of treatment on exercise tolerance, cardiac function, and mortality in heart failure with preserved ejection fraction. A meta-analysis. J Am Coll Cardiol. 2011;57:1676–1686. - PubMed
    1. Loffredo FS, Nikolova AP, Pancoast JR, Lee RT. Heart failure with preserved ejection fraction: Molecular pathways of the aging myocardium. Circ Res. 2014;115:97–107. - PMC - PubMed
    1. Redfield MM. Understanding “diastolic” heart failure. N Engl J Med. 2004;350:1930–1931. - PubMed

MeSH terms