. 2018 Jul 5;9(1):2622.
doi: 10.1038/s41467-018-04851-z.

ATR is required to complete meiotic recombination in mice

Affiliations

ATR is required to complete meiotic recombination in mice

Sarai Pacheco et al. Nat Commun. .

Abstract

Precise execution of recombination during meiosis is essential for forming chromosomally-balanced gametes. Meiotic recombination initiates with the formation and resection of DNA double-strand breaks (DSBs). Cellular responses to meiotic DSBs are critical for efficient repair and quality control, but molecular features of these remain poorly understood, particularly in mammals. Here we report that the DNA damage response protein kinase ATR is crucial for meiotic recombination and completion of meiotic prophase in mice. Using a hypomorphic Atr mutation and pharmacological inhibition of ATR in vivo and in cultured spermatocytes, we show that ATR, through its effector kinase CHK1, promotes efficient RAD51 and DMC1 assembly at RPA-coated resected DSB sites and establishment of interhomolog connections during meiosis. Furthermore, our findings suggest that ATR promotes local accumulation of recombination markers on unsynapsed axes during meiotic prophase to favor homologous chromosome synapsis. These data reveal that ATR plays multiple roles in mammalian meiotic recombination.


Conflict of interest statement

The authors declare no competing interests.

Figures
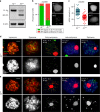
Fig. 1
Fig. 1
Seckel mouse spermatocytes exhibit more γH2AX patches than wild-type cells. a RT-PCR using primers that anneal to Atr exons 8 and 10. AtrS/S testis exhibits two main RT-PCR products, one corresponding to full-length Atr (FL Atr, 477 bp), which is substantially reduced, and another corresponding to Atr lacking exon 9 (ΔE9 Atr, 284 bp). Asterisk denotes RT-PCR product resulting from the use of a cryptic splice donor site. RT-PCR for β Actin is also provided as a control. b Percentage of cells exhibiting ATR staining extended to X and Y chromatin or confined to the X and Y chromosome axes in Atr+/+ and AtrS/S (N = 284 and N = 282, respectively). Columns and lines indicate the mean and standard deviation (SD) from analysis performed on three wild-type and three mutant mice. Images show ATR straining on the sex body in Atr+/+ and AtrS/S pachytene spermatocytes. Images were captured with the same exposure time. Scale bar = 2 μm. c Quantification of the intensity of γH2AX staining on the sex body in arbitrary units (a.u.). Horizontal black lines denote the means. Images show representative sex bodies from Atr+/+ and AtrS/S pachytene spermatocytes immunostained against γH2AX. Images were captured with the same exposure time. Scale bar = 2 μm. Representative images of Atr+/+ (d) and AtrS/S (e) spermatocytes at different stages of meiotic prophase immunostained against SYCP3, γH2AX, and H1T. Scale bars = 10 μm. Numbers represent the mean ± SD of γH2AX patches found in each stage and genotype. N denotes the number of cells analyzed. H1T incorporation marks spermatocytes after mid-pachynema. Arrowheads indicate examples of aberrant autosomal γH2AX patches in AtrS/S spermatocytes. The differences between controls and AtrS/S for γH2AX patch numbers at late pachynema and diplonema were statistically significant (p = 0.0001 and p = 0.0007, respectively, t test)
Fig. 2
Fig. 2
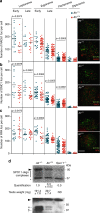
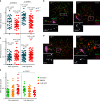
Normal DSB formation but altered numbers of recombination markers in AtrS/S cells. ac Left panels, quantification of total foci per spermatocyte for RAD51 (a), DMC1 (b), or RPA (c) at the indicated stages. Each point is the focus count for a single cell. Horizontal lines denote the mean. Right panels, representative images of spermatocytes stained for the indicated proteins. Scale bar = 10 μm. All p values are from t test pairwise comparisons; no p value is stated if the comparison was not statistically significant (p > 0.05). d Quantification of SPO11-oligonucleotide complexes. A representative experiment is shown. Anti-SPO11 immunoprecipitates from two testes of each genotype were labeled with terminal transferase and [α-32P]-dCTP, resolved by SDS-PAGE, and detected by autoradiography (top) and western blotting analysis (bottom). Vertical line indicates the signal from SPO11-oligonucleotide complexes; asterisk indicates non-specific signal from the labeling reaction; positions of the two major SPO11 splicing isoforms, α and β are shown; and arrowheads denote the migration position of immunoglobulin heavy chain. SPO11-oligonucleotide signal and testis weights are indicated (mean ± SD, N = 2). Note that AtrS/S testes express both SPO11α and SPO11β, unlike mutants that experience arrested meiotic progression and lack SPO11α as a consequence,,
Fig. 3
Fig. 3
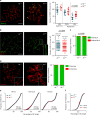
Late recombination markers in wild type and AtrS/S spermatocytes. a Left panels, representative images of late pachytene spermatocytes immunostained against SYCP3 and RNF212. Scale bar = 10 μm and applies to both images. Right panel, quantification of RNF212 foci. Horizontal black lines denote the means; the p value is from t test, and comparisons without p values stated were not significant (p > 0.05). b Left panels, representative images of pachytene spermatocytes immunostained against SYCP3 and MLH1. Scale bar = 10 μm and applies to both images. A bivalent lacking an MLH1 focus in the AtrS/S spermatocyte (white box) is magnified in the inset. Right panel, quantification of autosomal MLH1 foci at pachynema. Horizontal black lines denote the means. AtrS/S and control were compared by Mann–Whitney test. c Proportion of bivalents without an MLH1 focus. N = 1520 (mutant) or 1653 (control); p value is from Fisher’s exact test. d Left, representative images of diplotene spermatocytes immunostained against SYCP3. Scale bar = 10 μm. Achiasmate bivalents (white boxes) are magnified in the insets. Right, percentage of achiasmate bivalents at late diplonema from Atr+/+ (N = 798) and AtrS/S (N = 912) spermatocytes (p = 0.84, Fisher’s exact test). e Cumulative frequency plots comparing MLH1 focus distribution along autosomal bivalents from pachytene Atr+/+ and AtrS/S spermatocytes. MLH1 focus distributions were similar between Atr+/+ (N = 924) and AtrS/S (N = 932). Distributions in SCs presenting one MLH1 focus from Atr+/+ (N = 581) and AtrS/S (N = 601) and in SCs presenting two MLH1 foci from Atr+/+ (N = 350) and AtrS/S (N = 369) spermatocytes were also indistinguishable (Kolgomorov–Smirnov (KS) test). f MLH1 interfocal distances (as a percentage of SC length) measured on SCs containing more than one MLH1 focus. Data were fitted to the gamma distribution to measure the strength of interference denoted by the shape parameter (ν)
Fig. 4
Fig. 4
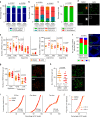
In vivo inhibition of ATR affects prophase progression and recombination markers. a Percentage of SYCP3-positive cells from mouse testes treated 3 or 7 days with DMSO (N = 2057 and N = 986 cells, respectively) or AZ20 (N = 2063 and 936 cells, respectively). Two mice per condition were analyzed. P value is from Fisher’s exact test. b Percentage of spermatocytes at different prophase stages in 3 and 7 days DMSO- (N = 2035 and N = 600) and AZ20-treated mice (N = 2091 and N = 600 cells, respectively). Two mice per condition were analyzed. P value is from G test. c Percentage of pachytene cells exhibiting unsynapsed X and Y chromosomes in DMSO- (N = 472) and AZ20-treated spermatocytes (N = 426). Two mice per condition were analyzed. P value is from Fisher’s exact test. d Representative images of DMSO- and AZ20-treated pachytene spermatocytes stained for SYCP3 and γH2AX. Note the presence of a sex body over the X and Y chromosomes in the control, but not in the AZ20-treated cell. e RAD51 and RPA foci per spermatocyte at the indicated stages in DMSO- and AZ20-treated mice. Horizontal lines denote the means. P values are from t tests. f Proportion of tubule sections with 0, 1–4, or >4 TUNEL-positive cells from mice treated with DMSO or AZ20. P value is from t test. Scale bar = 40 µm. g RNF212 foci in pachytene spermatocytes after 7 days of DMSO or AZ20 treatment. Horizontal black lines denote the means. P value is from t test. Images show pachytene spermatocytes immunostained for SYCP3 and RNF212. Scale bars = 10 μm. h Autosomal MLH1 foci in pachytene spermatocytes after 7 days of DMSO or AZ20 treatment. Horizontal black lines denote the means. P value is from a Mann–Whitney test. Images show pachytene spermatocytes immunostained for SYCP3 and MLH1. Scale bars = 10 μm. i Cumulative frequency plots comparing MLH1 focus distribution along autosomal bivalents from pachytene spermatocytes after 7 days of DMSO or AZ20 treatment. MLH1 focus distribution along all autosomal bivalents was similar between DMSO (N = 320) and AZ20 (N = 233) treatments. In SCs presenting one MLH1 focus from DMSO- (N = 204) and AZ20- (N = 138) treated mice or two MLH1 foci from DMSO- (N = 116) and AZ20- (N = 94) treated mice, MLH1 focus location was also indistinguishable (KS test). j MLH1 interfocal distances expressed as a percentage of SC length from autosomal bivalents containing two MLH1 foci. Shape parameters (ν) from gamma distribution are shown
Fig. 5
Fig. 5
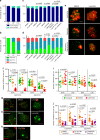
In vitro inhibition of ATR and CHK1 block recombination and prophase progression. a Percentage of SYCP3-positive cells in untreated testis fragments at 0, 7, and 14 days of culture. Columns and lines indicate the mean and SD from four replicates. b Mean percentage of spermatocytes at the indicated stages of prophase in untreated testis fragments from two replicates. c Proportion of SYCP3-positive cells at D14 in testis fragments treated with the indicated dosages of AZ20, PF-477736, or LY2603618, and their respective DMSO controls. Data obtained from three replicates per each condition. P values are from Fisher’s exact tests. d Proportion of spermatocytes at different stages of meiotic prophase at D14 of culture. Data obtained from two replicates per each condition. P values are from G tests. e Representative images of spermatocytes from testes treated with DMSO3 or 5 μM AZ20 showing progression of meiotic prophase, followed by staining for SYCP3 and γH2AX. f RAD51 foci at the indicated stages from D14 cultures (Color code key is in panel i). In this and other graphs of focus counts, horizontal lines denote the means and p values are from pairwise t tests. g, h Representative spermatocytes from cultured samples stained for SYCP3 and either RAD51 (g) or DMC1 (h). i RPA foci in cultured spermatocytes. j RAD51 foci per spermatocyte from control and PF-477736- or LY2603618-treated samples. k Representative images of spermatocytes from D14 cultures treated with DMSO or 1 µM PF-477736 and immunostained for SYCP3 and RAD51. Data presented for each culture condition correspond to at least two experiments performed using different samples. Scale bars in all micrographs represent 10 μm
Fig. 6
Fig. 6
ATR function is needed for normal levels of recombination markers on unsynapsed axes. a RAD51 focus density along the entire measurable X-chromosome axis. Horizontal black lines denote the means. P values are from t tests. b Representative images of late zygotene spermatocytes. Images show overlays of immunofluorescence against SYCP3 and RAD51 with fluorescence in situ hybridization (FISH) for the X-PAR boundary. Scale bar = 10 μm. Inset images show RAD51 foci on the measurable X-chromosome axis. c RPA focus density on the measurable X chromosome. d Images of early zygotene spermatocytes showing immunofluorescence against SYCP3 and RPA, overlaid with FISH for X-PAR boundary. Inset images show RPA foci on the measurable X-chromosome axis. e RPA focus numbers present on unsynapsed axes at D14 from spermatocytes cultured in vitro

Similar articles

Cited by

References

    1. Keeney S, Giroux CN, Kleckner N. Meiosis-specific DNA double-strand breaks are catalyzed by Spo11, a member of a widely conserved protein family. Cell. 1997;88:375–384. doi: 10.1016/S0092-8674(00)81876-0. - DOI - PubMed
    1. Baudat F, Imai Y, de Massy B. Meiotic recombination in mammals: localization and regulation. Nat. Rev. Genet. 2013;14:794–806. doi: 10.1038/nrg3573. - DOI - PubMed
    1. Cimprich KA, Cortez D. ATR: an essential regulator of genome integrity. Nat. Rev. Mol. Cell Biol. 2008;9:616–627. doi: 10.1038/nrm2450. - DOI - PMC - PubMed
    1. Maréchal, A. & Zou, L. DNA damage sensing by the ATM and ATR kinases. Cold Spring Harb. Perspect. Biol. 5, a012716 (2013). - PMC - PubMed
    1. Royo H, et al. ATR acts stage specifically to regulate multiple aspects of mammalian meiotic silencing. Genes Dev. 2013;27:1484–1494. doi: 10.1101/gad.219477.113. - DOI - PMC - PubMed

Publication types

MeSH terms