. 2018 Jun 20:11:206.
doi: 10.3389/fnmol.2018.00206. eCollection 2018.

Deletion of Specific Sphingolipids in Distinct Neurons Improves Spatial Memory in a Mouse Model of Alzheimer's Disease

Affiliations

Deletion of Specific Sphingolipids in Distinct Neurons Improves Spatial Memory in a Mouse Model of Alzheimer's Disease

Silke Herzer et al. Front Mol Neurosci. .

Abstract

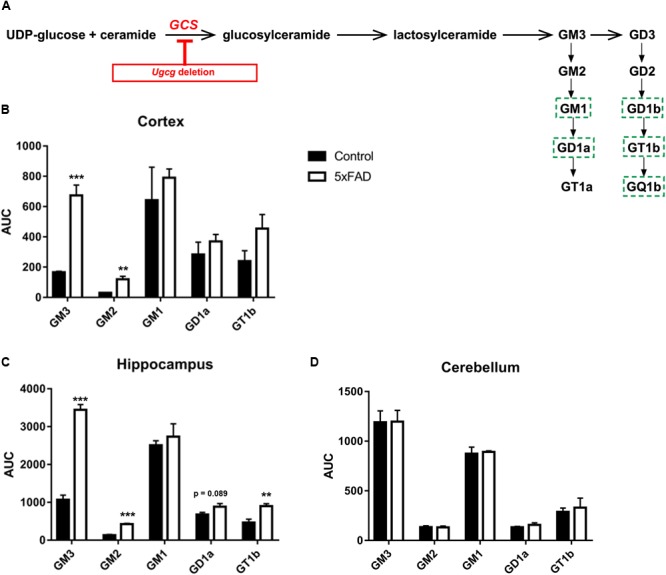
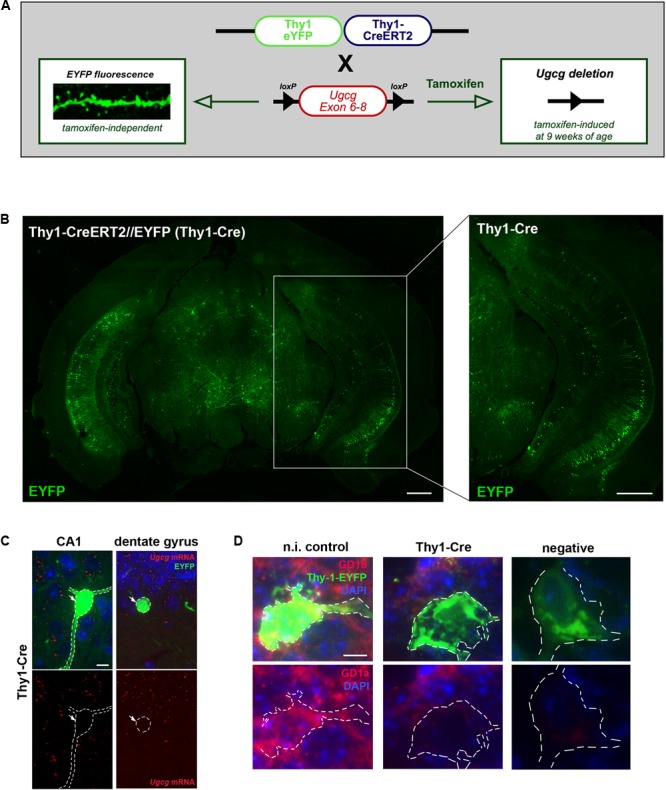
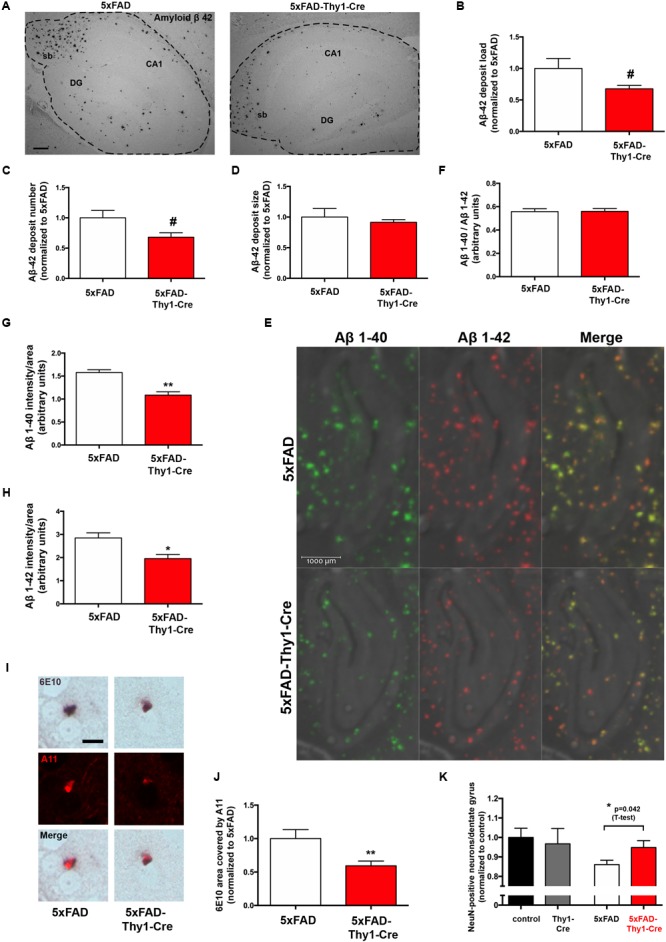
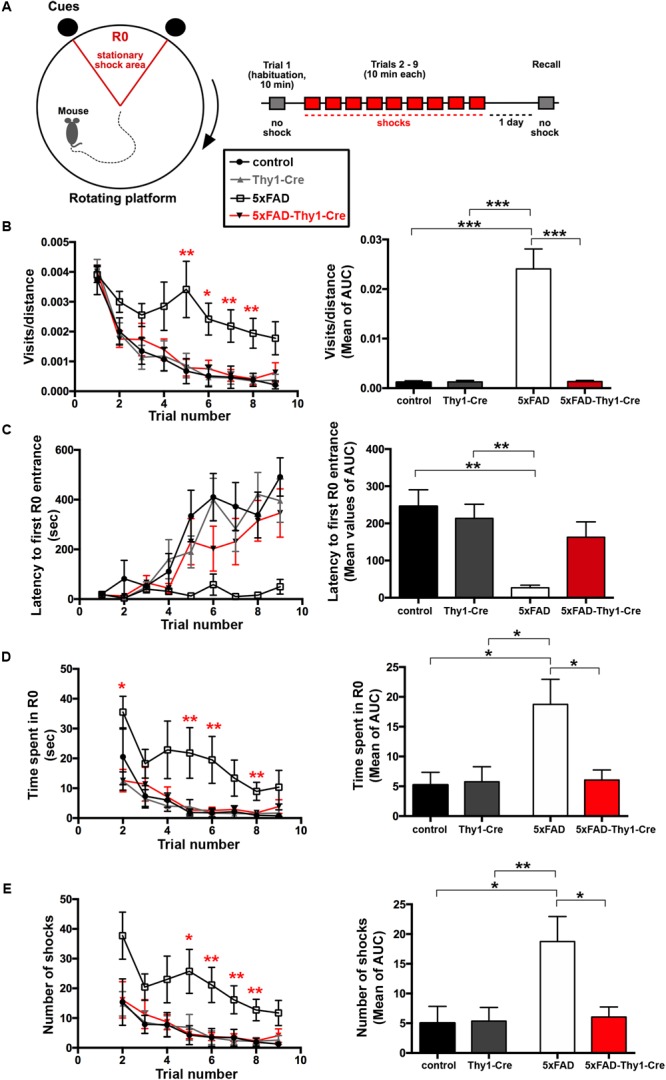
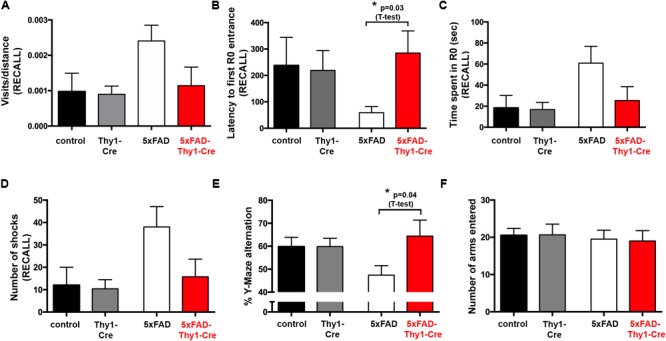
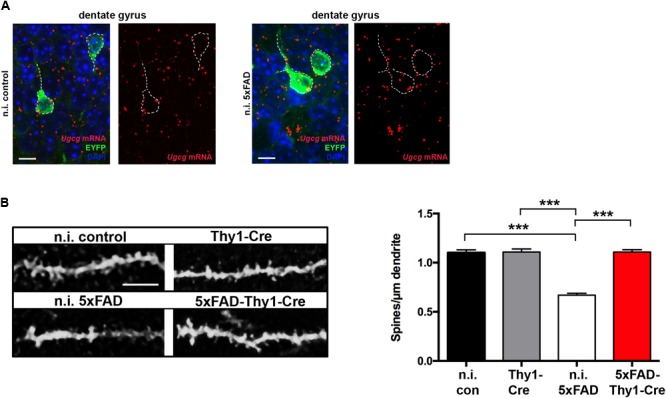
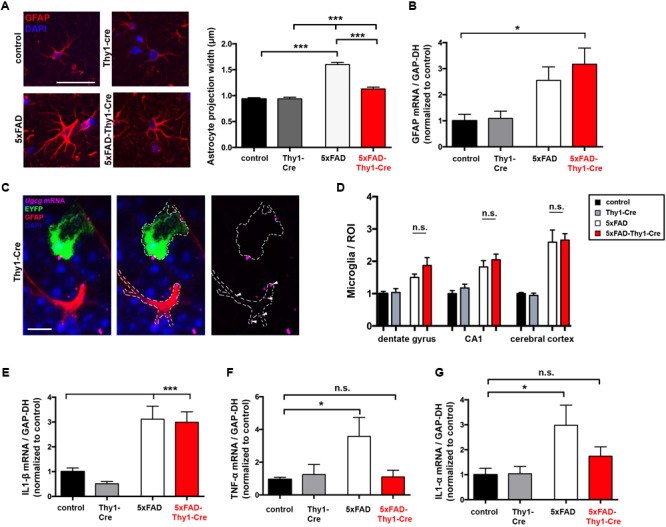
Alzheimer's disease (AD) is characterized by progressive neurodegeneration and a concomitant loss of synapses and cognitive abilities. Recently, we have proposed that an alteration of neuronal membrane lipid microdomains increases neuronal resistance toward amyloid-β stress in cultured neurons and protects from neurodegeneration in a mouse model of AD. Lipid microdomains are highly enriched in a specific subclass of glycosphingolipids, termed gangliosides. The enzyme glucosylceramide synthase (GCS) catalyzes the rate-limiting step in the biosynthesis of these gangliosides. The present work now demonstrates that genetic GCS deletion in subsets of adult forebrain neurons significantly improves the spatial memory and counteracts the loss of dendritic spines in the hippocampal dentate gyrus of 5x familial AD mice (5xFAD//Ugcgf/f//Thy1-CreERT2//EYFP mice), when compared to 5xFAD//Ugcgf/f littermates (5xFAD mice). Aberrantly activated glial cells and their expression of pro-inflammatory cytokines have emerged as the major culprits for synaptic loss in AD. Typically, astrocytic activation is accompanied by a thickening of astrocytic processes, which impairs astrocytic support for neuronal synapses. In contrast to 5xFAD mice, 5xFAD//Ugcgf/f//Thy1-CreERT2//EYFP display a less pronounced thickening of astrocytic processes and a lower expression of tumor necrosis factor-α and interleukin 1-α in the hippocampus. Thus, this work further emphasizes that GCS inhibition may constitute a potential therapeutic target against AD.

Keywords: Alzheimer’s disease; gangliosides; glial cells; spatial memory; spine density.


Figures

FIGURE 1
FIGURE 1
GCS deletion in distinct subsets of adult neurons in a 5xFAD mouse model. (A) Schematic representation of the biosynthesis of the ganglioside a- and b-series. Glucosylceramide synthase (GCS, gene: Ugcg) is the key enzyme in ganglioside biosynthesis. Major neuronal gangliosides are outlined. Genetic Ugcg deletion inhibits de novo ganglioside biosynthesis. (B,C) Mass spectrometry analysis of ganglioside levels shows that gangliosides GM3, GD3, and GT1b are increased in cerebral cortex (B) and hippocampus (C) of 5xFAD mice. AUC: area under curve, corresponding to the peak area normalized to the internal standard. (D) Ganglioside levels are unchanged in the cerebellum of 5xFAD mice, which is not affected by Aβ pathology (n = 4 (cortex and hippocampus) or 3 (cerebellum) 14-month-old mice per group). Statistical analysis was performed by unpaired two-tailed Student’s t-test. Means ± SEM. (∗∗) if P ≤ 0.01, or (∗∗∗) if P ≤ 0.001.
FIGURE 2
FIGURE 2
Generation of tamoxifen-inducible Thy1-Cre mice with GCS deletion in subsets of adult forebrain neurons. (A) The targeting construct in Thy1-CreERT2/EYFP mice comprises one Thy1 copy that drives tamoxifen-inducible Cre recombinase and the second Thy1 copy that drives tamoxifen-independent EYFP in targeted neurons. (B) EYFP fluorescence shows that neurons in the hippocampal regions CA1, CA2, and dentate gyrus are targeted by the construct (bregma –3.08 mm (coronal), scale bars = 200 μm). (C) An in situ hybridization (ISH) of tamoxifen-induced Ugcgf/f//Thy1-CreERT2/EYFP (Thy1-Cre) mice confirms that Cre-targeted neurons are devoid of GCS expression. The original brown ISH dots have been converted to red fluorescence, as described in Materials and Methods section (scale bar = 10 μm). For comparison, the original images are depicted in Supplementary Figure 2C. (D) Immunofluorescence shows that ganglioside GD1a is absent in Cre-targeted and fluorescent neurons of tamoxifen-induced Thy1-Cre mice. On the contrary, non-induced Thy1-Cre mice (n.i. control) mice only receiving solvent injections without tamoxifen display GD1a expression in EYFP-fluorescent neurons, because Cre activity is not induced in this case (scale bar = 5 μm).
FIGURE 3
FIGURE 3
Lower Aβ42 deposition and occurrence of oligomeric Aβ in 6E10-positive plaques of 5xFAD-Thy1-Cre mice. (A) Hippocampal sections (between lateral 0.96 and 1.2 mm (sagittal)) were stained with an antibody detecting specifically Aβ42 (sb = subiculum, DG = dentate gyrus, CA1 region; scale bar = 300 μm). Morphometry of these sections shows that (B) the Aβ42 load and (C) the Aβ42 deposit number are decreased in 5xFAD-Thy1-Cre mice. (D) The size of Aβ42 deposits does not differ between 5xFAD and 5xFAD-Thy1-Cre mice (n = 4 5xFAD or 5 5xFAD-Thy1-Cre brain sections derived from 4 to 5 mice, respectively; 1251 (5xFAD) and 1064 (5xFAD-Thy1-Cre) Aβ42 deposits were analyzed in total). (E) MALDI imaging has been performed on hippocampal sections located between bregma –1.82 and –1.94 mm (coronal) in order to distinguish Aβ40 and Aβ42 signals. (F) The Aβ40/Aβ42 ratio in total hippocampal sections is not altered, as determined by MALDI imaging. However, both Aβ40 (G) and Aβ42 (H) signal intensities normalized to the area are lower in 5xFAD-Thy1-Cre mice (n = 4 (5xFAD) and 6 (5xFAD-Thy1-Cre) hippocampal hemispheres from two 5xFAD and three 5xFAD-Thy1-Cre mice; statistical analysis was performed by unpaired two-tailed Student’s t-test). (I) A double staining depicts plaques located in striatum (lateral 0.96–1.2 mm (sagittal)) which are positive for both 6E10 and the oligomer-specific antibody A11, indicating oligomeric Aβ species located within Aβ plaques (scale bar = 10 μm). (J) The 6E10 plaque area that is covered by A11 signal is decreased in 5xFAD-Thy1-Cre mice (n = 76 (5xFAD) and 83 (5xFAD-Thy1-Cre) 6E10-positive plaques in sections derived from five mice each). (K) NeuN stainings were performed on hippocampal sections located between lateral 0.96 and 1.2 mm (sagittal). The numbers of NeuN-positive neurons (normalized to control) are depicted (n = 7 control, 8 Thy1-Cre, 10 5xFAD, and 7 5xFAD-Thy1-Cre sections derived from four control or five Thy1-Cre, 5xFAD, 5xFAD-Thy1-Cre mice). Statistical analysis was performed by one-way ANOVA with Tukey’s test for multiple comparison (confidence interval = 95%). An additional statistical comparison of the means of the two primary groups of interest (5xFAD vs. 5xFAD-Thy1-Cre) was performed by a two-tailed Student’s t-test and the respective p-value is depicted in the figure. Statistics for (B–D,E,G,H,J) were performed by unpaired two-tailed Student’s t-test. Means ± SEM. (#) if P ≤ 0.1, () if P ≤ 0.05, or (∗∗) if P ≤ 0.01.
FIGURE 4
FIGURE 4
Improved learning and memory in 5xFAD-Thy1-Cre mice (pt. 1). (A) Experimental set-up of the active place avoidance test. Mice are placed on a rotating platform and visual cues outline the R0 shock area. Upon entering the R0 area, mice receive mild electric stimuli until leaving the area. An initial trial (habituation) without electric stimulation is followed by eight training trials with electric stimulation. One recall trial without shocks is carried out 24 h later. (B–E) Mice were tracked during each trial and the following parameters were monitored: visits/distance (B), latency to first R0 entry (C), time spent in R0 (D), and number of shocks received (E). Learning to avoid R0 during the training trials is improved in 5xFAD-Thy1-Cre mice, compared to 5xFAD mice (n = 8 control; 7 5xFAD; 10 Thy1-Cre; 9 5xFAD-Thy1-Cre mice). Additionally, the respective area under the curve (AUC) was determined for each mouse, and resulting means of the four mouse groups are depicted. Means ± SEM. Statistical analysis for all groups and for each time point was performed by one-way ANOVA with Tukey’s test for multiple comparison (confidence interval = 95%). Consequently, in (B–E), the red stars denote the significance for the comparison 5xFAD vs. 5xFAD-Thy1-Cre mice.
FIGURE 5
FIGURE 5
Improved learning and memory in 5xFAD-Thy1-Cre mice (pt. 2). (A–D) During a recall trial, the visits/distance (A), latency to first R0 entry (B), time spent in R0 (C), and number of shocks received (D) were monitored. As mice do not receive electric shocks during recall, the graph (D) monitors the hypothetical shocks mice would have received during their stay in R0 (n = 8 control; 7 5xFAD; 10 Thy1-Cre; 9 5xFAD-Thy1-Cre mice). (E) 5xFAD-Thy1-Cre mice perform better than 5xFAD mice during a spontaneous Y-maze alternation test (n = 17 control; 12 5xFAD; 12 Thy1-Cre; 7 5xFAD-Thy1-Cre mice). (F) Activity and explorative behavior in the Y-maze is comparable between all groups of mice. Means ± SEM. Statistical analysis for all four groups was performed by one-way ANOVA with Tukey’s test for multiple comparison (95% confidence interval). An additional statistical comparison of the means of the two primary groups of interest (5xFAD vs. 5xFAD-Thy1-Cre) was performed by a two-tailed Student’s t-test and respective p-values are depicted in the figure.
FIGURE 6
FIGURE 6
5xFAD-Thy1-Cre mice are protected from spine loss. (A) ISH confirms that non-tamoxifen-induced Ugcgf/f//Thy1-CreERT2/EYFP mice (n.i. control) and non-induced 5xFAD/Ugcgf/f//Thy1-CreERT2/EYFP mice (n.i. 5xFAD) express GCS in EYFP-fluorescent neurons (scale bar = 10 μm). The original brown ISH dots have been converted to red fluorescence, as described in Materials and Methods section. For comparison, the original images are depicted in Supplementary Figure 7A. Non-induced mice received solvent injections without tamoxifen. (B) The morphology of EYFP-fluorescent dendrites in the hippocampal dentate gyrus (between lateral 0.96 and 1.2 mm (sagittal)) was analyzed by confocal microscopy and subsequent z-stack reconstruction. A loss of spines is observed in n.i. 5xFAD mice, when compared to n.i. control mice. Intriguingly, spine loss is not observed in 5xFAD-Thy1-Cre mice (n = 88 (n.i. control); 122 (n.i. 5xFAD); 156 (Thy1-Cre); 227 (5xFAD-Thy1-Cre) dendritic ROIs from n = 3 mice per group; scale bar = 5 μm). Means ± SEM. Statistical analysis for all four groups was performed by one-way ANOVA with Tukey’s test for multiple comparison (95% confidence interval).
FIGURE 7
FIGURE 7
Thickening of astrocytic processes and expression of TNF-α and IL1-α are less pronounced in 5xFAD-Thy1-Cre mice. (A) A glial fibrillary acidic protein (GFAP) staining of astrocytes in the hippocampal dentate gyrus (between lateral 0.96 and 1.2 mm (sagittal)) depicts astrocytic processes. Astrocytic process width is significantly elevated in 5xFAD mice. In comparison to 5xFAD mice, the thickening of astrocytic processes is less pronounced in 5xFAD-Thy1-Cre mice (n = 348 (control); 378 (5xFAD); 320 (Thy1-Cre); 312 (5xFAD-Thy1-Cre) projections derived from 73 control, 88 5xFAD, 68 Thy1-Cre, 74 5xFAD-Thy1-Cre cells (three mice per group); scale bar = 50 μm). (B) A quantitative mRNA expression analysis from hippocampal tissue shows that GFAP expression is elevated in both 5xFAD and 5xFAD-Thy1-Cre mice. Expression levels have been normalized to glyceraldehyde-3-phosphate dehydrogenase (GAPDH) expression (n = 7 control; 5 5xFAD; 9 Thy1-Cre; 8 5xFAD-Thy1-Cre mice). (C) An ISH shows that glial cells of Thy1-Cre mice express Ugcg mRNA and that they are not targeted by GCS deletion (scale bar = 10 μm). The original brown ISH dots have been converted to purple fluorescence, as described in the respective Materials and Methods section. For comparison, the original image is depicted in Supplementary Figure 8A. (D) The number of ionized calcium binding adaptor molecule 1 (Iba1)-positive microglia is elevated in dentate gyrus, CA1, and cerebral cortex of both 5xFAD and 5xFAD-Thy1-Cre mice (n = 7 (control, Thy1-Cre, 5xFAD) and 8 (5xFAD-Thy1-Cre) sections (ROIs) derived from 5 control or 5xFAD-Thy1-Cre and 4 5xFAD or Thy1-Cre mice). (E) A quantitative mRNA expression analysis from hippocampal tissue shows that IL1-β expression is significantly elevated in both 5xFAD and 5xFAD-Thy1-Cre mice. Expression levels have been normalized to GAPDH expression (n = 7 control; 5 5xFAD; 9 Thy1-Cre; 8 5xFAD-Thy1-Cre mice). (F,G) Quantitative mRNA expression analyses from hippocampal tissue show that tumor necrosis factor-α (TNF-α) and interleukin 1-α (IL1-α) expression levels are significantly elevated in 5xFAD mice. However, the expression of these cytokines is not significantly elevated in 5xFAD-Thy1-Cre mice. Expression levels have been normalized to GAPDH expression (n = 7 control, 5 5xFAD, 9 Thy1-Cre, 8 5xFAD-Thy1-Cre mice). Means ± SEM. Statistical analysis for all four groups was performed by one-way ANOVA with Tukey’s test for multiple comparison (95% confidence interval). Means ± SEM.

Similar articles

Cited by

References

    1. Ahlijanian M. K., Barrezueta N. X., Williams R. D., Jakowski A., Kowsz K. P., McCarthy S., et al. (2000). Hyperphosphorylated tau and neurofilament and cytoskeletal disruptions in mice overexpressing human p25, an activator of cdk5. Proc. Natl. Acad. Sci. 97 2910–2915. 10.1073/pnas.040577797 - DOI - PMC - PubMed
    1. Ariga T., Itokazu Y., McDonald M. P., Hirabayashi Y., Ando S., Yu R. K. (2013). Brain gangliosides of a transgenic mouse model of Alzheimer’s disease with deficiency in GD3-synthase: expression of elevated levels of a cholinergic-specific ganglioside, GT1aα. ASN Neuro 5 141–148. 10.1042/AN20130006 - DOI - PMC - PubMed
    1. Ariga T., McDonald M. P., Yu R. K. (2008). Role of ganglioside metabolism in the pathogenesis of Alzheimer’s disease–a review. J. Lipid Res. 49 1157–1175. 10.1194/jlr.R800007-JLR200 - DOI - PMC - PubMed
    1. Ariga T., Yanagisawa M., Wakade C., Ando S., Buccafusco J. J., McDonald M. P., et al. (2010). Ganglioside metabolism in a transgenic mouse model of Alzheimer’s disease: expression of Chol-1α antigens in the brain. ASN Neuro 2 e00044. 10.1042/AN20100021 - DOI - PMC - PubMed
    1. Barrow C. J., Small D. H. (eds) (2007). Abeta Peptide and Alzheimer’s Disease. London: Springer London; 10.1007/978-1-84628-440-3 - DOI

LinkOut - more resources