. 2018 Jul 12;174(2):391-405.e19.
doi: 10.1016/j.cell.2018.05.043. Epub 2018 Jun 21.

A LINE1-Nucleolin Partnership Regulates Early Development and ESC Identity

Affiliations

A LINE1-Nucleolin Partnership Regulates Early Development and ESC Identity

Michelle Percharde et al. Cell. .

Abstract

Transposable elements represent nearly half of mammalian genomes and are generally described as parasites, or "junk DNA." The LINE1 retrotransposon is the most abundant class and is thought to be deleterious for cells, yet it is paradoxically highly expressed during early development. Here, we report that LINE1 plays essential roles in mouse embryonic stem cells (ESCs) and pre-implantation embryos. In ESCs, LINE1 acts as a nuclear RNA scaffold that recruits Nucleolin and Kap1/Trim28 to repress Dux, the master activator of a transcriptional program specific to the 2-cell embryo. In parallel, LINE1 RNA mediates binding of Nucleolin and Kap1 to rDNA, promoting rRNA synthesis and ESC self-renewal. In embryos, LINE1 RNA is required for Dux silencing, synthesis of rRNA, and exit from the 2-cell stage. The results reveal an essential partnership between LINE1 RNA, Nucleolin, Kap1, and peri-nucleolar chromatin in the regulation of transcription, developmental potency, and ESC self-renewal.

Keywords: 2-cell stage; Dux; ESCs; Kap1; LINE1; MERVL; Nucleolin; hypertranscription; rRNA; retrotransposons.


Conflict of interest statement

Declaration of Interests

The authors declare no competing interests.

Figures

Figure 1
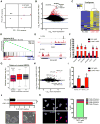
Figure 1. LINE1 RNA is nuclear localized in ES cells and is essential for self-renewal
(A) LINE1 RNA FISH in ES cells, in the indicated conditions. Scale bar, 10μm. (B) LINE1 RNA FISH in mouse 2-cell embryos and blastocysts. Scale bar, 20μm. (C) Schematic of full-length LINE1 mRNA indicating the positions of the inter-ORF LINE1 ASO and the two independent siRNA sequences used in this study. The reverse complement (RC) of the LINE1 ASO is used throughout as a negative control. (D) Workflow of LINE1 experiments. (E) RNA FISH in ES cells showing nuclear LINE1 depletion 48h following nucleofection with LINE1 ASO. LINE1 RNA foci per cell were quantified in each condition from multiple fields, with mean +/− s.d indicated. Scale bar, 10μm. (F) Representative images and quantification of the number of AP-positive colonies 5–6 days after initial plating. Data are mean +/− s.e.m., n=3 biological replicates. See also Figure S1.
Figure 2
Figure 2. LINE1 knockdown causes upregulation of 2C genes and MERVL
(A) PCA plot for all genes across all samples, showing that LINE1 KD ES cells have distinct gene expression profiles and are separated from controls along PC1. (B) MA plot showing log2 fold-changes in the expression of each gene following LINE1 KD. Horizontal red or blue lines indicate FDR <0.05 and log2 fold-chance (FC) of > 0.7 or < −0.7, respectively. Select upregulated 2-cell (2C) genes are labeled in black. (C) Heatmap showing expression changes of 142 2C genes as defined in (Macfarlan et al., 2012), upon LINE1 KD. (D) GSEA for 2C genes as in (C) showing a preferential upregulation of nearly all genes upon LINE1 KD. (E) Browser RNA-seq screenshots of 2C genes Zscan4d and Dub1 in RC or LINE1 ASO samples. (F) qRT-PCR validation of 2C gene upregulation following LINE1 KD with ASOs. Data are mean +/− s.e.m., n=3 biological replicates. (G). Distance analysis performed on the indicated sets of genes, calculating of log2 absolute distance in base-pairs (bp) to the nearest MERVL element. 2C/ASO intersect: 52 2C genes from (Macfarlan et al., 2012) also significantly upregulated with LINE KD; ASO upregulated: all significantly upregulated genes upon LINE1 KD. **P < 0.01, two-sided Wilcoxon rank sum test, calculated between 2C/ASO intersect and all expressed genes. (H) MA plot showing log2 fold-changes in repeat expression following LINE1 KD. Upregulated MERVL repeats, and downregulated rRNA repeats, are indicated. (I) qRT-PCR validation of MERVL expression following LINE1 KD. Data are mean +/− s.e.m., n=3 biological replicates. (J) Percentage of 2C-like cells and representative micrographs in 2C-GFP reporter ES cells 48h after nucleofection with ASOs. Data are mean +/− s.e.m of 2 independent experiments. (K) Immunofluorescence analysis of LINE1 KD-induced 2C-like cells. Graph depicts the percentage of GFP+ cells that have the expected features (loss of chromocenters and Oct4 protein). Scale bar, 10μm, n=number of cells. See also Figure S2 and Table S1.
Figure 3
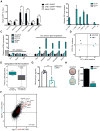
Figure 3. The activation of the 2C program induced by LINE1 knockdown is Dux-dependent
(A) qRT-PCR showing Dux upregulation with LINE1 KD. Data are mean +/− s.e.m., n=4 biological replicates. (B) Boxplot analysis of significantly altered genes (FDR <0.05) upon LINE1 KD, showing that Dux targets are significantly more induced than non-targets. P-value is determined by two-sided Wilcoxon rank sum test. (C) Workflow of LINE1/Dux knockdown experiments. (D) Heatmap showing suppression of induction of Dux and top Dux target genes, defined as in (B), in LINE1 KD cells upon simultaneous Dux KD. (E–F) MA plots of repeat expression changes in LINE1 vs RC ASO treatment, either with transfection of (E) siControl or (F) siDux. (G) qRT-PCR validation of 2C gene and MERVL rescue following Dux depletion. Data are representative of 3 independent experiments, shown is mean +/− s.e.m., n=3 technical replicates. See also Figure S3 and Table S2.
Figure 4
Figure 4. LINE1 promotes translation and ES self-renewal independently of Dux
(A) Colony-formation assay showing that Dux knockdown does not rescue self-renewal upon LINE1 KD. Data are mean +/− s.e.m., n=3 biological replicates. (B–C) GSEA plot showing preferential downregulation of the KEGG ribosome pathway following LINE1 KD, with either co-transfection of (B) Control or (C) Dux siRNAs. (D) RNA per cell in ES cells 48h after nucleofection with RC or LINE1 ASOs. Data are mean +/− s.e.m., n=6 independent batches of equal numbers of cells. (E) Diagram of experiments labelling nascent RNA/proteins with EU/HPG following ASO nucleofection. (F) Representative histogram (left) of nascent transcription in RC or LINE1 ASO-treated samples 24–48h after nucleofection, with cells incubated without EU shown as control, and quantification (right) showing the relative decrease in translation upon LINE1 KD. Data are = mean +/− s.e.m., n=2 independent experiments. (G) qRT-PCR showing decrease in rRNA and ribosomal protein gene expression 48h after LINE1 KD, shown as mean +/− s.e.m, n=3 biological replicates. (H) Representative histogram (left) and quantification (right) as in (G), but performed for HPG incubations 48h after LINE1 KD. Data are = mean +/− s.e.m., n=4 independent experiments. See also Figure S4.
Figure 5
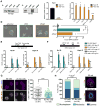
Figure 5. LINE1 RNA interacts with Nucleolin to coordinately repress Dux and activate rRNA synthesis
(A) ChIRP enrichment in wild-type ES cells at the indicated DNA loci, using biotinylated probes against LINE1 RNA. Intergenic-chromosome 11 (int-chr11) and Rpl3-TSS are shown as negative regions. Data are mean +/− s.e.m., n=3 independent experiments. (B) RIP in wild-type ES cells with Nucleolin (Ncl) or control IgG antibodies, showing Ncl association with the indicated RNAs. Pre-rRNA is shown as a positive control. Data are mean +/− s.e.m., n=2 independent experiments, and shown as % input normalized to Malat1 RNA. (C) qRT-PCR showing knockdown of candidate 2C/Dux repressors alongside Dux and 2C gene expression. Data are representative of two independent experiments and are mean +/− s.e.m., n=3 technical replicates. (D) PCA plot for all genes across all samples, showing that Ncl KD ES cells have distinct gene expression profiles and are separated from controls along PC1. (E) Boxplot analysis of significantly altered genes (FDR <0.05) upon Ncl knockdown, revealing that Dux targets are significantly more induced than non-targets (see Fig. 3B). P-value is determined by two-sided Wilcoxon rank sum test. (F) Scatter plot showing the log2 fold-change (FC) in the expression of all genes following LINE1 KD (x axis) or Ncl KD (y axis). Dux targets are indicated in red, with select 2C genes labelled in black. The Spearman’s correlation coefficient is indicated. (G) RNA per cell in ES cells 48h after transfection with control or Ncl siRNAs. Data are mean +/− s.e.m., n=4 independent batches of equal numbers of cells. (H) Colony-formation assay in ES cells following transfection with control or Ncl siRNAs. Data are mean +/− s.e.m., n=3 biological replicates. See also Figure S5 and Table S3.
Figure 6
Figure 6. LINE1 promotes binding of Nucleolin and Kap1 to Dux and rDNA
(A) Co-IP showing association of endogenous Kap1 and Ncl proteins in ES cells. (B–C) qRT-PCR confirming (B) Kap1 deletion and (C) upregulation of Dux, 2C genes, and ERVs. Data are mean +/− s.e.m, n=3 biological replicates. (D) Representative micrographs (left) and percentage of 2C-like cells (right) in 2C-GFP reporter ES cells 3 days following siRNA KD of Ncl or Kap1, in n=2 independent experiments. (E–F) ChIP assays for Ncl and Kap1 at (E) Dux and (F) rDNA, with or without LINE1 KD. Data are shown as % input normalized to enrichment at int-chr11 negative control region, and are mean +/− s.e.m., n=3 independent experiments for Ncl ChIP, and n=2 independent experiments, Kap1 ChIP. (G) Example images and quantification of nuclear LINE1 RNA foci by RNA-FISH in ES cells (2C-GFP-) or 2C-like cells (2C-GFP+), representative of 2 experiments. Scale bar, 10μm, n=number of cells. (H) Representative images and quantification of distinct localization patterns of Dux loci in ES vs 2C-like cells by IF for Ncl combined with Dux DNA-FISH, using 2C-GFP reporter ES cells. Nucleoli are labeled with Ncl antibodies. Example Dux loci are indicated (white arrows), showing two nucleolar loci in an ES cell vs one nucleoplasmic locus in a 2C-like cell. Statistics are calculated by Chi-squared test for the indicated number (n) of Dux loci. Scale bar, 2μm. See also Figure S6.
Figure 7
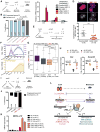
Figure 7. LINE1 regulates Dux silencing, rRNA synthesis and early development
(A) Summary diagram of ASO microinjection experiments in panels (B–D). (B) Developmental progression in the indicated number (n) of embryos following ASO microinjections, collected in 3 independent experiments. χ2 P-values were calculated for the developmental rate of embryos injected with LINE1 or Control ASOs. (C) qRT-PCR for the indicated genes in late 2-cell (2C) embryos harvested 24h post injection. Data are mean +/− s.e.m., n=3 technical replicates, showing 2 independent experiments. (D) 18S RNA FISH in late 2C embryos 24h following microinjection with Control or LINE1 ASOs, with nuclei stained by DAPI. Nuclear or cytoplasmic foci were counted in each embryo and plotted below as 18S cytoplasmic/nuclear ratio. Data show mean +/− s.d from the indicated number (n) of embryos from 2 independent experiments. Scale bar, 20μm. (E) Summary diagram of 0.5X ASO microinjection experiments for RNA-seq in panels (F–H). (F) RNA-seq data from (Wu et al., 2016), showing mean FPKM expression relative to MII oocyte for the indicated gene sets identified by K-means clustering, or for ZGA genes defined in (Zeng and Schultz, 2005). Shading denotes mean +/− s.e.m at each time point. (G) Boxplot depicting the log2-fold change in 4-cell (4C) embryos upon LINE1 KD for the indicated number (n) of gene sets displayed in (G), compared to all expressed genes. P-value, two-sided Wilcoxon rank sum test. (H) Examples of the expression of early 2C genes, Dux and Zscan4d, in the indicated embryo samples. P-value, toptable FDR, showing n=3 samples per condition. (I) Summary diagram of late 2C ASO microinjection experiments in panels (J–K). (J) Developmental progression in the indicated embryos following late 2C ASO microinjections. χ2 P-values were calculated for the developmental rate of the number (n) of embryos injected with 1X RC or LINE1 ASOs. (K) qRT-PCR analysis of MERVL expression in 4C or 5–8C embryos following late 2C microinjections with ASOs. Data are mean +/− s.e.m n=3 technical replicates and are representative of 3 (LINE1 ASO) or 2 (RC ASO) independent experiments. (L) Model for the role of LINE1 in early development and ES cells. LINE1 acts as an RNA-scaffold and binds to rDNA and Dux. LINE1 RNA-Ncl-Kap1 cooperate to turn off the 2C gene expression program and promote high levels of ribosome biosynthesis during early development. See also Figure S7 and Table S4.

Comment in

Similar articles

Cited by

References

    1. An W, Han JS, Wheelan SJ, Davis ES, Coombes CE, Ye P, Triplett C, Boeke JD. Active retrotransposition by a synthetic L1 element in mice. Proc Natl Acad Sci U S A. 2006;103:18662–7. - PMC - PubMed
    1. Beraldi R, Pittoggi C, Sciamanna I, Mattei E, Spadafora C. Expression of LINE-1 retroposons is essential for murine preimplantation development. Mol Reprod Dev. 2006;73:279–87. - PubMed
    1. Borsos M, Torres-Padilla ME. Building up the nucleus: nuclear organization in the establishment of totipotency and pluripotency during mammalian development. Genes Dev. 2016;30:611–21. - PMC - PubMed
    1. Bourque G. Transposable elements in gene regulation and in the evolution of vertebrate genomes. Curr Opin Genet Dev. 2009;19:607–12. - PubMed
    1. Bulut-Karslioglu A, Macrae TA, Oses-Prieto JA, Covarrubias S, Percharde M, Ku G, Diaz A, Mcmanus MT, Burlingame AL, Ramalho-Santos M. The Transcriptionally Permissive Chromatin State of Embryonic Stem Cells Is Acutely Tuned to Translational Output. Cell Stem Cell. 2018;22:369–383. e8. - PMC - PubMed

Publication types

MeSH terms