. 2018 Jun 22;11(1):34.
doi: 10.1186/s13072-018-0204-2.

Episomal HBV persistence within transcribed host nuclear chromatin compartments involves HBx

Affiliations

Episomal HBV persistence within transcribed host nuclear chromatin compartments involves HBx

Kai O Hensel et al. Epigenetics Chromatin. .

Abstract

Background: In hepatocyte nuclei, hepatitis B virus (HBV) genomes occur episomally as covalently closed circular DNA (cccDNA). The HBV X protein (HBx) is required to initiate and maintain HBV replication. The functional nuclear localization of cccDNA and HBx remains unexplored.

Results: To identify virus-host genome interactions and the underlying nuclear landscape for the first time, we combined circular chromosome conformation capture (4C) with RNA-seq and ChIP-seq. Moreover, we studied HBx-binding to HBV episomes. In HBV-positive HepaRG hepatocytes, we observed preferential association of HBV episomes and HBx with actively transcribed nuclear domains on the host genome correlating in size with constrained topological units of chromatin. Interestingly, HBx alone occupied transcribed chromatin domains. Silencing of native HBx caused reduced episomal HBV stability.

Conclusions: As part of the HBV episome, HBx might stabilize HBV episomal nuclear localization. Our observations may contribute to the understanding of long-term episomal stability and the facilitation of viral persistence. The exact mechanism by which HBx contributes to HBV nuclear persistence warrants further investigations.

Keywords: Chromatin fiber loops; Epigenome; Episome; HBxAg; Host–pathogen interaction; Oncogene; Supranucleosomal structure; TADs; Transcription factories; X-protein.


Figures
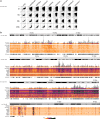
Fig. 1
Fig. 1
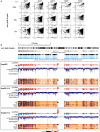
Correlative analyses of HBx-hepatocyte genome association, transcriptomics, Pol2 and several chromatin structure markers on chromosomes 1, 3, 15 and Y in MMH-D3 cells. a We performed correlation analyses of NLS-HBx-RFP with respect to Pol2 and several histone modifications. To assess the resolution of putative correlation, we applied different bin sizes for analyses. The graphs illustrate exemplarily for chromosome 15, how R2 increases for Pol2, H3K36me3, H3K36ac and H3K4me3, when larger resolution windows of 50 or 250 kb were selected. b This sub-figure comprehensively outlines massive parallel sequencing derived whole-genome data for chromosomes 1, 3, 15 and Y (from top to bottom). For each chromosome, the following data are presented (in the order from top to bottom): chromosomal structure, transcriptome, GC-content (both obtained from the UCSC genome browser), ChIP-seq derived enrichment of Pol2, NLS-HBx-RFP, H3K36ac, H3K36me3, H3K4me3, H3K4me1, H3K27ac, H3K27me3, H3K9ac and H3K9me3. Below, the position of RefSeq genes is indicated (obtained from the UCSC genome browser). The degree of enrichment is color-coded as indicated in the legend on the bottom of the figure. On four different chromosomes, this figure demonstrates a correlation using a 50 kb bin size for analyses of HBx mapping and gene transcription, Pol2 mapping as well as enrichment of PTMs that have been associated with active gene transcription. In contrast, repressive PTMs do not exhibit a correlative mapping pattern with HBx enrichment
Fig. 2
Fig. 2
Co-immunoprecipitation of several transfected HBx-constructs and cccDNA as well as co-localization analyses using the F2H cell system. a HBV occurs as several different genotypes and sub-genotypes. a Shows the alignment of HBx protein sequences for HBV genotypes A–H including sub-genotypes. Sequential agreement is shaded in black, common variations are gray, single differences are highlighted white. This figure demonstrates four regions with a large degree of agreement (indicated as blocks A–D below the protein sequences) and variation mostly between those regions. Outlined below is a scheme of several HBx-constructs that were used in subsequent experiments. Specifically, the constructs feature a nuclear localization signal as well as an RFP signal and either the full-length HBx (first row) or HBx depleted by blocks A, B, C or D (rows 2–5). As a control, full-length HBx-RFP with a nuclear export signal was used (not shown in this figure). b This genomic HBV map illustrates the features of RC DNA, the position of restriction sites of interest as well as the amplified regions (1–4; green lines) targeted by specific primer pairs used in this study. The red arrow points to the nick region of the minus-RC DNA strand. c Analyses of cccDNA association with nuclear HBx-RFP complexes enriched by immunoprecipitation. Results are shown from semiquantitative PCR HBV cccDNA which was amplified with two different primer pairs resulting in 579 bp (genotype D3) or 100 bp amplicons, respectively. RFP (92 bp) amplicons were used to assess the plasmid load; Lamin A/C (LMNA, 120 bp) amplicons were used to assess the amount of host genomic DNA per sample. Notably, the signal for cccDNA when HBx-ΔD-GFP was immunoprecipitated is significantly weaker when compared to the other, clearly visible bands. d qPCR derived analysis of cccDNA enrichment utilizing IP directed against HBx-RFP. This figure outlines the fold change in gene expression of cccDNA, normalized to the cccDNA signal when full-length HBx-RFP was pulled down. Importantly, the signal for HBx-ΔD-GFP derived cccDNA is significantly attenuated. **Indicates p < 0.05. e Results of sequential image acquisition in F2H assays, where HBx(wt)-GFP spots co-localized with faint HBV genome FISH signals (left image quartet). In contrast, no HBV genome FISH signals could be identified, when HBx-ΔD-GFP was used for co-transfection (right image quartet), although the GFP spots were not distinguishable in both experiments. The phase contrast-like field of view was used to identify overlapping slide areas before and after FISH (not shown). Dashed circles mark areas with nuclei where the GFP-binding platform was localized
Fig. 3
Fig. 3
Correlative analyses of HBV cccDNA-hepatocyte genome association and several chromatin structure markers on chromosome 1 in HepaRG, HepG2.2.15 and HepG2 H1.3 cells. a We performed correlation analyses between sites of HBV cccDNA enrichment with respect to transcribed regions. To assess the resolution of putative correlations, we applied different bin sizes for analyses. The graphs quintessentially illustrate chromosome 1 in three different cell lines (HepaRG, HepG2.2.15, HepG2H1.3) and chromosomes 18 and 19 in HepaRG cells. Importantly, R2 indicates best correlation when larger resolution windows of 50 kb or 250 kb were selected. b At the top a human chromosome 1 ideogram is outlined as a reference, including GC content and DNase I hypersensitivity (both taken from the UCSC genome browser). DNase I hypersensitivity peaks are presented in grayscale and signals in blue scale. Below, genome-wide data from 4C and ChIP-seq mapping of HBx and cccDNA are presented for chromosome 1 in three different human hepatocyte cell lines (HepaRG, HepG2.2.15 and HepG2 H1.3 cells), each in a separate box. For each cell line (from top to bottom) this figure shows 4C-derived cccDNA enrichment, HBx enrichment (displayed as a negative signal for the sake of readability), the degree of correlation of cccDNA and genomic mRNA transcription and cccDNA transcription (displayed as a negative signal for the sake of readability). For HepaRG the gene transcription track is an overlay of 4 different time points from day 0 of infection to day 12 post-infection. Below indicated are CHIP-seq derived enrichments of cccDNA, HBx, Pol2, H3K36me3 and H3K4me3. The color-coding reference of the degrees of correlation and coverage are indicated in the legend at the bottom of the figure. This figure reveals correlative mapping using a 50 kb bin size for analyses of HBx and cccDNA with respect to the GC content track and DNase I hypersensitivity (top), gene transcription, Pol2, H3K36me3 and H3K4me3 (see also: https://genome.ucsc.edu/cgi-bin/hgTracks?hgS_doOtherUser=submit&hgS_otherUserName=janzop&hgS_otherUserSessionName=hsa_all_cccDNA_HBx_mRNA). Further examples of human chromosomes 18 (gene poor) and 19 (gene rich) are shown in Additional file 1: Figure S5
Fig. 4
Fig. 4
Several euchromatin markers are enriched at HBV cccDNA, and suppression of HBx-mRNA expression via FANA antisense oligonucleotides leads to a reduction in episomal HBV DNA in HepG2.2.15 cells. a This figure outlines (from top to bottom) RNA-seq data for cccDNA mRNA transcription (consensus data from HepaRG, HepG2.2.15 and HepG2 H1.3), as well as ChIP-seq derived enrichment of Pol2 (dark blue tracks), H3K4me3 (cyan), H3K36me3 (green), H3K27me3 (red) and HBx (gray). Enrichment peaks are indicated at the top, and read coverage is presented below. Results from RNA-seq suggest that remarkable amounts of mRNA are synthesized from ORF S and ORF X. ChIP-seq reveals that in these cells ‘active’ transcription markers, such as Pol2 and H3K4me3, are enriched at HBV cccDNA. The highest amount of H3K36me3 seemed to be present at the 3′-ends of ORF S and ORF X, whereas comparably low amounts of H3K27me3 were associated with cccDNA. b This diagram presents the localization of ORFs, CpG islands (major CpG islands: I–III; minor CpG islands not detected in all genotypes: IV–VI) and the GC content (adapted from Hensel et al. [66]). c This figure outlines a time course of episomal HBV DNA quantification by PCR in HepG2.2.15 cells under the influence of FANA oligonucleotide treatment targeting HBx-mRNA. Specifically, two different oligos (HBx-oligo1/HBx-oligo2) or an oligo mixture (HBx-oligo-mix) was used to suppress HBx-mRNA. For normalization, we performed similar experiments where a scrambled non-sense FANA oligonucleotide was used. This figure demonstrates the increasing attenuation of HBV DNA over time under the influence of FANA oligonucleotide anti-HBx treatment
Fig. 5
Fig. 5
Localization of HBx and HBV episomes in the context of 3D nuclear topology. The graphic illustrates a model for the implementation of activity-associated nuclear HBV localization into current concepts of nuclear higher-order organization. HBx is associated with the HBV episome via C-terminal binding and this complex translocates to sites of active gene expression, which were previously proposed to be organized as focal ‘transcription factories’—functional assemblies of factors and templates involved in transcription—residing in the interchromatin compartment. Actively transcribed chromatin extrudes from the surface of supranucleosomal chromatin structures (domain units) into an adjacent perichromatin compartment to come in contact with transcription factories and other processing machineries [–20, 24]

Similar articles

Cited by

References

    1. WHO. WHO factsheet. 2015. http://wwwwhoint/mediacentre/factsheets/fs204/en/.
    1. Trepo C, Chan HL, Lok A. Hepatitis B virus infection. Lancet. 2014;384(9959):2053–2063. doi: 10.1016/S0140-6736(14)60220-8. - DOI - PubMed
    1. Lozano R, Naghavi M, Foreman K, Lim S, Shibuya K, Aboyans V, Abraham J, Adair T, Aggarwal R, Ahn SY, et al. Global and regional mortality from 235 causes of death for 20 age groups in 1990 and 2010: a systematic analysis for the Global Burden of Disease Study 2010. Lancet. 2012;380(9859):2095–2128. doi: 10.1016/S0140-6736(12)61728-0. - DOI - PMC - PubMed
    1. Di Bisceglie AM. Hepatitis B and hepatocellular carcinoma. Hepatology (Baltimore, MD) 2009;49(5 Suppl):S56–S60. doi: 10.1002/hep.22962. - DOI - PMC - PubMed
    1. Protzer U, Maini MK, Knolle PA. Living in the liver: hepatic infections. Nat Rev Immunol. 2012;12(3):201–213. doi: 10.1038/nri3169. - DOI - PubMed

Publication types

MeSH terms