. 2018 Jul 15;201(2):757-771.
doi: 10.4049/jimmunol.1800158. Epub 2018 Jun 13.

Dual Roles for Ikaros in Regulation of Macrophage Chromatin State and Inflammatory Gene Expression

Affiliations

Dual Roles for Ikaros in Regulation of Macrophage Chromatin State and Inflammatory Gene Expression

Kyu-Seon Oh et al. J Immunol. .

Abstract

Macrophage activation by bacterial LPS leads to induction of a complex inflammatory gene program dependent on numerous transcription factor families. The transcription factor Ikaros has been shown to play a critical role in lymphoid cell development and differentiation; however, its function in myeloid cells and innate immune responses is less appreciated. Using comprehensive genomic analysis of Ikaros-dependent transcription, DNA binding, and chromatin accessibility, we describe unexpected dual repressor and activator functions for Ikaros in the LPS response of murine macrophages. Consistent with the described function of Ikaros as transcriptional repressor, Ikzf1-/- macrophages showed enhanced induction for select responses. In contrast, we observed a dramatic defect in expression of many delayed LPS response genes, and chromatin immunoprecipitation sequencing analyses support a key role for Ikaros in sustained NF-κB chromatin binding. Decreased Ikaros expression in Ikzf1+/- mice and human cells dampens these Ikaros-enhanced inflammatory responses, highlighting the importance of quantitative control of Ikaros protein level for its activator function. In the absence of Ikaros, a constitutively open chromatin state was coincident with dysregulation of LPS-induced chromatin remodeling, gene expression, and cytokine responses. Together, our data suggest a central role for Ikaros in coordinating the complex macrophage transcriptional program in response to pathogen challenge.


Conflict of interest statement

Competing interests

The authors declare that they have no competing interests.

Figures
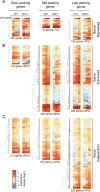
Figure 1
Figure 1. Ikaros is required to sustain the LPS-induced gene program
WT and Ikzf1−/− BMDMs were stimulated with 10 ng/ml LPS for 2, 4 and 10 hr and RNA expression levels (fold change log2 FPKM from baseline) were compared by RNA-seq. (A) Genes whose expression is repressed by Ikaros (2 fold minimum increase in Ikzf1−/− versus WT in at least one time point). (B) Genes whose expression is enhanced by Ikaros (2 fold minimum decrease in Ikzf1−/− versus WT in at least one time point). (C) Genes whose expression is unaffected by Ikaros. Data were averaged from two independent experiments (see also Supplementary file S1 and Methods).
Figure 2
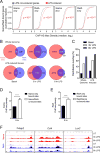
Figure 2. Ikaros exhibits LPS-dependent chromatin binding at RelA occupied sites
Comparison of Ikaros and RelA chromatin binding in LPS-stimulated macrophages by ChIP-seq. (A) Comparison of empirical cumulative distribution functions of Ikaros and RelA bound hotspot maximum density between LPS induced and LPS non-induced genes at each time point post LPS-stimulation. Values > 0, Kolmogorov-Smirnov test p-values < 0.05. Shift in distributions suggest LPS-induced genes have greater affinity for Ikaros and RelA than LPS-non-induced genes throughout the LPS response. (B) Proportion of RelA bound hotspots that overlap with Ikaros bound hotspots during the LPS response. (C) Overlap of Ikaros and RelA bound hotspot regions throughout the LPS response both at whole genome level and at LPS-induced gene loci. (D) Comparison of average Ikaros ChIP-seq density between sites bound uniquely by Ikaros and sites co-bound with RelA. (E) Comparison of average RelA ChIP-seq density between sites bound uniquely by RelA and sites co-bound with Ikaros. (F) Genome browser images of Ikaros and RelA co-bound intragenic hotspots at Tnfaip2, Ccl4, and Lcn2 gene loci. Data in panels A-C were averaged from two independent experiments, data in panels D-E were averaged from replicate experiments (mean + s.d.) ****P < 0.0001 (two-tailed t test), while panel D shows browser tracks from a representative ChIP-seq experiment (See also Supplementary file S2).
Figure 3
Figure 3. Ikaros/RelA co-bound hotspots are enriched among Ikaros activated genes and Ikaros is required for sustained RelA binding
(A) Adjusted p-values (FDR) from Fisher’s exact test, assessing the significance for enrichment of Ikaros and RelA co-bound hotspots. Each box corresponds to a specific time point, for each of the Ikaros-dependent, LPS-induced gene expression classes. (B) Number of Ikaros and RelA co-bound hotspots overlapping at each time point in LPS-induced genes. (C) ChIP-qPCR of RelA binding at Rela and Tnf loci in WT and Ikzf1−/− BMDM stimulated with 10 ng/ml LPS for 8 hr. Data were averaged from two independent experiments. Panel C (mean + s.d.). **P < 0.01, ***P < 0.001 (two-tailed t test) (See also Supplementary file S2).
Figure 4
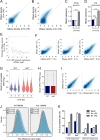
Figure 4. Dysregulated basal and LPS-induced chromatin accessibility changes in Ikzf1−/− macrophages
DNase-seq analysis of chromatin accessibility in LPS stimulated WT and Ikzf1−/− macrophages. (A and B) Smoothed scatterplots of maximum DNase-seq peak density in each given DNase-seq hotspot between different LPS treatment conditions. Larger density values correspond to greater chromatin accessibility. All values > 0. (C and D) Variance in maximum DNase-seq peak density across LPS time course at either (C) all gene loci or (D) LPS responsive genes. (E) Correlation between maximum density of basal DNase-seq promoter hotspots and the 10 hr LPS induced expression of the 95th percentile of expressed genes. Red dashed line is a non-linear fit of the curve: Y = a/(x + b), where a and b are parameters, Y := DNase-seq data shown in scatterplot, x := RNAseq data shown in scatterplot. R-squared = 0.2397542, Spearman Rank Correlation = −0.6355441, Pearson Rank Correlation = −0.5200625. (F) Smoothed scatterplots of maximum DNase-seq peak density in each given DNase-seq hotspot comparing Ikzf1−/− to WT macrophages for each LPS treatment condition (See also Fig. S4B). (G) Violin plots of maximum density of DNase-seq intragenic hotspots at 0h, 3h, 8h post-LPS stimulation in WT versus Ikzf1−/− macrophages. Black dots represent median value. (H) Comparison of basal gene expression levels in WT and Ikzf1−/− macrophages. (I) Smoothed scatterplots of maximum DNase-seq peak density in each given DNase-seq hotspot between different LPS treatment conditions in Ikzf1−/− macrophages. (J) Change in distributions of total DNase density per gene between time points post-LPS stimulation in WT versus Ikzf1−/− macrophages. (K) Proportion of all detected DNase-seq sites accessible under different ligand stimulation conditions at both LPS responsive and non-responsive gene loci in WT and Ikzf1−/− macrophages. Dnase-seq data shown were averaged from 3 (WT) or 2 (Ikzf1−/−) independent experiments. Panels C+D (mean + s.d. ****P < 0.0001 (two-tailed unpaired t test)), K (mean + 95%CI). See also Supplementary file S3.
Figure 5
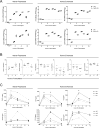
Figure 5. Ikaros has dual negative and positive regulatory roles in immune effector production in response to LPS
(A) WT and Ikzf1−/− BMDMs were stimulated with 10 ng/ml LPS for 2, 4 and 10 hr and RNA expression levels (fold change log2 FPKM from baseline) were determined by RNA-seq (See also Supplementary file S1). Expression values from replicate samples are shown for select cytokine genes. (B and C) WT, Ikzf1−/−, or Ikzf1+/− BMDM were stimulated with 10 ng/ml LPS for the times indicated and secreted cytokines were quantified by cytometric bead array. (B) Each data point represents one independent experiment (of four total) using cells from an experimentally matched pair of WT and KO mice, with data presented as the cytokine output ratio for KO/WT. (C) One representative experiment from pooled data in panel B, each point representing the average of replicate wells for BMDM from an individual mouse.
Figure 6
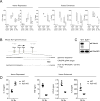
Figure 6. Ikaros has dual negative and positive regulatory roles in immune effector production in response to bacterial infection
(A) WT or Ikzf1+/− BMDM were stimulated with 10 ng/ml LPS or infected with S. typhimurium (S. Tm.) and secreted cytokines were quantified by cytometric bead array. Box plots represent BMDM from 4 WT mice and 5 HET mice, pooled from two independent experiments, and are representative of three experiments. (B) Schematic is shown to indicate the exon targeted for genome editing at the Ikzf1 mouse gene locus in RAW264.7 cells. The guide RNA (gRNA) target sequence is shown with the 3’ NGG PAM sequence, and the resulting genome edit within the gRNA is indicated. (C) Western blot showing ablated Ikaros protein expression in the Ikzf1−/− RAW264.7 cell line. (D) WT and Ikzf1−/− RAW264.7 cells were infected with formalin killed (FK) B. cenocepacia at an MOI of 1 for 24 hr and secreted cytokines were quantified by cytometric bead array. Data are representative of two or more independent experiments.
Figure 7
Figure 7. Ikaros expression level determines inflammatory cytokine output in human monocytes
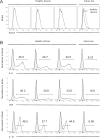
Total human PBMC from 1 ‘Ikaros low’ subject and 3 other healthy donors were stimulated with 0.5 μg/ml of LPS for 24 hr in the presence of 5 μg/ml Brefeldin A. Samples were stained intracellularly for (A) Ikaros, and (B) IL-6, TNF and IL-1β, analyzed by flow cytometry, and gated on CD11c+CD14+ monocytes. Shaded histograms in panel B represent unstimulated cells from the same individuals.
Figure 8
Figure 8. Ikaros expression correlates with inflammatory cytokine production at both the person and single cell level
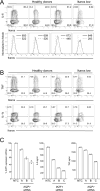
Total human human PBMC from 1 ‘Ikaros low’ subject and 3 other healthy donors were stimulated with 0.5 μg/ml of LPS for 24 hr in the presence of 5 μg/ml Brefeldin A. Samples were stained intracellularly for Ikaros, (A) IL-6 and (B) TNF and IL-1β, analyzed by flow cytometry, and gated on CD11c+CD14+ monocytes. Gating for contour plots in A and B was determined using unstimulated cells. The upper-right quadrants represent cytokine production by Ikaros+ monocytes, with the percentage of cells in each quadrant indicated on the plots. Histograms in panel A represent IL-6 positive cells (solid line histograms) and IL-6 negative cells (dashed line histograms), with the Ikaros MFI for each population shown within the plots. (C) Human MDM were treated with non-targeting control (NTC) siRNA or one of three distinct IKZF1 siRNA for 48 hr prior to IKZF1 quantification or LPS stimulation. Data points represent percent IKZF1 expression from two experiments or the concentration of cytokine detected in replicate wells from one of three representative experiments.

Similar articles

Cited by

References

    1. Medzhitov R, Preston-Hurlburt P, Janeway CA., Jr A human homologue of the Drosophila Toll protein signals activation of adaptive immunity. Nature. 1997;388:394–397. - PubMed
    1. Poltorak A, He X, Smirnova I, Liu MY, Van Huffel C, Du X, Birdwell D, Alejos E, Silva M, Galanos C, Freudenberg M, Ricciardi-Castagnoli P, Layton B, Beutler B. Defective LPS signaling in C3H/HeJ and C57BL/10ScCr mice: mutations in Tlr4 gene. Science. 1998;282:2085–2088. - PubMed
    1. Akira S, Uematsu S, Takeuchi O. Pathogen recognition and innate immunity. Cell. 2006;124:783–801. - PubMed
    1. Beutler BA. TLRs and innate immunity. Blood. 2009;113:1399–1407. - PMC - PubMed
    1. Foster SL, Medzhitov R. Gene-specific control of the TLR-induced inflammatory response. Clinical immunology. 2009;130:7–15. - PMC - PubMed

Publication types