

Mitofusin gain and loss of function drive pathogenesis in Drosophila models of CMT2A neuropathy
- PMID: 29898954
- PMCID: PMC6073211
- DOI: 10.15252/embr.201745241
Mitofusin gain and loss of function drive pathogenesis in Drosophila models of CMT2A neuropathy
Erratum in
-
Mitofusin gain and loss of function drive pathogenesis in Drosophila models of CMT2A neuropathy.EMBO Rep. 2020 Jul 3;21(7):e50703. doi: 10.15252/embr.202050703. EMBO Rep. 2020. PMID: 32618126 Free PMC article.
Abstract
Charcot-Marie-Tooth disease type 2A (CMT2A) is caused by dominant alleles of the mitochondrial pro-fusion factor Mitofusin 2 (MFN2). To address the consequences of these mutations on mitofusin activity and neuronal function, we generate Drosophila models expressing in neurons the two most frequent substitutions (R94Q and R364W, the latter never studied before) and two others localizing to similar domains (T105M and L76P). All alleles trigger locomotor deficits associated with mitochondrial depletion at neuromuscular junctions, decreased oxidative metabolism and increased mtDNA mutations, but they differently alter mitochondrial morphology and organization. Substitutions near or within the GTPase domain (R94Q, T105M) result in loss of function and provoke aggregation of unfused mitochondria. In contrast, mutations within helix bundle 1 (R364W, L76P) enhance mitochondrial fusion, as demonstrated by the rescue of mitochondrial alterations and locomotor deficits by over-expression of the fission factor DRP1. In conclusion, we show that both dominant negative and dominant active forms of mitofusin can cause CMT2A-associated defects and propose for the first time that excessive mitochondrial fusion drives CMT2A pathogenesis in a large number of patients.
Keywords: CMT2A; MFN2; mitochondrial fusion; mitofusin; peripheral neuropathy.
© 2018 The Authors.
Figures
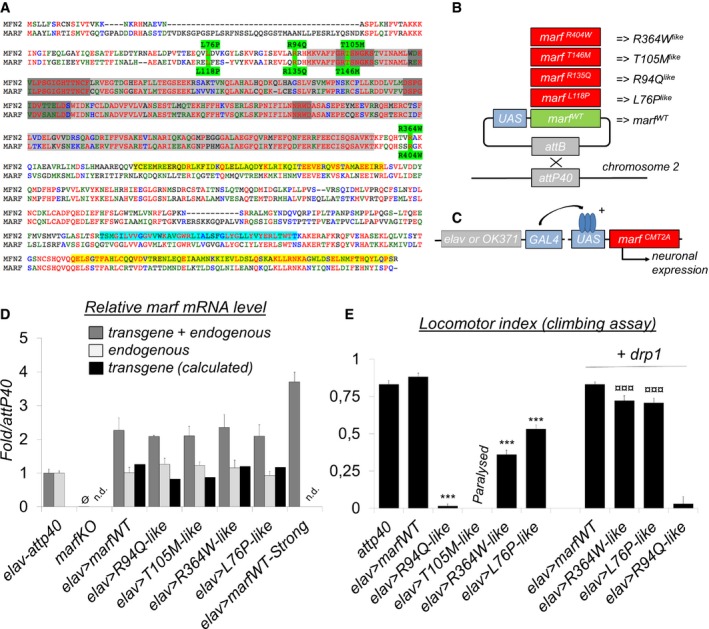
Sequence alignment of human MFN2 and Drosophila MARF. MFN2 mutations and homologous MARF residues (green), GTP‐binding domain (light gray), GTP‐binding motifs G1 to G4 (dark gray), coiled‐coil/CC domains (yellow), and transmembrane/TM domains (cyan). R94 and T105 are, respectively, located at the edge and within the GTP‐binding domain (position in folded structure see Fig EV1). L76 and R364, that appear distant in the MFN2 linear sequence, are in fact part of the same helix bundle (HB1) as shown in the folded structure (Fig EV1).
We mutated the amino acids homologous to R94, T105, R364, and L76 in the coding sequence of marf to generate the R404Q, L118P, R135Q, and T146M substitutions (referred here as R364W like, L76P like, R94Q like , and T105M like for simplicity of interpretation), and each marf allele was placed under the transcriptional control of UAS activation sequences. As a control, we similarly generated a wild‐type UAS‐marf construct. The five marf transgenes were inserted at the attP40 insertion site to insure similar genetic background and expression level.
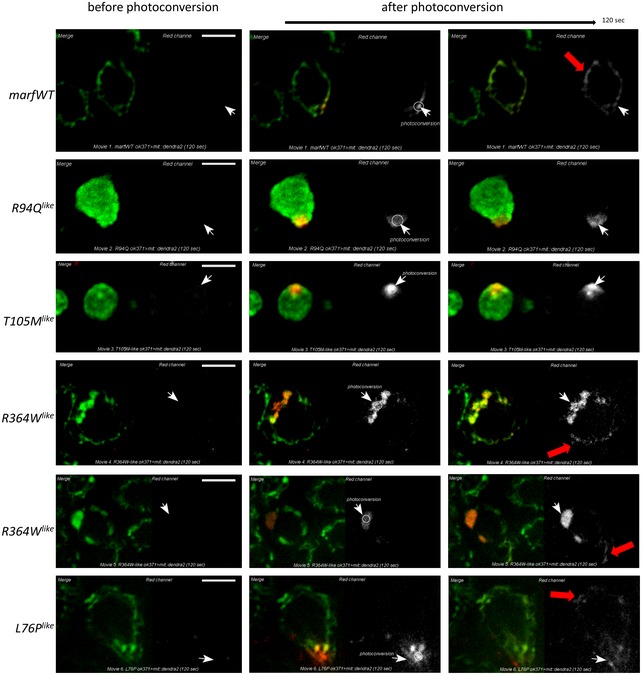
The expression of the UAS‐marf CMT2A alleles was specifically induced into the neurons of wild‐type flies using the pan‐neuronal driver elav‐GAL4 which targets all central and peripheral neurons or the glutamatergic driver OK371‐GAL4 which facilitates the imaging of motor neurons.
qRT–PCR performed on larval nervous system extracts showing marf mRNA level relative to control (elav>attp40). “transgene + endogenous”: The amplified sequence is present both in mRNAs encoded by UAS‐marf transgenes and the endogenous marf gene. “endogenous”: amplification of the 3′UTR region that is absent from mRNAs transcribed from UAS‐marf transgenes. The level of “transgene” was calculated (“transgene+endogenous”‐”endogenous”). (mRNA levels ± SD represent the mean value for two independent mRNA extracts each obtained from 12 dissected larval brains). marf KO: knockout of the marf endogenous gene deleting the whole coding sequence and abolishing mRNA expression (Ø : value close to 0) (Appendix Fig S2 for technical details). marf Strong: previously generated UAS‐marf transgene 33 inserted at a different genomic location and leading to higher expression level than the UAS‐marfWT transgene described in this study.
Result of negative geotaxis test (NGT). Flies were placed into a vertical column and tapped to the bottom to induce escape behavior. After 30 s, the flies reaching the top of the column (N top) and the flies remaining at the bottom (N bot) are counted to calculate a locomotor index (±SEM) defined as: 1/2*(N total + N top − N bot)/N total. Nine races involving three groups of 10 flies for each genotype. Mann–Whitney test results: marfWT versus CMT2A alleles ***P < 0.001. R364W like or L76P like versus same condition + drp1: ¤¤¤P < 0.001. “Paralysis”: NGT not performed on T105M like flies because these animals are completely paralyzed.
- A
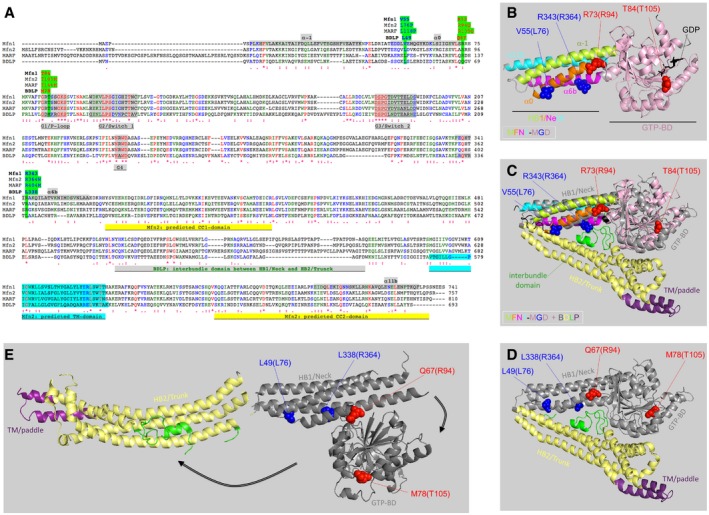
Sequence alignment of human MFN1 and MFN2, Drosophila MARF, and cyanobacterial BDLP. The position of MFN2 mutations and homologous residues is highlighted in green. Other highlighted features are as follows: alpha‐helices of helix bundle HB1/Neck in the 3D structure of MFN1 (a1, a0, a6b, a11b), GTP‐binding motifs G1 to G4, coiled‐coil/CC domains, and transmembrane/TM domains predicted in MFN2 and interbundle domain in BDLP 3D structure.
- B
Structure of GDP‐bound MFN1‐MGD (5GNT). The MFN1 residues homologous to mutated MFN2 residues (in brackets) are shown in blue or red. R94 is located at the boundary between HB1 and the GTP‐binding domain (GTP‐BD), and T105 is within the G1‐motif of the GTPase domain. L76 and R364 are both parts of HB1. Color code of protein domains: helices of HB1/Neck: green, orange, pink, cyan; GTP‐binding domain: light pink.
- C
Structural alignment of GDP‐bound MFN1‐MGD (color codes as in B) and “closed” conformation of GDP‐bound BDLP (2J68). Color codes of BDLP domains: GTP‐BD & HB1/Neck: gray, HB2/Trunk: yellow, TM/paddle: purple and interbundle: green.
- D, E
Structure of “closed”, GDP‐bound BDLP (2J68, D) and of “extended”, GTP‐bound BDLP (2W6D, E). Arrows point to major changes in the relative position/orientation of the GTP‐binding domain and the trunk (color codes as in C). The BLDP residues homologous to mutated MFN2 residues (in brackets) are shown in blue or red.
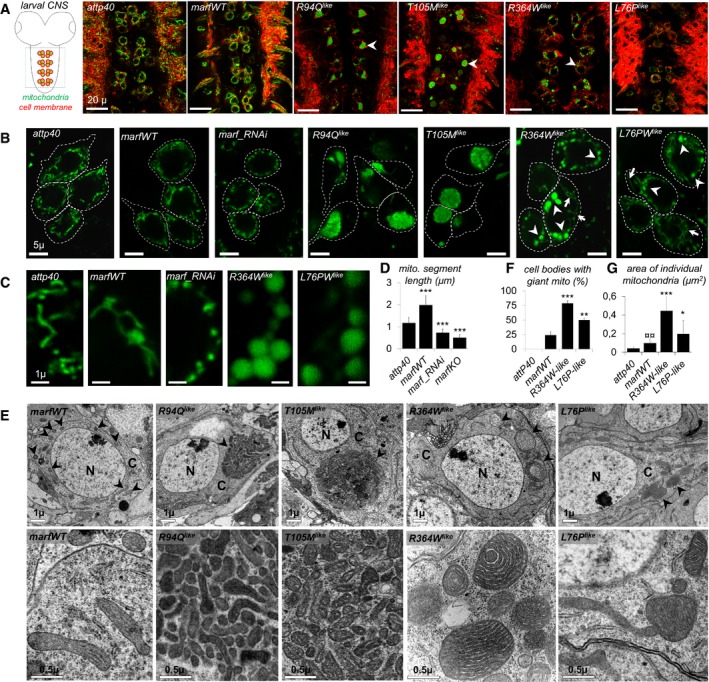
Scheme and confocal imaging of living larval ventral nerve cord showing midline motor neurons targeted by the OK371‐GAL4 driver (red: plasma membrane/myr::RFP; green mitochondria/mit::dendra2). Arrowheads point to cell bodies with abnormal mitochondrial distribution/shape. Scale bars 20 μm.
Higher magnification views of living motor neuron cell bodies showing mitochondrial morphology (green: mitochondria/mit::dendra2). To facilitate mitochondrial observation, myr::RFP staining was used to draw the outline of the cell (dotted lines). R364W like or L76P like, arrowheads point to enlarged spherical mitochondria and arrows to mitochondrial tubules. See also: motor neuron‐specific staining in Appendix Fig S1 and similar mitochondrial alterations induced upon pan‐neuronal expression of the CMT2A alleles with the elav‐GAL4 driver Fig EV2. Scale bars 5 μm.
Higher magnification views of mitochondria (green: mitochondria/mit::dendra2; living tissue). Scale bars 1 μm.
Quantification of mitochondrial segment length (μm) (number of mitochondria analyzed: attp40/212, marfWT/124, marf_RNAi/95, marf KO/79). ±SEM. Mann–Whitney U test results (versus attP40): ***P < 0.001.
Transmission electron microscopy sections of ventral nerve cord from larvae expressing the different marf alleles. Top panels: neuron cell body section showing cytoplasmic compartments (scale bars 1 μm). Arrowheads point to mitochondria. N, nucleus; C, cytoplasm. Bottom panels: higher magnification views (scale bars 0.5 μm).
Average number of cell bodies containing giant spherical mitochondria (number of neurons analyzed: attp40/80, marfWT/72, R364W like/96, L76P like/118; four independent larval brains). ±SEM. Mann–Whitney U test results (versus marfWT): ***P < 0.001, **P < 0.01.
Area quantification of individual mitochondria (μm2). Number of mitochondria analyzed on EM sections: attp40/101, marfWT/118, R364W like/190. ±SEM. Mann–Whitney U test results: R364W like or L76P like versus marfWT ***P < 0.001 and *P < 0.05; marfWT versus attp40 ¤¤P < 0.01.
Expression of the marf CMT2A alleles in motor neurons of marf knockout larvae (marf KO /Y; OK371‐GAL4, UAS‐mit::dendra2). Arrows show mitochondrial spheres (living tissue). Although expression of marf wild‐type or CMT2A transgenes in motor neurons rescues or modifies mitochondrial morphology, it does not rescue developmental delay and lethality of marf knockout larvae due to the lack of marf in whole body (see Appendix Fig S2 and methods for additional details regarding marf knockout animals). Scale bars 2.5 μm.
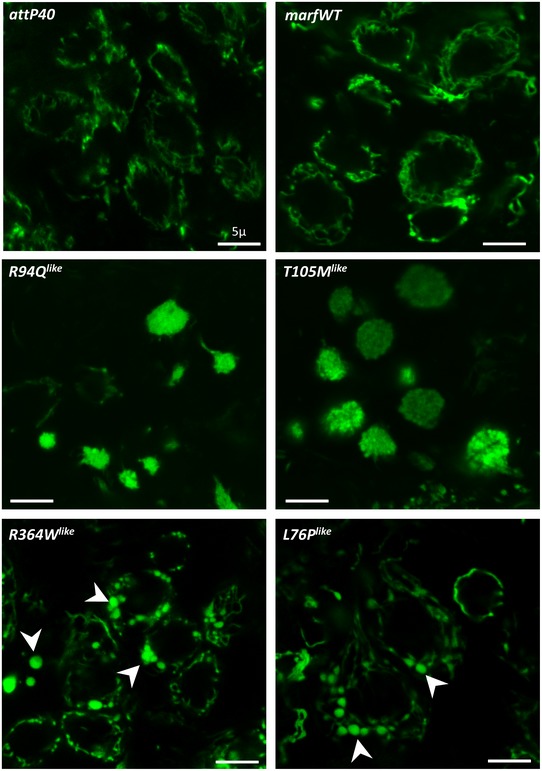
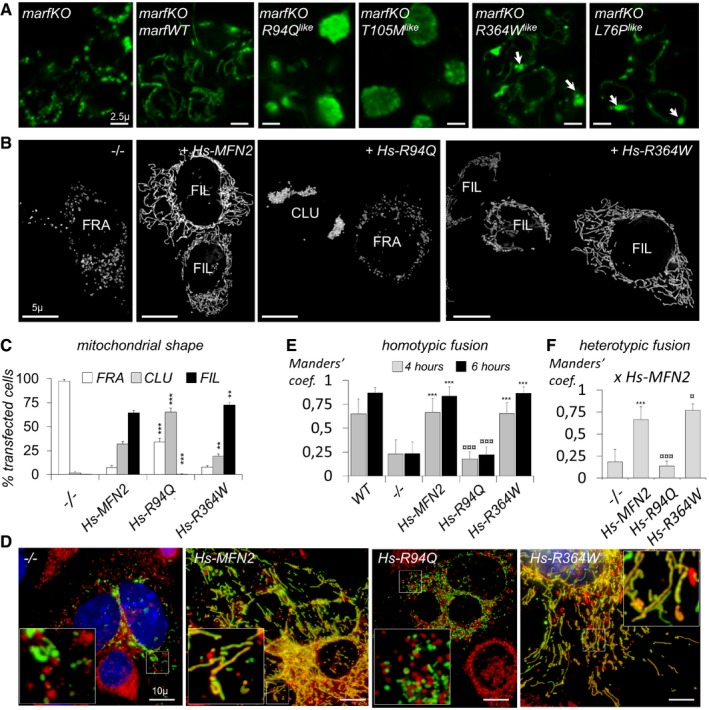
Mouse embryonic fibroblasts devoid of MFN1 and MFN2 (MFN1/MFN2‐null cells) were transfected with mtGFP (GFP targeted to the mitochondrial matrix) alone (−/−) or co‐transfected with wild‐type human (Hs) MFN2 or with the R94Q or R364W mutants. Visualization of mitochondrial morphology by fluorescence microscopy of mtGFP. Bar: 5 μm. Cells display fragmented (FRA), filamentous (FIL), and/or clustered (CLU) mitochondrial compartments. (see Fig EV4 for T105M and L76P and rescue with wild type mouse MFN2 or Drosophila marf). Scale bars 5 μm.
Percentage of transfected mtGFP‐positive cells displaying fragmented (FRA), filamentous (FIL), and/or clustered (CLU) mitochondrial morphology (mean ± SD). Number of transfections = 5 (no MFN), 10 (Hs‐MFN2), 6 (R94Q), 7 (R364W). Mann–Whitney U test results (versus Hs‐MFN2): **P < 0.01, ***P < 0.001.
Polykaryons obtained by PEG‐induced plasma membrane fusion of MEFs expressing GFP targeted to the matrix (mtGFP) or mCherry targeted to the outer membrane (mChOM). Images were taken 6 h after PEG‐induced fusion. Fused mitochondria exchange red and green fluorescent proteins and appear doubly labeled. Unfused mitochondria remain singly labeled. DAPI‐labeled nuclei appear in blue. Pictures show MFN1/MFN2‐null MEFs (−/−) or MFN1/MFN2‐null MEFs expressing wild‐type (Hs‐MFN2) or mutant human MFN2 alleles (Hs‐R94Q and Hs‐R364W). Scale bars 10 μm.
Histograms show the mean ± SD of the Manders’ colocalization coefficient for mtGFP in homotypic fusion assay as shown in (C). WT (wild‐type MEFs), −/− (MFN1/MFN2‐null MEFs), Hs‐MFN2 (−/− transduced with human wild‐type MFN2), Hs‐R94Q, and Hs‐R364W (−/− transduced with corresponding human MFN2 alleles). Results are shown 4 or 6 h after PEG‐induced fusion. Polykaryons analyzed (4 h/6 h): WT (15/15), −/− (15/15), Hs‐MFN2 (25/15), Hs‐R94Q (15/15), Hs‐R364W (25/15). Mann–Whitney U test results (* versus −/− 4 or 6 h, ¤ versus Hs‐MFN2 4 or 6 h): ***P < 0.001, ¤¤¤P < 0.001.
Histograms show the mean ± SD of the Manders’ colocalization coefficient for mtGFP in heterotypic experiments (PEG‐induced fusion of MFN −/− MEFs expressing Hs‐MFN2, labeled with mtGFP, with MFN −/− MEFs expressing Hs‐R94Q or Hs‐R364W, labeled with mCherryOM). Images are shown in Fig EV4D and were taken 4 h after PEG‐induced fusion. Mann–Whitney U test results (* versus −/−, ¤ versus Hs‐MFN2): ***P < 0.001, ¤¤¤P < 0.001, ¤P < 0.05. Polykaryons analyzed: −/− (15), Hs‐MFN2 (25), Hs‐R94Q (15), Hs‐R364W (15).
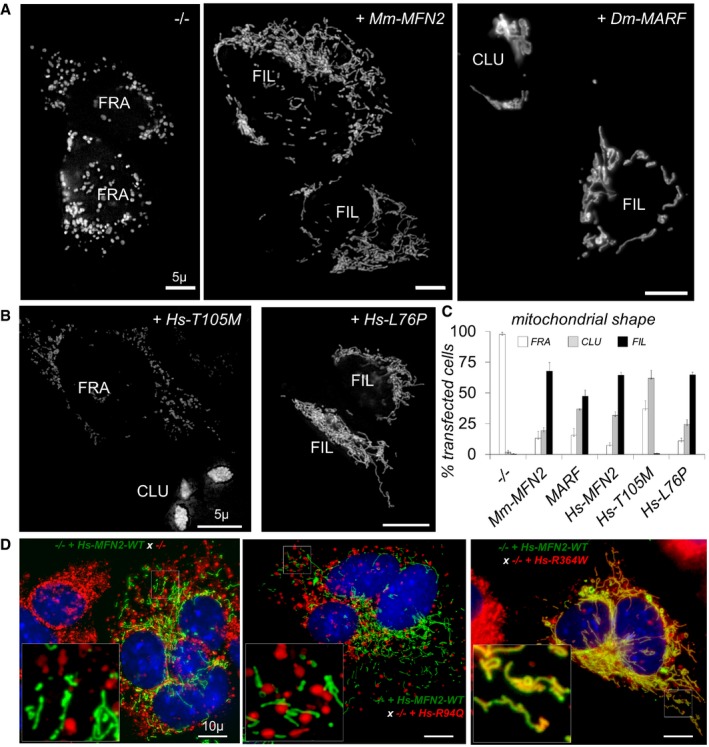
Cells devoid of MFN1 and MFN2 were transfected with mtGFP alone (−/−) or co‐transfected with mouse (Mm) MFN2 or Drosophila (Dm) MARF. Cells display fragmented (FRA), filamentous (FIL), and/or clustered (CLU) mitochondrial compartments. Scale bars 5 μm.
Cells devoid of MFN1 and MFN2 (−/−) were transfected with mtGFP with human (Hs) MFN2‐T105M or L76P. Cells display fragmented (FRA), filamentous (FIL), and/or clustered (CLU) mitochondrial compartments. Scale bars 5 μm.
Percentage of transfected mtGFP cells with fragmented (FRA), filamentous (FIL), or clustered (CLU) mitochondrial morphology (mean ± SD). Number of transfections = 5 (−/−), 5 (Mm‐MFN2/mouse), 3 (MARF), 10 (Hs‐MFN2/human), 6 (Hs‐T105M), and 3 (Hs‐L76P).
Heterotypic PEG‐induced fusion of MFN −/− MEFs expressing Hs‐MFN2 (green, labeled with mtGFP) with MFN −/− MEFs expressing Hs‐R94Q or Hs‐R364W (red, labeled with mCherryOM) (4 h after fusion). Quantitative analysis is shown in Fig 3F. Scale bars 10 μm.

Confocal images of mitochondria showing the presence of large mitochondrial spheres (arrowheads) in living larval motor neurons (OK371‐GAL4; UAS‐mit::dendra2) expressing the marfWT Strong transgene (marf over‐expression at higher expression level than our UAS‐marfWT transgene), or drp1 K38A (dominant negative DRP1), or drp1 K38A + marf_RNAi (RNAi against marf). White line: plasma membrane according to myr::RFP staining. Scale bars 5 μm.
Confocal images of mitochondria (mit::dendra2) in living larval motor neurons expressing marfWT, R364W like, R94Q like in conjunction with various UAS transgene. + drp1: over‐expression of the fission effector DRP1; + drp1 K38A over‐expression of dominant negative DRP1; and + OPA1_RNAi: RNAi downregulation of the fusion factor OPA1. White line: plasma membrane according to myr::RFP staining. Scale bars 5 μm.
Quantification of the number of cells containing giant spherical mitochondria ± SEM. Number of cells analyzed: R364W like/96, R364W like + drp1/70. Mann–Whitney U test results: R364W like versus R364W like + drp1 ***P < 0.01.
TEM images of neurons from larval ventral nerve cords. Top panels: cell bodies (arrowheads, mitochondria; N, nucleus; C, cytoplasm); scale bars 1 μm. Bottom panels: higher magnification images highlighting mitochondrial morphology; scale bars 0.5 μm. + drp1: over‐expression of drp1 and + drp1 K38A: dominant negative DRP1.
Size distribution of individual mitochondria (area μm2). Number of mitochondria analyzed: attp40/101, marfWT/118, R364W like/190, R364W like +drp1/108, R364W like + drp1 K38A/44. Mann–Whitney U test results performed on the average value of the area: attp40 versus marfWT P < 0.05; marfWT versus R364W like P < 0.001, R364W like versus R364W like + drp1 P < 0.001, R364W like versus R364W like + drp1 K38A P < 0.01.
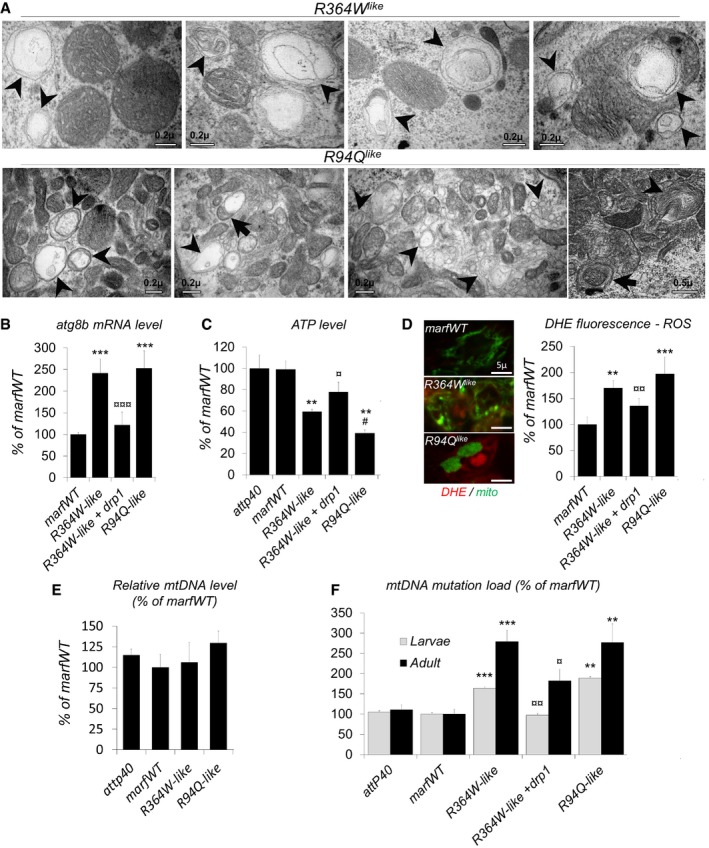
Transmission electron microscopy images from larval ventral nerve cord expressing R364W like and R94Q like. Arrowheads show multi‐lamellar vesicular structures in the vicinity of mitochondria evocating autophagy figures. These structures sometimes contained mitochondria (arrows). Scale bars 0.2 μm.
qRT–PCR on third‐instar larvae central nervous system showing atg8b mRNA level ± SEM relative to control (elav>marfWT). Mean value obtained for four independent mRNA extracts each from 12 dissected brains. Mann–Whitney U test results: marfWT versus R364W like or R94Q like ***P < 0.001; R364W like versus R364W like + drp1 ¤¤¤P < 0.001.
Average ATP level in third‐instar larval brains (% of control level) ± SEM. Three independent experiments performed on extracts from five elav‐GAL4 adult fly brains. Mann–Whitney U test results: marfWT versus R364W like , R94Q like **P < 0.01; R364W like versus R94Q like # P < 0.05, R364W like versus R364W like + drp1 ¤P < 0.05.
Images show DHE staining in neuron cell bodies from larval ventral nerve cord (scale bars 5 μm). Quantification of ROS labeling intensity ± SEM (ImageJ). Number of cell bodies analyzed marfWT/194, R94Q like/93, R364W like/162, R364W like + drp1/221 (from 10 to 12 larval brains). Mann–Whitney U test results: marfWT versus R364W like , R94Q like: **P < 0.01; ***P < 0.001; R364W like versus R364W like + drp1 ¤¤P < 0.001.
Relative mtDNA levels measured by quantitative real‐time PCR ± SEM. Normalization is based on the amplification of nuclear rp49 gene. Three independent qRT–PCR experiments each done on DNA extracts from 12 elav‐GAL4 dissected adult fly brains (3‐day‐old flies). No statistically significant difference.
Relative mitochondrial DNA (mtDNA) mutation load determined by RMC in extracts from elav‐GAL4 UAS‐marf (WT, R94Q like , and R364W like) dissected third‐instar larval CNS and adult brains (3‐day‐old flies). ±SEM. After extraction, DNA is digested by TaqI restriction enzyme and submitted to PCR. Primers flanking a TaqI site are used to amplify only mtDNA fragments in which the TaqI site sequence has been mutated. The amount of mutated DNA is normalized to total mtDNA level (determined by qRT–PCR using primers which do not flank a TaqI site). Eight independent experiments for marfWT, seven for R364W like, three for R364W like + drp1, and three for R94Q like. DNA extracts were prepared from 12 dissected larval CNS or adult brains. Mann–Whitney U test results: marfWT versus R364W like , R94Q like: ***P < 0.001, **< 0.01; R364W like versus R364W like + drp1 ¤¤P < 0.001, ¤ < 0.05.
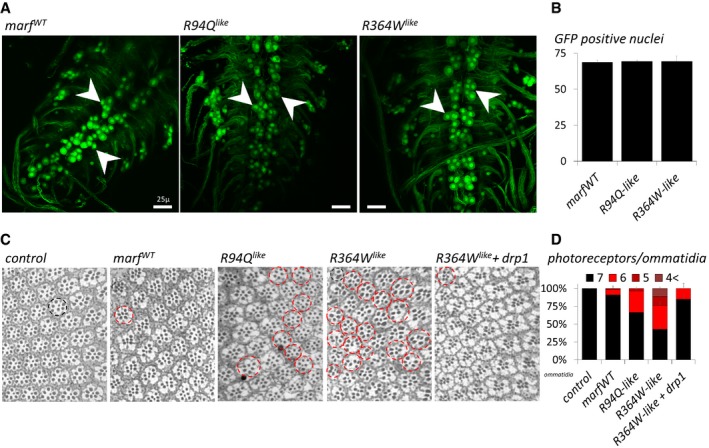
OK371‐GAL4; UAS‐nls::GFP larval ventral nerve cords (confocal Z‐projections) expressing UAS transgenes carrying the marfWT, R94Q like , or R364W like alleles. NLS::GFP preferentially accumulates in nuclei but additional cytoplasmic staining is also present in cell bodies and neurites. Arrowheads show clusters of middle motor neurons. Scale bars 5 μm.
Average number of GFP positive nuclei from midline motor neurons showing no difference between genotypes (three ventral nerve cords analyzed per genotypes). ±SD.
Eye sections from 3‐day‐old flies stained with toluidine blue. In control animals, each ommatidium (black circle) invariably contains seven photoreceptors. Red circles highlight ommatidia showing photoreceptor loss. The UAS‐marf and drp1 transgenes are expressed under the control of elav‐GAL4.
Percent of ommatidia containing seven, six, five, or at most four photoreceptors for each genotype. Results from three eye sections per genotype. Number of ommatidia analyzed: attp40 (control) (176), marfWT (227), R94Q‐like (311), R364W‐like (312), and R364W‐like + drp1 (183). ± SD.
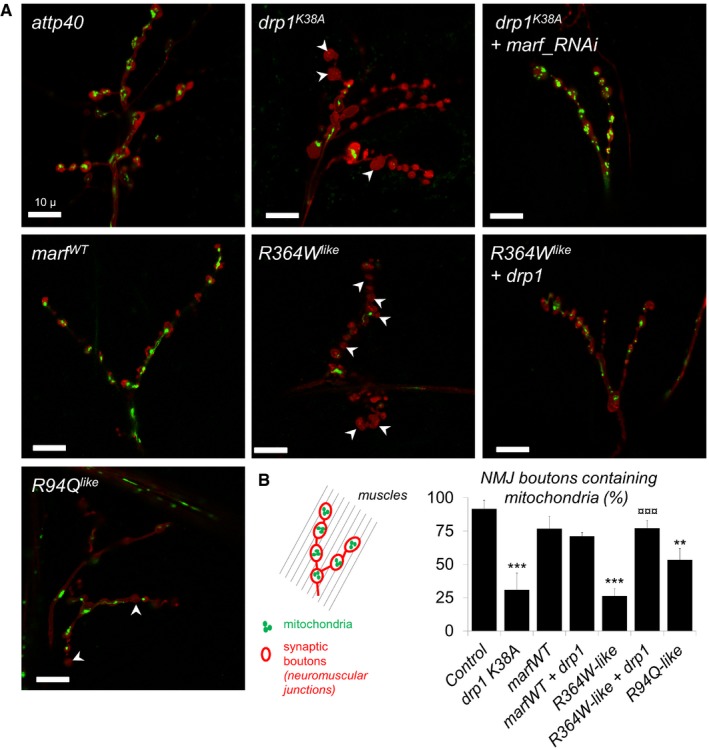
Confocal images of larval neuromuscular junctions (NMJ) targeted by OK371‐GAL4. Synaptic bouton membrane is stained in red (myr::RFP) and mitochondria in green (mit::dendra2). Arrowheads: boutons without mitochondria. Scale bars 10 μm.
Proportion of synaptic boutons with mitochondria staining ± SEM. Number of boutons analyzed: attp40/158, drp1 K38A/156, drp1 K38A marf_RNAi/172, marfWT/216, R94Q like/200, R364W like/129, R364W like +drp1/128. Mann–Whitney U test results: ***P < 0.001, **P < 0.01 (versus marfWT), ¤¤¤P < 0.001 (versus R364W like).
Comment in
-
Mitochondrial hyperfusion causes neuropathy in a fly model of CMT2A.EMBO Rep. 2018 Aug;19(8):e46502. doi: 10.15252/embr.201846502. Epub 2018 Jul 20. EMBO Rep. 2018. PMID: 30030216 Free PMC article.
Similar articles
-
Mfn2R364W, Mfn2G176S, and Mfn2H165R mutations drive Charcot-Marie-Tooth type 2A disease by inducing apoptosis and mitochondrial oxidative phosphorylation damage.Int J Biol Macromol. 2024 Oct;278(Pt 1):134673. doi: 10.1016/j.ijbiomac.2024.134673. Epub 2024 Aug 12. Int J Biol Macromol. 2024. PMID: 39142491
-
Burst mitofusin activation reverses neuromuscular dysfunction in murine CMT2A.Elife. 2020 Oct 19;9:e61119. doi: 10.7554/eLife.61119. Elife. 2020. PMID: 33074106 Free PMC article.
-
Mitochondrial Dysfunction and Pharmacodynamics of Mitofusin Activation in Murine Charcot-Marie-Tooth Disease Type 2A.J Pharmacol Exp Ther. 2022 Nov;383(2):137-148. doi: 10.1124/jpet.122.001332. Epub 2022 Sep 2. J Pharmacol Exp Ther. 2022. PMID: 36507849 Free PMC article.
-
Role of mitofusin 2 mutations in the physiopathology of Charcot-Marie-Tooth disease type 2A.Exp Neurol. 2009 Aug;218(2):268-73. doi: 10.1016/j.expneurol.2009.05.003. Epub 2009 May 8. Exp Neurol. 2009. PMID: 19427854 Review.
-
Charcot-Marie-Tooth type 2A in vivo models: Current updates.J Cell Mol Med. 2024 May;28(9):e18293. doi: 10.1111/jcmm.18293. J Cell Mol Med. 2024. PMID: 38722298 Free PMC article. Review.
Cited by
-
Myofibril and mitochondria morphogenesis are coordinated by a mechanical feedback mechanism in muscle.Nat Commun. 2021 Apr 7;12(1):2091. doi: 10.1038/s41467-021-22058-7. Nat Commun. 2021. PMID: 33828099 Free PMC article.
-
Grx2 Regulates Skeletal Muscle Mitochondrial Structure and Autophagy.Front Physiol. 2021 Mar 5;12:604210. doi: 10.3389/fphys.2021.604210. eCollection 2021. Front Physiol. 2021. PMID: 33762963 Free PMC article.
-
Acquired Expression of Mutant Mitofusin 2 Causes Progressive Neurodegeneration and Abnormal Behavior.J Neurosci. 2019 Feb 27;39(9):1588-1604. doi: 10.1523/JNEUROSCI.2139-18.2018. Epub 2019 Jan 3. J Neurosci. 2019. PMID: 30606759 Free PMC article.
-
A nerve-wracking buzz: lessons from Drosophila models of peripheral neuropathy and axon degeneration.Front Aging Neurosci. 2023 Aug 8;15:1166146. doi: 10.3389/fnagi.2023.1166146. eCollection 2023. Front Aging Neurosci. 2023. PMID: 37614471 Free PMC article. Review.
-
A dominant negative mitofusin causes mitochondrial perinuclear clusters because of aberrant tethering.Life Sci Alliance. 2022 Oct 13;6(1):e202101305. doi: 10.26508/lsa.202101305. Print 2023 Jan. Life Sci Alliance. 2022. PMID: 36229071 Free PMC article.
References
-
- Stuppia G, Rizzo F, Riboldi G, Del Bo R, Nizzardo M, Simone C, Comi GP, Bresolin N, Corti S (2015) MFN2‐related neuropathies: clinical features, molecular pathogenesis and therapeutic perspectives. J Neurol Sci 356: 7–18 - PubMed
-
- Verhoeven K, Claeys KG, Zuchner S, Schroder JM, Weis J, Ceuterick C, Jordanova A, Nelis E, De Vriendt E, Van Hul M et al (2006) MFN2 mutation distribution and genotype/phenotype correlation in Charcot‐Marie‐Tooth type 2. Brain 129: 2093–2102 - PubMed
-
- Chung KW, Kim SB, Park KD, Choi KG, Lee JH, Eun HW, Suh JS, Hwang JH, Kim WK, Seo BC et al (2006) Early onset severe and late‐onset mild Charcot‐Marie‐Tooth disease with mitofusin 2 (MFN2) mutations. Brain 129: 2103–2118 - PubMed
-
- Chung KW, Suh BC, Cho SY, Choi SK, Kang SH, Yoo JH, Hwang JY, Choi BO (2010) Early‐onset Charcot‐Marie‐Tooth patients with mitofusin 2 mutations and brain involvement. J Neurol Neurosurg Psychiatry 81: 1203–1206 - PubMed
Publication types
MeSH terms
Substances
Supplementary concepts
Grants and funding
LinkOut - more resources
Full Text Sources
Other Literature Sources
Medical
Molecular Biology Databases
Miscellaneous
