

hiPSC hepatocyte model demonstrates the role of unfolded protein response and inflammatory networks in α1-antitrypsin deficiency
- PMID: 29879455
- PMCID: PMC6562205
- DOI: 10.1016/j.jhep.2018.05.028
hiPSC hepatocyte model demonstrates the role of unfolded protein response and inflammatory networks in α1-antitrypsin deficiency
Abstract
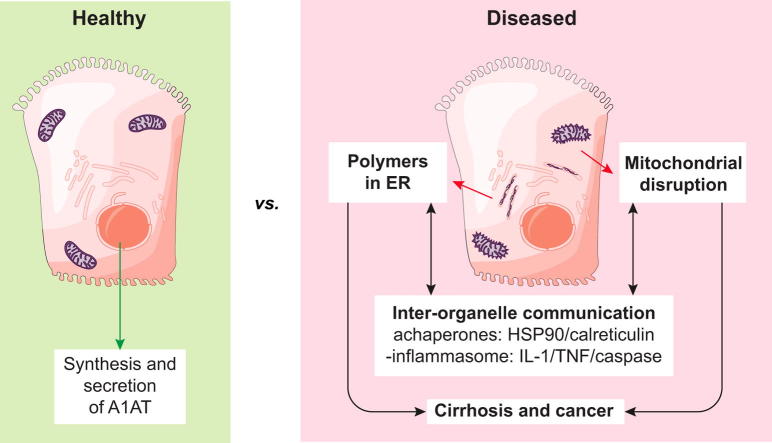
Background & aims: α1-Antitrypsin deficiency (A1ATD) is an autosomal recessive disorder caused by mutations in the SERPINA1 gene. Individuals with the Z variant (Gly342Lys) retain polymerised protein in the endoplasmic reticulum (ER) of their hepatocytes, predisposing them to liver disease. The concomitant lack of circulating A1AT also causes lung emphysema. Greater insight into the mechanisms that link protein misfolding to liver injury will facilitate the design of novel therapies.
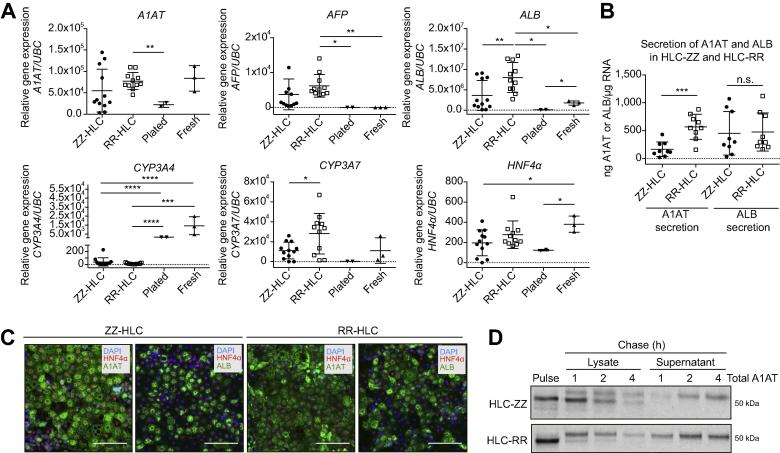
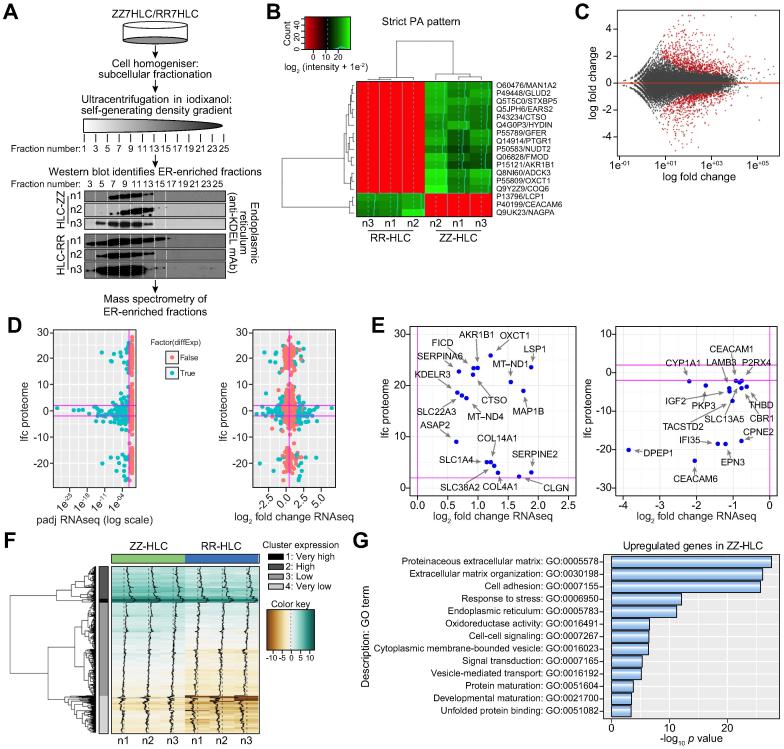
Methods: Human-induced pluripotent stem cell (hiPSC)-derived hepatocytes provide a novel approach to interrogate the molecular mechanisms of A1ATD because of their patient-specific genetic architecture and reflection of human physiology. To that end, we utilised patient-specific hiPSC hepatocyte-like cells (ZZ-HLCs) derived from an A1ATD (ZZ) patient, which faithfully recapitulated key aspects of the disease at the molecular and cellular level. Subsequent functional and "omics" comparisons of these cells with their genetically corrected isogenic-line (RR-HLCs) and primary hepatocytes/human tissue enabled identification of new molecular markers and disease signatures.
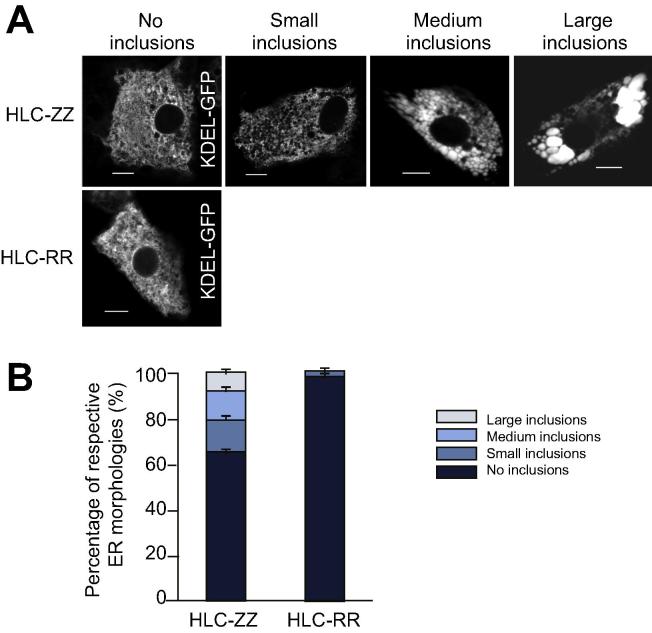
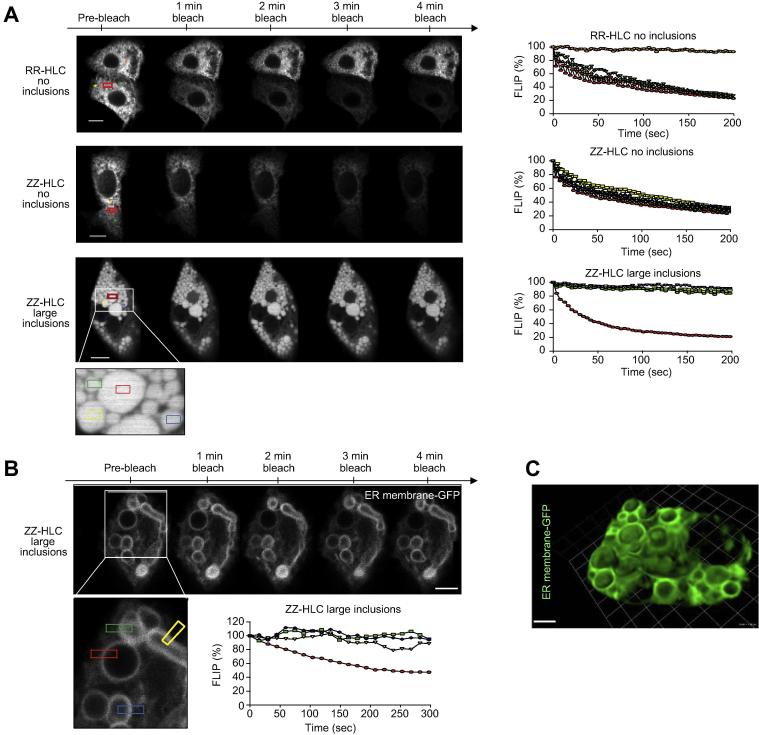
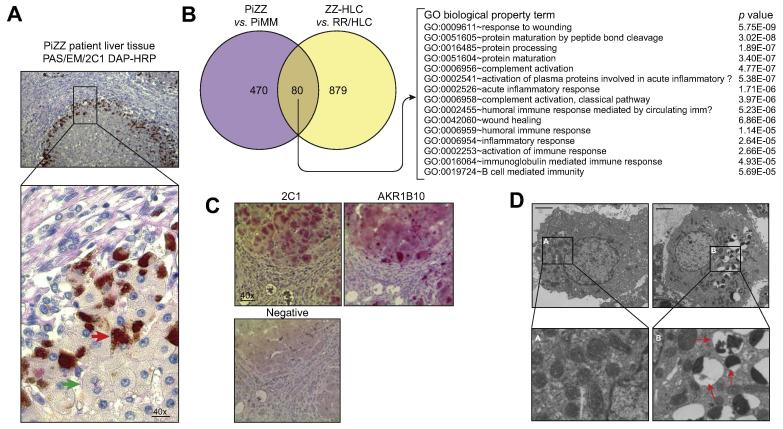
Results: Our studies showed that abnormal A1AT polymer processing (immobilised ER components, reduced luminal protein mobility and disrupted ER cisternae) occurred heterogeneously within hepatocyte populations and was associated with disrupted mitochondrial structure, presence of the oncogenic protein AKR1B10 and two upregulated molecular clusters centred on members of inflammatory (IL-18 and Caspase-4) and unfolded protein response (Calnexin and Calreticulin) pathways. These results were validated in a second patient-specific hiPSC line.
Conclusions: Our data identified novel pathways that potentially link the expression of Z A1AT polymers to liver disease. These findings could help pave the way towards identification of new therapeutic targets for the treatment of A1ATD.
Lay summary: This study compared the gene expression and protein profiles of healthy liver cells and those affected by the inherited disease α1-antitrypsin deficiency. This approach identified specific factors primarily present in diseased samples which could provide new targets for drug development. This study also demonstrates the interest of using hepatic cells generated from human-induced pluripotent stem cells to model liver disease in vitro for uncovering new mechanisms with clinical relevance.
Keywords: Hepatocyte; Human-induced pluripotent stem cell; Inflammation; Inherited liver disease; α(1)-Antitrypsin deficiency.
Copyright © 2018 The Authors. Published by Elsevier B.V. All rights reserved.
Figures

Similar articles
-
Endoplasmic reticulum polymers impair luminal protein mobility and sensitize to cellular stress in alpha1-antitrypsin deficiency.Hepatology. 2013 May;57(5):2049-60. doi: 10.1002/hep.26173. Epub 2013 Mar 14. Hepatology. 2013. PMID: 23197448 Free PMC article.
-
α1-Antitrypsin deficiency.Nat Rev Dis Primers. 2016 Jul 28;2:16051. doi: 10.1038/nrdp.2016.51. Nat Rev Dis Primers. 2016. PMID: 27465791 Review.
-
A transgenic zebrafish model of hepatocyte function in human Z α1-antitrypsin deficiency.Biol Chem. 2019 Nov 26;400(12):1603-1616. doi: 10.1515/hsz-2018-0391. Biol Chem. 2019. PMID: 31091192
-
Activation of endoplasmic reticulum-specific stress responses associated with the conformational disease Z alpha 1-antitrypsin deficiency.J Immunol. 2004 May 1;172(9):5722-6. doi: 10.4049/jimmunol.172.9.5722. J Immunol. 2004. PMID: 15100318
-
The molecular and cellular pathology of α₁-antitrypsin deficiency.Trends Mol Med. 2014 Feb;20(2):116-27. doi: 10.1016/j.molmed.2013.10.007. Epub 2013 Dec 25. Trends Mol Med. 2014. PMID: 24374162 Review.
Cited by
-
Adenine base editing reduces misfolded protein accumulation and toxicity in alpha-1 antitrypsin deficient patient iPSC-hepatocytes.Mol Ther. 2021 Nov 3;29(11):3219-3229. doi: 10.1016/j.ymthe.2021.06.021. Epub 2021 Jul 2. Mol Ther. 2021. PMID: 34217893 Free PMC article.
-
Polymerogenic neuroserpin causes mitochondrial alterations and activates NFκB but not the UPR in a neuronal model of neurodegeneration FENIB.Cell Mol Life Sci. 2022 Jul 21;79(8):437. doi: 10.1007/s00018-022-04463-3. Cell Mol Life Sci. 2022. PMID: 35864382 Free PMC article.
-
Proteostasis Perturbations and Their Roles in Causing Sterile Inflammation and Autoinflammatory Diseases.Cells. 2022 Apr 22;11(9):1422. doi: 10.3390/cells11091422. Cells. 2022. PMID: 35563729 Free PMC article. Review.
-
Liver Fibrosis-From Mechanisms of Injury to Modulation of Disease.Front Med (Lausanne). 2022 Jan 11;8:814496. doi: 10.3389/fmed.2021.814496. eCollection 2021. Front Med (Lausanne). 2022. PMID: 35087852 Free PMC article. Review.
-
A robust reprogramming strategy for generating hepatocyte-like cells usable in pharmaco-toxicological studies.Stem Cell Res Ther. 2023 Apr 18;14(1):94. doi: 10.1186/s13287-023-03311-w. Stem Cell Res Ther. 2023. PMID: 37072803 Free PMC article.
References
-
- Duvoix A., Roussel B.D., Lomas D.A. Molecular pathogenesis of alpha-1-antitrypsin deficiency. Rev Mal Respir. 2014;31:992–1002. - PubMed
MeSH terms
Substances
Grants and funding
- MC_PC_12009/MRC_/Medical Research Council/United Kingdom
- DH_/Department of Health/United Kingdom
- G1002610/MRC_/Medical Research Council/United Kingdom
- MR/N024842/1/MRC_/Medical Research Council/United Kingdom
- T32 HL007035/HL/NHLBI NIH HHS/United States
- NC/R001987/1/NC3RS_/National Centre for the Replacement, Refinement and Reduction of Animals in Research/United Kingdom
- WT_/Wellcome Trust/United Kingdom
- MR/L006537/1/MRC_/Medical Research Council/United Kingdom
- MR/R009120/1/MRC_/Medical Research Council/United Kingdom
- NC/N001540/1/NC3RS_/National Centre for the Replacement, Refinement and Reduction of Animals in Research/United Kingdom
- G0601840/MRC_/Medical Research Council/United Kingdom
LinkOut - more resources
Full Text Sources
Other Literature Sources
Medical
Molecular Biology Databases
Research Materials
Miscellaneous
