

Obesity, metabolic disease and the pancreas-Quantitative imaging of pancreatic fat
- PMID: 29869917
- PMCID: PMC6223168
- DOI: 10.1259/bjr.20180267
Obesity, metabolic disease and the pancreas-Quantitative imaging of pancreatic fat
Abstract
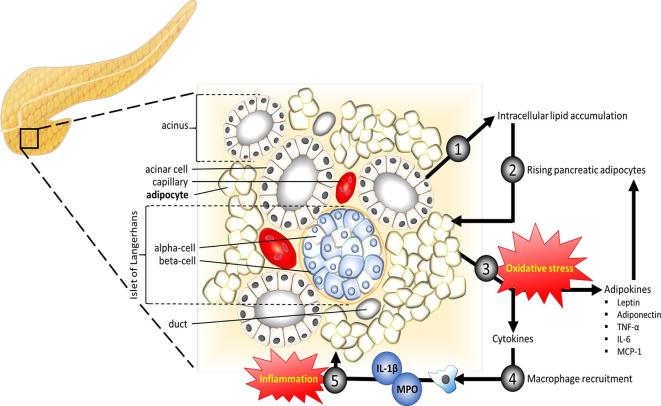
The association between pancreatic fat, obesity and metabolic disease is well-documented, and although a potentially exciting target for novel therapies, remains poorly understood. Non-invasive quantitative imaging-derived biomarkers can provide insights into pathophysiology and potentially provide robust trial endpoints for development of new treatments. In this review, we provide an overview of the pathophysiology of non-alcoholic fatty pancreas disease and associations with metabolic factors, obesity and diabetes. We then explore approaches to pancreatic fat quantification using ultrasound, CT and MRI, reviewing the strengths, limitations and current published evidence in the assessment of pancreatic fat. Finally, we explore the broader challenges of pancreatic fat quantification as we move toward translating these methods into the clinical setting.
Figures

Similar articles
-
Evaluation of fatty pancreas by proton density fat fraction using 3-T magnetic resonance imaging and its association with pancreatic cancer.Eur J Radiol. 2019 Sep;118:25-31. doi: 10.1016/j.ejrad.2019.06.024. Epub 2019 Jun 28. Eur J Radiol. 2019. PMID: 31439250
-
Non-Alcoholic Fatty Pancreas Disease (NAFPD): A Silent Spectator or the Fifth Component of Metabolic Syndrome? A Literature Review.Endocr Metab Immune Disord Drug Targets. 2018;18(6):547-554. doi: 10.2174/1871530318666180328111302. Endocr Metab Immune Disord Drug Targets. 2018. PMID: 29595117 Review.
-
Association between pancreatic fat and incidence of metabolic syndrome: a 5-year Japanese cohort study.J Gastroenterol Hepatol. 2018 Dec;33(12):2048-2054. doi: 10.1111/jgh.14266. Epub 2018 May 17. J Gastroenterol Hepatol. 2018. PMID: 29697157
-
Enlarged pancreas: not always a cancer.Hepatobiliary Pancreat Dis Int. 2015 Feb;14(1):107-8. doi: 10.1016/s1499-3872(15)60329-0. Hepatobiliary Pancreat Dis Int. 2015. PMID: 25655299
-
The Clinical Implications of Fatty Pancreas: A Concise Review.Dig Dis Sci. 2017 Oct;62(10):2658-2667. doi: 10.1007/s10620-017-4700-1. Epub 2017 Aug 8. Dig Dis Sci. 2017. PMID: 28791556 Review.
Cited by
-
Uniting epidemiology and experimental models: pancreatic steatosis and pancreatic cancer.EBioMedicine. 2022 May;79:103996. doi: 10.1016/j.ebiom.2022.103996. Epub 2022 Apr 8. EBioMedicine. 2022. PMID: 35405390 Free PMC article. Review.
-
Changes in Pancreatic Fat Content Following Diet-Induced Weight Loss.Nutrients. 2019 Apr 23;11(4):912. doi: 10.3390/nu11040912. Nutrients. 2019. PMID: 31018616 Free PMC article.
-
Non-invasive diagnosis of pancreatic steatosis with ultrasound images using deep learning network.Heliyon. 2024 Sep 6;10(17):e37580. doi: 10.1016/j.heliyon.2024.e37580. eCollection 2024 Sep 15. Heliyon. 2024. PMID: 39296003 Free PMC article.
-
Fatty Pancreas-Centered Metabolic Basis of Pancreatic Adenocarcinoma: From Obesity, Diabetes and Pancreatitis to Oncogenesis.Biomedicines. 2022 Mar 17;10(3):692. doi: 10.3390/biomedicines10030692. Biomedicines. 2022. PMID: 35327494 Free PMC article. Review.
-
Pancreas Optical Clearing and 3-D Microscopy in Health and Diabetes.Front Endocrinol (Lausanne). 2021 Apr 26;12:644826. doi: 10.3389/fendo.2021.644826. eCollection 2021. Front Endocrinol (Lausanne). 2021. PMID: 33981285 Free PMC article. Review.
References
-
- Moody A. Health Survey for England 2015: adult overweight and obesity. Leeds, UK: The British Institute of Radiology.; 2016.
-
- OECD. OECD obesity update. 2017. 2018. Available from: http://www.oecd.org/health/obesity-update.htm.
-
- Ogilvie RF. The islands of langerhans in 19 cases of obesity. J Pathol Bacteriol 1933; 37: 473–81. doi: 10.1002/path.1700370314 - DOI
Publication types
MeSH terms
LinkOut - more resources
Full Text Sources
Other Literature Sources
Medical
