. 2018 Jul 13;293(28):11119-11130.
doi: 10.1074/jbc.RA118.002191. Epub 2018 May 23.

Protein kinase Cα drives fibroblast activation and kidney fibrosis by stimulating autophagic flux

Affiliations

Protein kinase Cα drives fibroblast activation and kidney fibrosis by stimulating autophagic flux

Xian Xue et al. J Biol Chem. .

Abstract

Kidney fibrosis is a histological hallmark of chronic kidney disease and arises in large part through extracellular matrix deposition by activated fibroblasts. The signaling protein complex mTOR complex 2 (mTORC2) plays a critical role in fibroblast activation and kidney fibrosis. Protein kinase Cα (PKCα) is one of the major sub-pathways of mTORC2, but its role in fibroblast activation and kidney fibrosis remains to be determined. Here, we found that transforming growth factor β1 (TGFβ1) activates PKCα signaling in cultured NRK-49F cells in a time-dependent manner. Blocking PKCα signaling with the chemical inhibitor Go6976 or by transfection with PKCα siRNA largely reduced expression of the autophagy-associated protein lysosomal-associated membrane protein 2 (LAMP2) and also inhibited autophagosome-lysosome fusion and autophagic flux in the cells. Similarly to chloroquine, Go6976 treatment and PKCα siRNA transfection also markedly inhibited TGFβ1-induced fibroblast activation. In murine fibrotic kidneys with unilateral ureteral obstruction (UUO) nephropathy, PKCα signaling is activated in the interstitial myofibroblasts. Go6976 administration largely blocked autophagic flux in fibroblasts in the fibrotic kidneys and attenuated the UUO nephropathy. Together, our findings suggest that blocking PKCα activity may retard autophagic flux and thereby prevent fibroblast activation and kidney fibrosis.

Keywords: cell signaling; fibroblast; fibrosis; kidney; signal transduction.


Conflict of interest statement

The authors declare that they have no conflicts of interest with the contents of this article

Figures
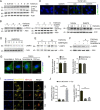
Figure 1.
Figure 1.
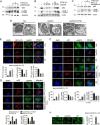
Inhibition of PKCα reduces LAMP2 expression and induces lysosomal dysfunction in NRK-49F cells. NRK-49F cells were treated with TGFβ1 (2 ng/ml) with or without the PKCα inhibitor Go6976 for different times as indicated. A, Western blotting analyses show the induction of PKCα and Akt phosphorylation after TGFβ1 treatment in a time-dependent manner. Cell lysates were immunoblotted with Abs against p-Akt (Ser-473), p-PKCα, and actin, respectively. B, Western blotting analyses revealing the remarkable reduction of PKCα but not Akt or Smad3 phosphorylation after TGFβ1 and Go6976 treatment compared with TGFβ1 treatment alone. Cell lysates were immunoblotted with Abs against p-PKCα, p-Akt (Ser-473), Akt, p-Smad3, and actin, respectively. C, representative micrographs show the immunostaining for p-PKCα at 8 h after TGFβ1 (2 ng/ml) without Go6976 (5 μm) treatment. Cells were co-stained with DAPI to visualize the nuclei; scale bar, 5 μm. D, NRK-49F cells were treated with Go6976 for different time as indicated. Western blotting assay shows the down-regulation of LAMP2 expression after Go6976 treatment in a time-dependent manner. E, Western blotting analyses reveal the LAMP2 protein expression after TGFβ1 treatment and PKCα inhibitor Go6976 treated for different times or dosages as indicated. F, Western blotting analyses showing that knocking down PKCα reduced LAMP2 protein expression in NRK-49F cells. Cell lysates were immunoblotted with Abs against LAMP2 and actin, respectively. G, representative images showing the immunostaining for LAMP2 after various treatments as indicated. Cells were co-stained with DAPI to visualize the nuclei; scale bar, 5 μm. H, relative lysosomal NAG activity of Go6976-treated and PKCα siRNA-transfected NRK-49F cells. n = 4 independent experiments. I, representative confocal micrographs of lysosomes detected with the pH indicator LysoSensor yellow/blue after transfected RFP-LC3 plasmid for 24 h and then treated with vehicle, Go6976(5 μm), or CQ (50 μm) for 4 h; scale bar, 5 μm. J, blue/yellow ratio and merged dots/RFP-LC3 ratio are presented. **, p < 0.01; ***, p < 0.001 compared with vehicle (Veh)-treated cells, n = 5.
Figure 2.
Figure 2.
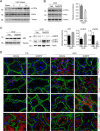
Inhibition of PKCα retards autophagic flux in NRK-49F cells. A and B, Western blotting assay showing the accumulation of LC3-I, LC3-II and SQSTM1/p62 protein after Go6976 or CQ treatment without TGFβ1 incubation. C, Western blotting assay revealing the accumulation of LC3-I, LC3-II, and SQSTM1/p62 after the transfection of PKCα siRNA without TGFβ1 treatment. D, representative transmission electron microscopic images of NRK-49F cells showing the accumulation of autophagosome in cells treated with Go6976 without TGFβ1 treatment. Cells were pretreated with vehicle or Go6976 (5 μm) for 30 min and then incubated without TGFβ1 for 4 h. E, representative images showing autophagosomes and lysosomes in NRK-49F cells. Yellow dots in merged images represent autolysosomes. Cells were transfected with RFP-LC3 for 24 h and then incubated with vehicle, Go6976 (5 μm), or CQ (50 μm) and TGFβ1 (2 ng/ml) for 4 h. Cells were co-stained with DAPI to visualize the nuclei; scale bar, 5 μm. Quantification of RFP-LC3 (red) puncta, LAMP2 (green) puncta, and merged dots/RFP-LC3 ratio (lower part) is shown. ***, p < 0.001 compared with vehicle-treated cells (n = 5–7); ###, p < 0.01 compared with Go6976-treated cells. F, representative images for SQSTM1/p62 and LAMP2 among different groups as indicated. Yellow dots in merged images represent colocalization of SQSTM1/p62 and LAMP2. Cells were co-stained with DAPI to visualize the nuclei; scale bar, 5 μm. Quantitative analysis for SQSTM1/p62 puncta/cell and merged dots/p62 in NRK-49F cells after various treatments is as indicated (lower part). *, p < 0.05; **, p < 0.01; ***, p < 0.001 compared with vehicle (Veh)-treated cells (n = 5–7); #, p < 0.05 compared with cells treated with Go6976. G, representative images for p62 and LAMP2 among different groups as indicated. Yellow dots in merged images represent colocalization of p62 and LAMP2. Cells were co-stained with DAPI to visualize the nuclei; scale bar, 5 μm. Quantitative analysis for p62 puncta/cell and merged dots/p62 in NRK-49F cells after various treatments as indicated (lower part). **, p < 0.01; ***, p < 0.001 compared with vehicle-treated cells (n = 5–7). H, lipid droplet clearance assays were performed with vehicle, Go6976, or CQ. Representative images of BODIPY staining of lipid droplets in NRK-49F cells at 4 h post-treatment with vehicle, Go6976, or CQ; scale bar, 5 μm. Quantification of BODIPY staining. n = 3 independent experiments. ***, p < 0.001 compared with vehicle-treated cells (n = 5–7); ###, p < 0.01 compared with Go6976-treated cells.
Figure 3.
Figure 3.
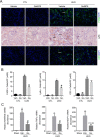
Inhibition of PKCα diminishes TGFβ1-induced fibroblast activation. A and B, Western blotting analyses showing that blocking PKCα could inhibit TGFβ1-induced FN and α-SMA) expression in a dose-dependent (A) and time-dependent (B, left) manner. Cell lysates were immunoblotted with Abs against FN, α-SMA, and actin, respectively. Representative micrographs showing the immunostaining for FN and α-SMA after various treatments are as indicated. NRK-49F cells were treated Go6976 and incubated with TGFβ1 for 48 h. Cells were co-stained with DAPI to visualize the nuclei; scale bar, 5 μm (B, right). C, NRK-49F cells were transfected with scrambled or PKCα siRNA for 24 h, followed by TGFβ1 treatment for 24 h. Western blotting analyses revealed the reduction of PKCα protein in NRK-49F cells at 24 h after PKCα siRNA transfection compared with scrambled siRNA transfection (left). Real time PCR analysis showing the reduction of PKCα mRNA abundance after PKCα siRNA-3 transfection. **, p < 0.01 compared with Scrambled siRNA transfection (n = 4). D, Western blotting analyses showed that knocking down PKCα blocked TGFβ1-induced FN and α-SMA expression. E, Western blot analysis revealed that CQ inhibited TGFβ1-induced FN and α-SMA expression. F, Western blot analysis revealed that 3-MA (10 mm) could inhibit TGFβ1-induced FN and α-SMA expression. Veh, vehicle.
Figure 4.
Figure 4.
Go6976 attenuates PKCα signaling activation and impairs interstitial myofibroblast autophagy in the UUO kidneys. A, Western blotting analyses showing the induction of phosphorylated protein kinase Cα (p-PKCα) in the kidneys with UUO nephropathy compared with sham control. B, Western blotting analyses showing the abundance of p-PKCα in the kidney lysates from mice after Go6976 (Go.) treatment. Graphic presentation shows the results of semi-quantitative analysis for p-PKCα protein abundance among groups. *, p < 0.05 compared with vehicle (Veh)-treated UUO kidneys (n = 5). C, Western blotting analyses showing the abundance of SQSTM1/p62, LC3, and LAMP2 in the kidneys at day 7 after UUO from mice after Go6976 treatment. Graphic presentation showing the semi-quantitative analysis for p62, LC3-II, and LampP2 protein abundance between groups as indicated. *, p < 0.05 compared with vehicle-treated UUO kidneys (n = 5). D, representative micrographs showing immunostaining results for p-PKCα and laminin, LC3, and laminin, SQSTM1/p62 and laminin, and LAMP2 and laminin in the kidneys at day 7 after UUO. Slides were counterstained with DAPI to visualize cell nuclei.
Figure 5.
Figure 5.
Blocking PKCα signaling diminishes kidney fibrosis after UUO. A, representative micrographs for PAS, Masson, and Sirius red staining in the kidney from different groups as indicated. White arrows indicate the fibrotic area. B, graphic presentation showing the kidney injury score and the percentage of fibrotic area in the kidney from different groups as indicated. *, p < 0.05 compared with vehicle (Veh.)-treated contralateral kidneys (n = 3–5); #, p < 0.05 compared with vehicle-treated UUO kidneys (n = 5). Go., Go6976.
Figure 6.
Figure 6.
Blocking PKCα signaling reduces FN and α-SMA expression in the UUO kidneys. A, Western blotting analyses showing the abundance of FN and α-SMA in the kidneys at 1 and 2 weeks after UUO without Go6976 (Go.) treatment. B, graphic presentation showing FN and α-SMA protein abundance from A in the different groups as indicated. *, p < 0.05 compared with contralateral kidneys (n = 3–5); #, p < 0.05 compared with UUO kidneys (n = 5). C, representative micrographs showing immunostaining for FN and α-SMA expression in various groups as indicated. Veh, vehicle.
Figure 7.
Figure 7.
Blocking PKCα signaling diminishes inflammatory response in the UUO kidneys. A, representative micrographs showing the immunostaining for F4/80, ly6b, and CD3 among different groups as indicated. Kidney sections were counterstained with DAPI to visualize the cell nuclei. Arrows indicate the inflammatory cells. B, graphic presentation showing quantitative analysis for F4/80, ly6b, and CD3-positive cells in the kidney tissues from various groups. *, p < 0.05 compared with sham kidneys (n = 3–5); #, p < 0.05 compared with UUO kidneys with vehicle (Veh) treatment (n = 5). C, graphic presentation showing the real-time PCR analysis results for RANTES, TNFα, and MCP1 in the kidney tissues among groups. *, p < 0.05 compared with sham kidneys (n = 3–5); #, p < 0.05 compared with UUO kidneys with vehicle treatment (n = 5). Go., Go6976.

Similar articles

Cited by

References

    1. Duffield J. S. (2014) Cellular and molecular mechanisms in kidney fibrosis. J. Clin. Invest. 124, 2299–2306 10.1172/JCI72267 - DOI - PMC - PubMed
    1. Liu Y. (2011) Cellular and molecular mechanisms of renal fibrosis. Nat. Rev. Nephrol. 7, 684–696 10.1038/nrneph.2011.149 - DOI - PMC - PubMed
    1. LeBleu V. S., Taduri G., O'Connell J., Teng Y., Cooke V. G., Woda C., Sugimoto H., and Kalluri R. (2013) Origin and function of myofibroblasts in kidney fibrosis. Nat. Med. 19, 1047–1053 10.1038/nm.3218 - DOI - PMC - PubMed
    1. Korolchuk D. V., Carroll D. B., and Lovat P. (2016) in Guidelines for the use and interpretation of assays for monitoring autophagy. Autophagy 12, 151–175 10.1080/15548627.2015.1100358 - DOI - PubMed
    1. Das G., Shravage B. V., and Baehrecke E. H. (2012) Regulation and function of autophagy during cell survival and cell death. Cold Spring Harb. Perspect. Biol. 4, a008813 - PMC - PubMed

Publication types

MeSH terms

Substances

LinkOut - more resources